The whole assignment please
Climate change (33 points)
Over recent years there has been much discussion of climate change. Heated debates have ensued over whether or not global warming is occurring. In addition, there has been a lot of debate over the cause. Some argue that climate is not changing. Others say global climate is warming and humans are entirely responsible. Others see humans as a contributor to global warming, but also cite natural cycles or processes as additional contributors. Still others believe climate change is occurring, but humans have no part in causing it.
In this lab, you will be examining climate data for Minneapolis/St. Paul specifically, the entire state of Minnesota, and the contiguous 48 states collectively. In addition, you will be gathering data for a location of your choice in another region of the country to add to your analysis of climate patterns. The data used for this lab are from NOAA’s National Centers for Environmental Information (NOAA, 2015).
Use Table A to help you complete questions 3-13. Table A shows average annual temperatures of the Minneapolis/St. Paul region of Minnesota over a 120-year period (1895-2014). Data have been grouped in ten-year groups (1895-1904, 1905-1914, etc.). The temperature is the annual average for that year. The rank is an ordering of how that year’s average compared to all other years in the data set; where “1” is the coldest yearly average and “120” is the warmest yearly average. Where averages are equal, they receive the same ranking. The anomaly column is the number of degrees Fahrenheit the average differed from the 100-year (1901-2000) average of 45.3°F. An annual average that equals the 100-year average would have an anomaly of zero. Averages for the average annual temperature and anomaly are given below each ten-year grouping in bold.
1a. A positive anomaly indicate that the annual average temperature was:
normal below normal above normal
b. A negative anomaly indicate that the annual average temperature was:
normal below normal above normal
2a. A temperature anomaly of 1.0°F means the average annual temperature was ___nearer____ normal compared to an anomaly of 2.0°F.
nearer farther from
b. A temperature anomaly of 1.0°F means the average annual temperature was ___farther from _______ normal compared to an anomaly of -2.0°F.
nearer farther from
3. Rank the ten-year groupings for the Minneapolis/St. Paul (MSP) data from coldest (1) average to warmest (12) average temperature in the chart below (Table 1). Do not fill out the data for MN and US ranking right now. You will complete the remainder of the table later on.
Table 1: Annual temperature rankings for Minneapolis/St. Paul, Minnesota, and the United States.
| Year span | MSP ranking | MN ranking | US ranking |
| 1895-1904 | |||
| 1905-1914 | |||
| 1915-1924 | |||
| 1925-1934 | |||
| 1935-1944 | |||
| 1945-1954 | |||
| 1955-1964 | |||
| 1965-1974 | |||
| 1975-1984 | |||
| 1985-1994 | 10 | 10 | 10 |
| 1995-2004 | 11 | 11 | 11 |
| 2005-2014 | 12 | 12 | 12 |
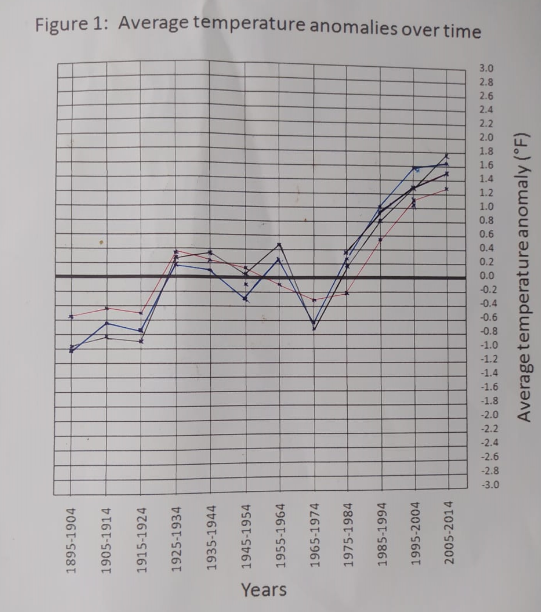
4. Graph the ten-year average anomalies over time on Figure 1 using a colored pencil. Record the color in the legend below the graph. Connect the data points with a line.
5. Using the graph, describe the temperature trend in MSP over the 120 year time span. Think about weather temperatures were increasing or decreasing as well as whether they were above or below normal across the 120-year period.
From 1895 to 1944, the temperatures were increasing and rose from below normal to above normal. Then from 1945 to 1954, the temperatures decreased but did not fall below normal. They then rose again in the next decade and dropped drastically in the later one to below normal. Since 1965, the temperatures have been rising gradually and they are above normal.
6. How many of the ten-year periods for the MSP data were below the 100-year average? 4
7. How many of the ten-year periods for the MSP data were above the 100-year average? 8
8. What was the coldest single year for the MSP data? How much below the 100-year average was that year? 1917, it was -4.9°F below the 100-year average.
9. What was the warmest single year for the MSP data? How much above the 100-year average was that year? 2012, it was 5.5°F above the 100-year average.
10. How much warmer was the warmest yearly average from the coldest yearly average? 3.47°F
11. For MSP in the last ten years, how many years ranked within the top ten warmest on record? 5 years Which years were these? 2005, 2006, 2007, 2010, and 2012
12. In the last ten years, how many times was the average annual temperature below the 100-year average? 2 times
13. In the last 30 years how many times was the average annual temperature below the 100-year average? 6 times
Minneapolis/St. Paul Minnesota
Red&blue
blue
black
United States ______California_________
red
Use Table B to help you complete questions 14-18. Table B shows average annual temperatures for the state of Minnesota over a 120-year period (1895-2014).
14. Rank the ten-year groupings for the Minnesota (MN) statewide data from coldest (1) average to warmest (12) average in Table 1. Do not fill out the data for the US ranking right now. You will complete the remainder of the table later on.
15. Are the average temperatures for the state of Minnesota as a whole greater than or less than the averages for the Twin Cities? Provide a possible explanation for the difference seen.
The average temperatures of Minnesota are less compared to the Twin cities. Minnesota is a state on the northern part with a vast forest cover on the higher latitude. The latitude and the forests make the average annual temperatures of the state low. The Twin Cities on the other had are located at a latitude of 44.97°N which makes it warmer.
16. Graph the ten-year average anomalies over time on Figure 1 using a different colored pencil than you used previously. Record the color in the legend below the graph. Connect the data points with a line.
17. Describe any similarities and differences between the statewide anomaly data and the Minneapolis/St. Paul data based on the pattern on the graph.
Both average temperatures rose between 1895 and 1904, but the statewide dropped between 1905 and 1914, then rose drastically to above normal between 1915 and 1924. The temperatures again dropped going below normal. Thereafter, both rose gradually. The difference to not is that the anomaly is much smaller for the statewide compared to the Minneapolis/St. Paul.
18. Based on the anomaly data, does the trend over the most recent 40 years appear to be more extreme, less extreme, or variable for the statewide (MN) data compared to the Minneapolis/St. Paul (MSP) data? Explain how you can tell.
The anomaly for the statewide (MN) is variable compared to the Minneapolis/St. Paul. This can be identified by looking at the blue and the black lines, there is a little variation between the two.
Use Table C to help you complete questions 19-22. Table C shows average annual temperatures for the contiguous (lower 48 states) United States over a 120-year period (1895-2014).
19. Rank the ten-year groupings for the United States (US) data from coldest (1) average to warmest (12) average in Table 1.
20. Are the average temperatures for the contiguous United States greater than or less than the averages for Minnesota? Provide a possible explanation for the difference seen.
The average temperatures for the contiguous are greater than those for Minnesota. This can be attributed to the latitude difference of the two locations. The contiguous is located at a lower latitude than Minnesota, which receives more solar radiation intensity, making it warmer.
21. Graph the ten-year average anomalies over time on Figure 1 using a different colored pencil than you used previously. Record the color in the legend below the graph. Connect the data points with a line.
22. Based on the anomalies, does the temperatures trend over the most recent 40 years appear to be more extreme, less extreme, or variable for the United States compared to Minnesota? Explain how you can tell.
The temperatures trend of the United States seems to be more extreme compared to the Minnesota one. By comparing the red and blue lines, the variation is quite much compared to the other lines.
You will now be examining data from one more location of your choice within the United States. One requirement is that the location you choose must have a climate record dating back to at least 1901. Go to the NOAA website: http://www.ncdc.noaa.gov/cag/time-series. Click on “Statewide” from the headings. For the timescale, select “Annual”. Change the start year to 1895 and the end year to 2014. Choose any state then click “Plot”.
Examine the graph. Below the graph’s title is the 100-year average (1901-2000). If the city you chose lists an average shorter than the 1901-2000 period, change the “Climate Division/City” to “Entire Region”. Click “Plot”. Average annual temperature, ranking, and anomaly data will appear below the graph. Record the information listed below based on your selection.
23. Region: ___Pacific______________ City, State: __San Diego, California_________________
24. 100-year (1901-2000) average temperature: ________57.4°F_____________________
25. Use the data below the graph to calculate the following averages and complete Table 2. You may just use the data from the last 40 years.
Table 2: Ten-year annual temperature and anomaly average.
| Year span | Temperature average | Anomaly average |
| 1975-1984 | 57.66 | 0.37 |
| 1985-1994 | 58.25 | 0.76 |
| 1995-2004 | 58.73 | 1.18 |
| 2005-2014 | 58.91 | 1.51 |
26. Graph the four ten-year average anomalies on Figure 1 using a different colored pencil or pen than you used previously. Record the color in the legend below the graph. Connect the data points with a line.
27. Were anomalies for your state of choice greater or lesser than those of the United States and Minnesota?
The anomalies are less compared to the Minnesota and greater compared to the United States.
Return to the NOAA website http://www.ncdc.noaa.gov/cag/time-series. Click on “Globe” found beneath “Time Series”. For the timescale, select “Annual”. Change the start year to 1895 and the end year to 2014. Click on “Plot”. A graph showing global temperature anomalies based on average annual global temperatures will appear.
28. How does the pattern depicted on the graph compare to that seen for the United States on Figure 1?
The pattern depicted has similar characteristics. Over the years, the average temperatures of both United States and the Globe has gradually increased.
References
NOAA. 2015. Climate at a glance. Retrieved on July 13, 2015 from http://www.ncdc.noaa.gov/cag/time- series.


97


