There are a few physics labs on the attached document. I need a tutor who understand college physics very well. The document might seen a bit long but its majority is just pictures to aid you in answe
Part A: STANDING WAVES ON A STRING Using PhET simulation12/27/2019
- OBJECTIVE
To study standing waves on a string and see the effects of changing the tension in the string,
- EQUIPMENT
PhET Simulation Wave on a String: https://phet.colorado.edu/en/simulation/wave-on-a-string
You can also reach this simulation by going to PhET, and looking for Wave on a String.
Theory: Standing Waves in Strings
For any wave with wavelength λ and frequency f, the speed, v, is
v = λf (1)
The speed of a wave on a string is also related to the tension in the string, T, and the linear density (=mass/length), μ, by
v2 = T/μ = λ2f2 (2)
L is the length of the string and n is the number of segments, antinodes, or harmonics. Since a segment is 1/2 wavelength then
λ = 2L/n where n = 1, 2, 3, … (3)
Solving Equation 2 for the tension yields:
T = μλ2f2 (4)
Which can also be written as:
 (5)
(5)
- PROCEDURE
- Constant Tension
- PROCEDURE
Open the software. Select: Oscillate, Amplitude = 0.10 cm, Damping = 0, Tension = Lowest, Fixed End.
Turn on the oscillator by pressing the large blue button with the arrow. You will see the wave going from left to right, hit the fixed end and reflect. The reflected waves will interfere with the waves going to the right.
Now adjust the frequency in the Signal Generator until you get a standing wave in one segment (i.e. the first harmonic). Note this frequency, and measure the wavelength by using the ruler tool.
Increase the frequency gradually until you obtain a standing wave in the 2nd, 3rd, 4th, and 5th harmonic. Record each frequency and wavelength.
Calculate the wavelength by using equation (3).
Calculate the velocity of the waves by using equation (1)
Change the oscillator to Pulse. Keep the pulse width small. Measure the time taken by the pulse to travel from the left to the right ends, and hence calculate the velocity of the pulse in the string. Repeat three times and take the average. Use this value as a second value of the speed of the wave.
Calculate the percent difference between the two speeds.
Repeat for the other two available tensions of the string. Case A: Lowest TensionNumber of Harmonic
( n )
Number of nodes
Wavelength
λ = 2L/n
( m )
Frequency
( Hz )
Speed of wave
V = λ*f
( m/s )
DATA TABLE
- Length of the string: _________
- Speed of the wave
| Trial number | Time for pulse to reach other end | Speed of the wave |
| Average speed of the wave | ||
Length of the string: ____________
- Case B: Medium Tension
| Number of Harmonic ( n ) | Number of nodes | Wavelength λ = 2L/n ( m ) | Frequency ( Hz ) | Speed of wave V = λ*f ( m/s ) |
- Speed of the wave
| Trial number | Time for pulse to reach other end | Speed of the wave |
| Average speed of the wave | ||
Length of the string: ____________
- Case C: Highest Tension
| Number of Harmonic ( n ) | Number of nodes | Wavelength λ = 2L/n ( m ) | Frequency ( Hz ) | Speed of wave V = λ*f ( m/s ) |
- Speed of the wave
| Trial number | Time for pulse to reach other end | Speed of the wave |
| Average speed of the wave | ||
6-21-2020 Adapted from manual from Dr. Kam Chu
- Objective
To study the electric field and electric potential around different charges.
- Equipment
PhET Simulation:
https://phet.colorado.edu/sims/html/charges-and-fields/latest/charges-and-fields_en.html
- Theory
There is an electric field surrounding a charge, in which another charge would experience an electric force. The strength of the electric field at a distance from a point charge is given by:
 (1)
(1)
Where  is the Coulomb Constant, q is the charge, and r is the distance from the charge. The unit vector
  points away from a positive charge, and towards a negative charge.
The electric potential due to a point charge is given by the equation:
 (2)
(2)
Where  is the electric potential (in volts), and is a scalar quantity.
In this Lab, we will use a PhET simulation to study the electric field and electric potential surrounding single and multiple point charges.
- Procedure
Play with the simulation (Charges and Fields) and get oriented with all the different options. This should help you understand the lab better. Note that you have positive and negative point charges, an electric field sensor (yellow circle), a tape measure and a voltmeter, that also makes the equipotential lines. For each case, take a screenshot and attach with your report. You may alsoturn on ‘gridlines’ if desired. Each small square of the grid is 10 cm wide and high.
Activity 1: Electric Field Lines and Equipotential Lines
1: Have one positive and one negative charge placed symmetrically in the field. Get the Electric field lines. Use the voltmeter to draw about ten equipotential lines (Figure 1 shows a related situation with a few equipotential lines)
2: Repeat with both charges being negative.
3: Repeat with both charges being positive.
4. Repeat with 4 positive charges (on top of each other, to create 4q) and one negative charge.
5. Parallel Plates: Put a large number of positive charges in a straight row (to look like a solid line). Make a negative line in the same way (parallel to the first). As an example, see figure 2. Get the electric field lines and Equipotential Lines between and surrounding the parallel plates.
6. Attach screenshot of the simulations in your report. Figure - 1
Figure-1: Parallel “plates”.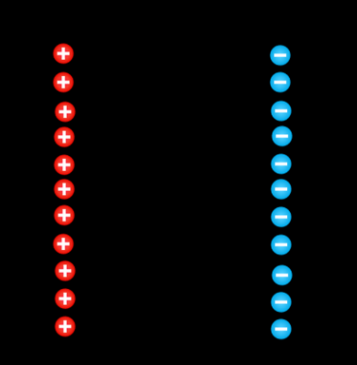

- ACTIVITY 2
Turn on ‘gridlines’.
Select positive point charge of any magnitude (you do this by placing the point charges on top of each other). Place the charge at the intersection of two thick gridlines, somewhere in the left half of the screen.
Use the tape measure and Voltmeter to find the voltage at different locations along the horizontal line on which the charge is placed. Enter values in Table 1.
Plot a graph in Excel between the voltage (y-axis) and the distance (x-axis).
Use Excel to determine the value of the Coulomb Constant
(see eqn. (2). Find the percent error between the calculated and accepted values.Use the tape measure and the yellow Electric Field sensor to measure the electric field at different distances in the horizontal direction from the charge. Enter the data in Table 2.
Plot a graph in Excel between the Electric Field (on y-axis) and distance (on x-axis)
Use Excel to determine the value of the Coulomb Constant
(see eqn. (1)). Find the percent error between the calculated and accepted values.Attach the screenshots, graphs and calculations to your report.
- DATA
Table 1
Charge = _________
| distance | |||||||
| voltage |
Value of k found from the graph: ___________
Percent error in k: ________________
Table 2
Charge = __________
| distance | |||||||
| Electric Field |
Value of k found from the graph: ___________
Percent error in k: ________________
7/1/2020
- OBJECTIVES
The purpose of this lab will be to determine how capacitors behave in R-C circuits by measuring the time for charging and discharging. The manner in which capacitors combine will also be studied.
- EQUIPMENT
PhET interactive simulation tool [Circuit Construction Kit: (AC+DC) - Virtual Lab]
https://phet.colorado.edu/en/simulation/legacy/circuit-construction-kit-ac-virtual-lab
- PROCEDURE
Open the simulation by ctrl+click the link, or copy paste the link to the browser. The simulation should look like that shown in Fig.6
Since this simulation is in java (and not web based as some of the others), you may have to download the simulation. If you cannot run the simulation, you may need to follow the following PhET help guidelines: https://phet.colorado.edu/en/help-center/running-sims
Then click “Why can Irun some of the simulations but not all?”
Run the simulation, and you will see a page like that shown in Fig.7.
You would not set up the circuit. For assistance in setting up the circuit, see the manual: 00PhET Simulation Tool Instructions for Electric Circuits Labs.
This experiment requires you to measure the voltage as a function of time. The timer can be easily controlled by using the Pause/Play button (►) and/or the step button (|►) (these are at the bottom of the page).