I need help with an analyais and calculations of 125 words please !!!Calculates and analyzes the following ratio listed for their selected company for the last two years from the SEC Form 10-K. . E
UNITED STATES
SECURITIES AND EXCHANGE COMMISSION
Washington, D.C. 20549
FORM 10-K
(Mark One)
|
| |
|
|
|
| | ANNUAL REPORT PURSUANT TO SECTION 13 OR 15(d) OF THE SECURITIES EXCHANGE ACT OF 1934 |
For the fiscal year ended February 3, 2017
or
|
| |
|
|
|
| | TRANSITION REPORT PURSUANT TO SECTION 13 OR 15(d) OF THE SECURITIES EXCHANGE ACT OF 1934 |
For the transition period from ________ to _________
Commission file number 1-7898

LOWE’S COMPANIES, INC.
(Exact name of registrant as specified in its charter)
|
| ||
|
|
|
|
| NORTH CAROLINA |
| 56-0578072 |
| (State or other jurisdiction of incorporation or organization) |
| (I.R.S. Employer Identification No.) |
|
| ||
|
|
|
|
| 1000 Lowe’s Blvd., Mooresville, NC |
| 28117 |
| (Address of principal executive offices) |
| (Zip Code) |
|
|
|
|
| Registrant’s telephone number, including area code |
| 704-758-1000 |
|
| ||
|
|
|
|
| Securities registered pursuant to Section 12(b) of the Act: | ||
| Title of each class |
| Name of each exchange on which registered |
| Common Stock, $0.50 Par Value |
| New York Stock Exchange (NYSE) |
Indicate by check mark if the registrant is a well-known seasoned issuer, as defined in Rule 405 of the Securities Act. Yes No
Indicate by check mark if the registrant is not required to file reports pursuant to Section 13 or Section 15(d) of the Exchange Act. Yes No
Indicate by check mark whether the registrant (1) has filed all reports required to be filed by Section 13 or 15(d) of the Securities Exchange Act of 1934 during the preceding 12 months (or for such shorter period that the registrant was required to file such reports), and (2) has been subject to such filing requirements for the past 90 days. Yes No
Indicate by check mark whether the registrant has submitted electronically and posted on its corporate Web site, if any, every Interactive Data File required to be submitted and posted pursuant to Rule 405 of Regulation S-T (§232.405 of this chapter) during the preceding 12 months (or for such shorter period that the registrant was required to submit and post such files). Yes No
Indicate by check mark if disclosure of delinquent filers pursuant to Item 405 of Regulation S-K (§229.405 of this chapter) is not contained herein, and will not be contained, to the best of registrant’s knowledge, in definitive proxy or information statements incorporated by reference in Part III of this Form 10-K or any amendment to this Form 10-K.
Indicate by check mark whether the registrant is a large accelerated filer, an accelerated filer, a non-accelerated filer, or a smaller reporting company. See the definitions of “large accelerated filer,” “accelerated filer,” and “smaller reporting company” in Rule 12b-2 of the Exchange Act. (Check one):
|
| |||
|
|
|
|
|
| Large accelerated filer | Accelerated filer | Non-accelerated filer | Smaller reporting company |
Indicate by check mark whether the registrant is a shell company (as defined in Rule 12b-2 of the Exchange Act). Yes No
As of July 29, 2016, the last business day of the Company’s most recent second quarter, the aggregate market value of the registrant’s common stock held by non-affiliates of the registrant was $72.4 billion based on the closing sale price as reported on the New York Stock Exchange.
Indicate the number of shares outstanding of each of the registrant’s classes of common stock, as of the latest practicable date.
|
| ||
|
|
|
|
| CLASS |
| OUTSTANDING AT 3/31/2017 |
| Common Stock, $0.50 par value |
| 857,332,918 |
DOCUMENTS INCORPORATED BY REFERENCE
|
| ||
|
|
|
|
| Document |
| Parts Into Which Incorporated |
| Portions of the Proxy Statement for Lowe’s 2017 Annual Meeting of Shareholders |
| Part III |
LOWE’S COMPANIES, INC.
- TABLE OF CONTENTS -
|
| |||
|
|
|
|
|
|
| Page No. | ||
| PART I |
| ||
|
| Item 1. | Business | 4 |
|
| Item 1A. | Risk Factors | 9 |
|
| Item 1B. | Unresolved Staff Comments | 14 |
|
| Item 2. | Properties | 14 |
|
| Item 3. | Legal Proceedings | 14 |
|
| Item 4. | Mine Safety Disclosures | 15 |
|
|
| Executive Officers and Certain Significant Employees of the Registrant | 16 |
|
|
|
|
|
| PART II |
| ||
|
| Item 5. | Market for Registrant’s Common Equity, Related Stockholder Matters and Issuer Purchases of Equity Securities | 17 |
|
| Item 6. | Selected Financial Data | 18 |
|
| Item 7. | Management’s Discussion and Analysis of Financial Condition and Results of Operations | 19 |
|
| Item 7A. | Quantitative and Qualitative Disclosures About Market Risk | 34 |
|
| Item 8. | Financial Statements and Supplementary Data | 36 |
|
| Item 9. | Changes in and Disagreements with Accountants on Accounting and Financial Disclosure | 69 |
|
| Item 9A. | Controls and Procedures | 69 |
|
| Item 9B. | Other Information | 69 |
|
|
|
|
|
| PART III |
| ||
|
| Item 10. | Directors, Executive Officers and Corporate Governance | 70 |
|
| Item 11. | Executive Compensation | 70 |
|
| Item 12. | Security Ownership of Certain Beneficial Owners and Management and Related Stockholder Matters | 70 |
|
| Item 13. | Certain Relationships and Related Transactions, and Director Independence | 70 |
|
| Item 14. | Principal Accountant Fees and Services | 70 |
|
|
|
| |
| PART IV |
| ||
|
| Item 15. | Exhibits and Financial Statement Schedules | 71 |
|
| Item 16. | Form 10-K Summary | 79 |
|
|
|
|
|
|
|
| Signatures | 80 |
Table of Contents
Part I
Item 1 - Business
General Information
Lowe’s Companies, Inc. and subsidiaries (the Company or Lowe’s) is a Fortune® 50 company and the world’s second largest home improvement retailer. As of February 3, 2017, Lowe’s operated 2,129 home improvement and hardware stores, representing approximately 213 million square feet of retail selling space. These operations were comprised of 1,820 stores located across 50 U.S. states, including 87 Orchard Supply Hardware (Orchard) stores, as well as 299 stores in Canada, and 10 stores in Mexico.
During 2016, Lowe’s acquired RONA inc. (RONA) which owns and operates 245 stores in Canada as of February 3, 2017, as well as services approximately 236 dealer-owned stores. The RONA stores represent various complementary store formats operating under various banners.
Lowe’s was incorporated in North Carolina in 1952 and has been publicly held since 1961. The Company’s common stock is listed on the New York Stock Exchange - ticker symbol “LOW”.
See Item 6, “Selected Financial Data”, of this Annual Report on Form 10-K (Annual Report), for historical revenues, profits and identifiable assets. For additional information about the Company’s performance and financial condition, see also Item 7, “Management’s Discussion and Analysis of Financial Condition and Results of Operations”, of this Annual Report.
Customers, Market and Competition
Our Customers
We serve homeowners, renters, and professional customers (Pro customers). Retail customers, comprised of individual homeowners and renters, complete a wide array of projects and vary along the spectrum of do-it-yourself (DIY) and do-it-for-me (DIFM). The Pro customer consists of two broad categories: construction trades; and maintenance, repair & operations.
Our Market
The U.S. market remains our predominant market, accounting for approximately 94% of consolidated sales as of February 3, 2017. We are among the many businesses, including home centers, paint stores, hardware stores, lumber yards and garden centers, whose revenues are included in the Building Material and Garden Equipment and Supplies Dealers Subsector (444) of the Retail Trade Sector of the North American Industry Classification System (NAICS), the standard used by Federal statistical agencies in classifying business establishments for the purpose of collecting, analyzing, and publishing statistical data related to the U.S. business economy. The total annual revenue reported for businesses included in NAICS 444 in 2016 was $352.3 billion, which represented an increase of 5.9% over the amount reported for the same category in 2015. The total annual revenue reported for businesses included in NAICS 444 in 2015 was $332.6 billion, which represented an increase of 4.7% over the amount reported for the same category in 2014. These figures are subject to periodic revision by the U.S. Department of Commerce.
NAICS 444 represents less than half of what we consider the total U.S. market for our products and services. The broader market in which Lowe’s operates includes home-related sales through a variety of companies beyond those in NAICS 444. These consist of other companies in the retail sector, including mass retailers, home furnishings stores, and online retailers, as well as wholesalers that provide home-related products and services to homeowners, businesses, and the government. Based on our analysis of the most recent comprehensive data available, we estimate the size of the U.S. home improvement market at $775 billion in 2016, comprised of $578 billion of product sales and $197 billion of installed labor sales. That compares with $730 billion total market sales in 2015, comprised of $543 billion of product sales and $187 billion of installed labor sales. These figures are subject to periodic revision by the U.S. Department of Commerce and other third-party sources.
There are many variables that affect consumer demand for the home improvement products and services Lowe’s offers. Key indicators we monitor include real disposable personal income, employment, home prices, and housing turnover. We also monitor demographic and societal trends that shape home improvement industry growth.
4
Table of Contents
|
|
|
| • | Growth in real disposable personal income is projected to moderate to 2.3% in 2017 as compared with 2.8% growth in 2016, based on the March 2017 Blue Chip Economic Indicators ® . * |
|
|
|
| • | The average unemployment rate for 2017 is forecasted to decline to 4.6%, according to the March 2017 Blue Chip Economic Indicators, which would be an improvement from the 4.9% average rate in 2016. The unemployment rate should continue to trend lower as the job market continues to expand at a moderate pace. |
|
|
|
| • | Recent evidence suggests that home prices will continue to increase. In 2016, home prices increased an estimated 5.4% similar to the 5.5% increase in 2015, according to the latest Federal Housing Finance Agency index. Economists generally expect the rate of home price growth to moderate in 2017. |
|
|
|
| • | Housing turnover increased an estimated 5.1% in 2016 after a 7.3% increase in 2015, according to The National Association of Realtors and U.S. Census Bureau. Turnover is generally expected to continue to moderately increase in 2017, supported by persisting growth in the job market, rising incomes, and historically low mortgage rates. |
These indicators are important to our business because they signal a customer’s willingness to engage in home maintenance, repair, and upgrade projects and favorably impact income available to purchase our products and services. Overall, the outlook for the home improvement industry remains positive for 2017, supported by continuing gains in jobs and incomes, home buying, and home price appreciation.
*Blue Chip Economic Indicators® (ISSN: 0193-4600) is published monthly by Aspen Publishers, 76 Ninth Avenue, New York, NY 10011, a division of Wolters Kluwer Law and Business. Printed in the U.S.A.
Our Competition
The home improvement industry includes a broad competitive landscape. We compete with other national and international home improvement warehouse chains and lumberyards in most of our trade areas. We also compete with traditional hardware, plumbing, electrical, home supply retailers, and maintenance and repair organizations. In addition, we compete with general merchandise retailers, warehouse clubs, and online and other specialty retailers as well as service providers that install home improvement products. Location of stores continues to be a key competitive factor in our industry; however, the increasing use of technology and the simplicity of online shopping also underscore the importance of omni-channel capabilities as a competitive factor. We differentiate ourselves from our competitors by providing better customer experiences while delivering superior value in products and service. See further discussion of competition in Item 1A, “Risk Factors”, of this Annual Report.
Products and Services
Our Products
Product Selection
To meet customers’ varying home improvement needs, we offer a complete line of products for maintenance, repair, remodeling, and decorating. We offer home improvement products in the following categories: Lumber & Building Materials; Tools & Hardware; Appliances; Fashion Fixtures; Rough Plumbing & Electrical; Seasonal Living; Lawn & Garden; Paint; Millwork; Flooring; Kitchens; Outdoor Power Equipment; and Home Fashions. A typical Lowe’s-branded home improvement store stocks approximately 37,000 items, with hundreds of thousands of additional items available through our Special Order Sales system and various online selling channels. See Note 17 of the Notes to Consolidated Financial Statements included in Item 8, “Financial Statements and Supplementary Data”, of this Annual Report for historical revenues by product category for each of the last three fiscal years.
We are committed to offering a wide selection of national brand-name merchandise complemented by our selection of private brands. In addition, we are dedicated to ensuring the products we sell are sourced in a socially responsible, efficient, and cost effective manner.
National Brand-Name Merchandise
In many product categories, customers look for a familiar and trusted national brand to instill confidence in their purchase. Lowe’s home improvement stores carry a wide selection of national brand-name merchandise such as Whirlpool ® , GE ® , LG ® , and Samsung ® appliances, Stainmaster ® carpets, Valspar ® paints and stains, Pella ® windows and doors, Sylvania ® light bulbs, Dewalt ® power tools, Hitachi ® pneumatic tools, Owens Corning ® insulation and roofing, GAF ® roofing, James Hardie ® fiber cement siding, Husqvarna ® outdoor power equipment, Werner ® ladders, and many more. In 2016, we added
5
Table of Contents
brand name merchandise such as Pergo® hardwood flooring, Quoizel® lighting, Marshalltown® masonry tools, and a suite of Nest ® products to our portfolio. Our merchandise selection provides the retail and Pro customer a one-stop shop for a wide variety of national brand-name merchandise needed to complete home improvement, repair, maintenance, or construction projects.
Private Brands
Private brands are an important element of our overall portfolio, helping to provide significant value and coordinated style across core categories. We sell private brands in several of our product categories. Some of Lowe’s most important private brands include Kobalt ® tools, allen+roth ® home décor products, Blue Hawk ® home improvement products, Project Source ® basic value products, Portfolio ® lighting products, Garden Treasures ® lawn and patio products, Utilitech ® electrical and utility products, Reliabilt ® doors and windows, Aquasource ® faucets, sinks and toilets, Harbor Breeze ® ceiling fans, Top Choice ® lumber products and Iris ® home automation and management products.
Supply Chain
We source our products from vendors worldwide and believe that alternative and competitive suppliers are available for virtually all of our products. Whenever possible, we purchase directly from manufacturers to provide savings for customers and improve our gross margin.
To efficiently move product from our vendors to our stores and maintain in-stock levels, we own and operate distribution facilities that enable products to be received from vendors, stored and picked, or cross-docked, and then shipped to our retail locations or directly to customers. These facilities include 15 highly-automated Regional Distribution Centers (RDC) in the United States. On average, each domestic RDC serves approximately 118 stores. We also own and operate ten distribution centers, including four lumber yards, to serve our Canadian market, and we lease and operate a distribution facility to serve our Orchard stores. Additionally, we have a service agreement with a third party logistics provider to manage a distribution facility to serve our stores in Mexico.
In addition to the RDCs, we also operate coastal holding facilities, transload facilities, appliance distribution centers, and flatbed distribution centers. The flatbed distribution centers distribute merchandise that requires special handling due to size or type of packaging such as lumber, boards, panel products, pipe, siding, ladders, and building materials. Collectively, our facilities enable our import and e-commerce, as well as parcel post eligible products, to get to their destination as efficiently as possible. Most parcel post items can be ordered by a customer and delivered within two business days at standard shipping rates.
In fiscal 2016, on average, approximately 80% of the total dollar amount of stock merchandise we purchased was shipped through our distribution network, while the remaining portion was shipped directly to our stores from vendors.
Our Services
Installed Sales
We offer installation services through independent contractors in many of our product categories, with Appliances, Flooring, Kitchens, Lumber & Building Materials, and Millwork accounting for the majority of installed sales. Our Installed Sales model, which separates selling and project administration tasks, allows our sales associates to focus on project selling, while project managers ensure that the details related to installing the products are efficiently executed. Installed Sales, which includes both product and labor, accounted for approximately 7% of total sales in fiscal 2016.
Extended Protection Plans and Repair Services
We offer extended protection plans in Kitchens, Appliances, Tools & Hardware, Outdoor Power Equipment, Seasonal Living, Rough Plumbing Electrical Fixtures, and Garage Door Openers. These protection plans provide customers with product protection that enhances or extends coverage previously offered by the manufacturer’s warranty. The protection plans provide in-warranty and out-of-warranty repair services for major appliances, outdoor power equipment, tools, grills, fireplaces, air conditioners, water heaters, and other eligible products through our stores or in the home through the Lowe’s Authorized Service Repair Network. We offer replacement plans for products in most of these categories when priced below $300, or otherwise specified category specific price points. Our contact center takes customers’ calls, assesses the problems, and facilitates resolutions, making after-sales service easier for our customers because we manage the entire process.
Selling Channels
We are continuing our progress towards becoming an omni-channel retail company, which allows our customers to move from channel to channel with simple and seamless transitions even within the same transaction. For example, for many projects,
6
Table of Contents
more than half of our customers conduct research online before making an in-store purchase. For purchases made on Lowes.com, approximately 60% are picked up in-store, 10% are delivered from a store, and 30% are parcel shipped. For the 60% picked up in-store, 40% of those customers elect to purchase additional products when they arrive in our stores. Regardless of the channels through which customers choose to engage with us, we strive to provide them with a seamless experience across channels and an endless aisle of products, enabled by our flexible fulfillment capabilities. Our ability to sell products in-store, online, on-site, or through our contact centers speaks to our ability to leverage our existing infrastructure with the omni-channel capabilities we continue to introduce.
In-Store
Our 1,797 Lowe’s-branded home improvement stores, inclusive of 1,733 in the U.S., 54 in Canada and 10 in Mexico, are generally open seven days per week and average approximately 112,000 square feet of retail selling space, plus approximately 32,000 square feet of outdoor garden center selling space. The 245 stores acquired in the RONA acquisition operate under various complementary store formats that address target customers and occasions. In addition, we operate 87 Orchard hardware stores located throughout California, Oregon, and Florida that also serve home improvement customers and average approximately 36,000 square feet of retail selling space. Our home improvement stores in the U.S. and Canada offer similar products and services, with certain variations based on local market factors; however, Orchard stores are primarily focused on paint, repair, and backyard products. We continue to develop and implement tools to make our sales associates more efficient and to integrate our order management and fulfillment processes. Our home improvement stores have Wi-Fi capabilities that provide customers with internet access, making information available quickly to further simplify the shopping experience.
Online
Through our websites and mobile applications, we seek to empower consumers by providing a 24/7 shopping experience, online product information, customer ratings and reviews, online buying guides and how-to videos and other information. These tools help consumers make more informed purchasing decisions and give them increased confidence to undertake home improvement projects. In 2016, sales through our online selling channels accounted for approximately 3.5% of our total sales. We enable customers to choose from a variety of fulfillment options, including buying online and picking up in-store as well as delivery or parcel shipment to their homes.
In addition, our LowesForPros.com online tool allows for easy online ordering for our Pro customers, and their choice of in-store pick-up or delivery, saving them time and money.
On-Site
We have on-site specialists available for retail and Pro customers to assist them in selecting products and services for their projects. Our Account Executives ProServices meet with Pro customers at their place of business or on a job site and leverage stores within the area to ensure we meet customer needs for products and resources. Our Project Specialist Exteriors (PSE) program is available in all U.S. Lowe’s home improvement stores to discuss exterior projects such as roofing, siding, fencing, and windows, whose characteristics lend themselves to an in-home consultative sales approach. In addition, our Project Specialist Interiors (PSI) program is also now available in all U.S. Lowe’s home improvement stores to provide similar consultative services on interior projects such as kitchens and bathrooms.
Contact Centers
Lowe’s operates three contact centers which are located in Wilkesboro, NC, Albuquerque, NM, and Indianapolis, IN. These contact centers help Lowe’s enable an omni-channel customer experience by providing the ability to tender sales, coordinate deliveries, manage after-sale installations, facilitate repair services for Appliances and Outdoor Power Equipment, and answer general customer questions via phone, mail, e-mail, live chat, and social media.
Employees
As of February 3, 2017, we employed approximately 190,000 full-time and 100,000 part-time employees. Our employees in Mexico, and certain employees in Canada, are subject to collective bargaining agreements. No other employees are subject to collective bargaining agreements. Management considers its relations with employees to be good.
Seasonality and Working Capital
The retail business in general is subject to seasonal influences, and our business is, to some extent, seasonal. Historically, we have realized the highest volume of sales during our second fiscal quarter (May, June and July) and the lowest volume of sales during our fourth fiscal quarter (November, December and January). Accordingly, our working capital requirements have historically been greater during our fourth fiscal quarter as we build inventory in anticipation of the spring selling season and as we experience lower fourth fiscal quarter sales volumes. We fund our working capital requirements primarily through cash
7
Table of Contents
flows generated from operations, but also with short-term borrowings, as needed. For more detailed information, see the Financial Condition, Liquidity and Capital Resources section in Item 7, “Management’s Discussion and Analysis of Financial Condition and Results of Operations”, of this Annual Report.
Intellectual Property
The name “Lowe’s” is a registered service mark of one of our wholly-owned subsidiaries. We consider this mark and the accompanying name recognition to be valuable to our business. This subsidiary and other wholly owned subsidiaries own and maintain various additional registered and unregistered trademarks, trade names and service marks, including but not limited to retail names “RONA”, “Reno Depot”, and “Orchard Supply Hardware”, online retail name “ATG Stores”, and private brand product names “Kobalt” and “allen+roth”. These subsidiaries also maintain various Internet domain names that are important to our business, and we also own registered and unregistered copyrights. In addition, we maintain patent portfolios related to some of our products and services and seek to patent or otherwise protect certain innovations that we incorporate into our products, services, or business operations.
Environmental Stewardship
Lowe’s knows that operating a business can impact the environment and our communities, and we continue to work to positively influence that impact. It is a responsibility we take seriously.
In 2016, we created a Sustainability & Product Stewardship Council, led by senior executives, to review significant strategies and policies regarding sustainability and product stewardship, and make recommendations across the organization. The company initiated work on a comprehensive sustainability strategy that creates business value and supports our purpose, and we expect to finalize that strategy during 2017.
Each year, Lowe’s participates in the Carbon Disclosure Project to track our carbon footprint. In 2016, Lowe’s externally verified its greenhouse gas emissions data collection and analysis to validate our findings and increase confidence in our reporting. In 2016, 32 retail locations upgraded to interior light-emitting diode (LED) lighting, and seven new stores opened with LED lighting already installed. We plan to continue to implement interior LED lighting and seek solutions for specific lighting needs to enhance energy efficiency as well as the customer experience.
In 2016, we expanded our test of a state-of-the-art building management system (BMS) to 100 stores. The BMS monitors equipment performance and provides valuable information that helps facility managers manage energy consumption to reduce costs and carbon emissions. Lowe’s conducted energy efficiency audits of heating, ventilation and air conditioning systems, and will be implementing upgrades to a number of systems in 2017.
Lowe’s is committed to promoting sustainable practices in the transportation industry. We collaborate with the Environmental Protection Agency’s SmartWay program to reduce transportation emissions by creating incentives for freight contractors to improve efficiency, and are proud to be one of only nine companies in 2016 to receive the Environmental Protection Agency SmartWay Excellence Award in the logistics and shipping category-the only retailer to achieve this honor eight years in a row.
Our recycling program continues to be a priority as we seek to reduce landfill waste and increase recycling at our stores and distribution centers. We operate in-store recycling centers at every Lowe’s store in the continental United States, encouraging customers to recycle compact fluorescent lamps, plastic bags, rechargeable batteries and cell phones. We offer haul-away service to customers who purchase replacement appliances, and our Garden Centers also accept plastic plant trays and pots for recycling.
Managing our water resources is essential in regions experiencing drought conditions. In 2016, we installed HydroPoint irrigation technology that combines real-time weather data with site-specific information to reduce water consumption and save on utility costs. The systems are in 200 locations and we expect to expand to 200 more in the coming year.
More than ever, customers expect products that are safe, socially and environmentally responsible, and also affordable. Lowe’s increasingly provides product choices that save energy and water, reduce potentially harmful chemicals, or mitigate safety concerns for their families. We also engage with our product suppliers, manufacturers and other external stakeholders to ensure we carry the most innovative new products.
For more information about Lowe’s environmental efforts, please visit Lowes.com/SocialResponsibility.
8
Table of Contents
Investing in Our Communities
Lowe’s has a long and proud history of supporting local communities through public education and community improvement projects, beginning with the creation of the Lowe’s Charitable and Educational Foundation in 1957. In 2016, Lowe’s and the Lowe’s Charitable and Educational Foundation donated approximately $38 million to schools and community organizations in the United States, Canada, and Mexico, including but not limited to the following discussed below.
Our commitment to improving educational opportunities is best exemplified by our signature education grant program, Lowe’s Toolbox for Education ® , and 2016 marked the program’s 11-year anniversary. In 2016, Lowe’s Toolbox for Education ® provided approximately $7 million in grants and since inception has provided funding improvements at nearly 12,000 schools, benefiting more than six million children.
Each year, we work with national nonprofit partners to strengthen and stabilize neighborhoods in the communities we serve. In 2016, Lowe’s contributed $7 million and teamed with Habitat for Humanity and Rebuilding Together to provide housing solutions in partnership with families across the country. We also continued to build on our longstanding partnerships with the Boys & Girls Clubs of America, SkillsUSA, The Nature Conservancy, and Keep America Beautiful to improve communities and build tomorrow’s leaders.
Lowe’s is also committed to helping residents of the communities we serve by being there when we’re needed most - when a natural disaster threatens and in the recovery that follows. In 2016, Lowe’s donated nearly $2.1 million and mobilized hundreds of Lowe’s Heroes employee volunteers to help families recover from disasters across the United States.
For the second year in a row, 100% of Lowe’s stores in the United States participated in a Lowe’s Heroes volunteer project.
For more information on Lowe’s partnerships and latest community improvement projects, visit Lowes.com/SocialResponsibility .
Available Information
Our Annual Report, quarterly reports on Form 10-Q, current reports on Form 8-K and amendments to those reports filed or furnished pursuant to Section 13(a) or 15(d) of the Securities Exchange Act of 1934, as amended, are made available free of charge through our internet website at www.Lowes.com/investor , as soon as reasonably practicable after such documents are electronically filed with, or furnished to, the Securities and Exchange Commission (SEC). The public may also read and copy any materials the Company files with the SEC at the SEC’s Public Reference Room at 100 F Street, NE, Washington, DC 20549. Information on the operation of the Public Reference Room may be obtained by calling the SEC at 1-800-SEC-0330. The SEC maintains an Internet site, www.sec.gov , that contains reports, proxy and information statements, and other information regarding issuers that file electronically with the SEC.
Item 1A - Risk Factors
We have developed a risk management process using periodic surveys, external research, planning processes, risk mapping, analytics and other tools to identify and evaluate the operational, financial, environmental, reputational, strategic and other risks that could adversely affect our business. For more information about our risk management framework, which is administered by our Chief Financial Officer and includes developing risk mitigation controls and procedures for the material risks we identify, see the description included in the definitive Proxy Statement for our 2017 annual meeting of shareholders (as defined in Item 10 of Part III of this Annual Report) under “Board’s Role in the Risk Management Process.”
We describe below certain risks that could adversely affect our results of operations, financial condition, business reputation or business prospects. These risk factors may change from time to time and may be amended, supplemented or superseded by updates to the risk factors contained in our future periodic reports on Form 10-K, Form 10-Q and reports on other forms we file with the Securities and Exchange Commission. All forward-looking statements about our future results of operations or other matters made by us in this Annual Report, in our Annual Report to Lowe’s Shareholders and in our subsequently filed reports to the Securities and Exchange Commission, as well as in our press releases and other public communications, are qualified by the risks described below.
You should read these risk factors in conjunction with “Management’s Discussion and Analysis of Financial Condition and Results of Operations” in Item 7 and our consolidated financial statements and related notes in Item 8. There also may be other factors that we cannot anticipate or that are not described in this Annual Report generally because we do not currently perceive them to be material. Those factors could cause results to differ materially from our expectations.
9
Table of Contents
We may be unable to adapt our business concept in a rapidly evolving retail environment to address the changing shopping habits, demands and demographics of our customers, or realize the intended benefits of organizational change initiatives.
The home improvement retail environment, like the retail environment generally, is rapidly evolving, and adapting our business concept to respond to our customers’ changing shopping habits and demands and their changing demographics is critical to our future success. Our success is dependent on our ability to identify and respond to the economic, social, style and other trends that affect demographic and consumer preferences in a variety of our merchandise categories and service offerings. Customers’ expectations about how they wish to research, purchase and receive products and services have also evolved. It is difficult to predict the mix of products and services that our customers will demand. Failure to identify such trends, adapt our business concept, and implement change, growth, and productivity initiatives successfully could negatively affect our relationship with our customers, the demand for the home improvement products and services we sell, the rate of growth of our business, our market share, and results of operations.
We may not be able to realize the benefits of our strategic initiatives focused on omni-channel sales and marketing presence if we fail to deliver the capabilities required to execute on them.
Our interactions with customers has evolved into an omni-channel experience as they increasingly are using computers, tablets, mobile phones and other devices to shop in our stores and online and provide feedback and public commentary about all aspects of our business. Omni-channel retail is quickly evolving, and we must anticipate and meet our customers’ expectations and counteract new developments and technology investments by our competitors. Our customer-facing technology systems must appeal to our customers, function as designed and provide a consistent customer experience. The success of our strategic initiatives to adapt our business concept to our customers’ changing shopping habits and demands and changing demographics will require us to deliver large, complex programs requiring more integrated planning, initiative prioritization and program sequencing. These initiatives will require new competencies in many positions, and our management, employees and contractors will have to adapt and learn new skills and capabilities. To the extent they are unable or unwilling to make these transformational changes, we may be unable to realize the full benefits of our strategic initiatives and expand our relevant market access. Our results of operations, financial condition or business prospects could also be adversely affected if we fail to provide a consistent experience for our customers, regardless of sales channel, if our technology systems do not meet our customers’ expectations, if we are unable to counteract new developments and innovations implemented by our competitors, or if we are unable to attract, retain, and manage the talent succession of additional personnel at various levels of the Company who have the skills and capabilities we need to implement our strategic initiatives and drive the changes that are essential to successfully adapting our business concept in the rapidly changing retail environment.
Our business and our reputation could be adversely affected by the failure to protect sensitive customer, employee, vendor or Company information or to comply with evolving regulations relating to our obligation to protect our systems, assets and such information from the threat of cyber-attacks.
Cyber-attacks and tactics designed to gain access to and exploit sensitive information by breaching mission critical systems of large organizations are constantly evolving, and high profile electronic security breaches leading to unauthorized release of sensitive customer information have occurred in recent years with increasing frequency at a number of major U.S. companies, including several large retailers, despite widespread recognition of the cyber-attack threat and improved data protection methods. As with many other retailers, we receive and store certain personal information about our customers, employees and vendors. Additionally, we use third-party service providers for services, such as authentication, content delivery, back-office support and other functions. Despite our continued vigilance and investment in information security, we or our third-party service providers may be unable to adequately anticipate or prevent a breach in our or their systems that results in the unauthorized release of sensitive data. Should this occur, it may have a material adverse effect on our reputation, drive customers away and lead to financial losses from remedial actions, or potential liability, including possible punitive damages. A security breach resulting in the unauthorized release of sensitive data from our or our third-party service providers’ information systems could also materially increase the costs we already incur to protect against such risks. In addition, as the regulatory environment relating to retailers and other companies’ obligation to protect such sensitive data becomes stricter, a material failure on our part to comply with applicable regulations could subject us to fines or other regulatory sanctions and potentially to lawsuits.
We are subject to payments-related risks that could increase our operating costs, expose us to fraud, subject us to potential liability and potentially disrupt our business.
We accept payments using a variety of methods, including credit cards, debit cards, credit accounts, our private label and co-branded credit cards, gift cards, direct debit from a customer’s bank account, consumer invoicing and physical bank checks, and we may offer different payment options over time. These payment options subject us to many compliance requirements, including, but not limited to, compliance with payment card association operating rules, including data security rules, certification requirements, rules governing electronic funds transfers and Payment Card Industry Data Security Standards. They also subject us to potential fraud by criminal elements seeking to discover and take advantage of security vulnerabilities
10
Table of Contents
that may exist in some of these payment systems. For certain payment methods, including credit and debit cards, we pay interchange and other fees, which may increase over time and raise our operating costs and lower profitability. We rely on third parties to provide payment processing services, including the processing of credit cards, debit cards, electronic checks, gift cards and promotional financing, and it could disrupt our business if these companies become unwilling or unable to provide these services to us. If we fail to comply with these rules or requirements, or if our data security systems are breached or compromised, we may be liable for card issuing banks’ costs, subject to fines and higher transaction fees, and lose our ability to accept credit and debit card payments from our customers, process electronic funds transfers, or facilitate other types of online payments, and our business and operating results could be adversely affected.
As customer-facing technology systems become an increasingly important part of our omni-channel sales and marketing strategy, the failure of those systems to perform effectively and reliably could keep us from delivering positive customer experiences.
Access to the Internet from computers, tablets, smart phones and other mobile communication devices has empowered our customers and changed the way they shop and how we interact with them. Our websites, including Lowes.com and Lowesforpros.com, are a sales channel for our products, and are also a method of making product, project and other relevant information available to our customers that impacts our in-store sales. Additionally, we have multiple affiliated websites and mobile apps through which we seek to inspire, inform, cross-sell, establish online communities among and otherwise interact with our customers. Performance issues with these customer-facing technology systems, including temporary outages caused by distributed denial of service, ransomware or other cyber-attacks, or a complete failure of one or more of them without a disaster recovery plan that can be quickly implemented, could quickly destroy the positive benefits they provide to our home improvement business and negatively affect our customers’ perceptions of Lowe’s as a reliable online vendor and source of information about home improvement products and services.
If we fail to hire, train, manage and retain qualified sales associates and specialists with expanded skill sets or corporate support staff with the capabilities of delivering on strategic objectives, we could lose sales to our competitors and our labor costs, resulting from operations or the execution of corporate strategies, could be negatively affected.
Our customers, whether they are homeowners, renters or commercial businesses, expect our sales associates and specialists to be well trained and knowledgeable about the products we sell and the home improvement services we provide. We compete with other retailers for many of our sales associates and specialists, and we invest significantly in them with respect to training and development to strive for high engagement. Increasingly, our sales associates and specialists must have expanded skill sets, including, in some instances, the ability to do in-home or telephone sales. A critical challenge we face is attracting and retaining a sufficiently diverse workforce that can deliver relevant, culturally competent and differentiated experiences for a wide variety of culturally diverse customers. In fact, in many of our stores, our employees must be able to serve customers whose primary language and cultural traditions are different from their own. Additionally, in order to deliver on the omni-channel expectations of our customers, we rely on the specialized training and capabilities of corporate support staff which are broadly sought after by our competitors. If we are unable to hire, train, manage and retain qualified sales associates and specialists, the quality of service we provide to our customers may decrease and our results of operations could be negatively affected. Furthermore, our ability to meet our labor needs while controlling our costs is subject to a variety of external factors, including wage rates, the availability of and competition for talent, health care and other benefit costs, our brand image and reputation, changing demographics, and adoption of new or revised employment and labor laws and regulations. Periodically, we are subject to labor organizing efforts, and if we become subject to collective bargaining agreements in the future, it could adversely affect how we operate our business and adversely affect our labor costs and our ability to retain a qualified workforce.
Positively and effectively managing our public image and reputation is critical to our business success, and, if our public image and reputation are damaged, it could negatively impact our relationships with our customers, vendors and store associates and specialists and, consequently, our business and results of operations.
Our public image and reputation are critical to ensuring that our customers shop at Lowe’s, our vendors want to do business with Lowe’s and our sales associates and specialists want to work for Lowe’s. We must continue to manage, preserve and grow Lowe’s public image and reputation. Any negative incident can erode trust and confidence quickly, and adverse publicity about us could damage our reputation and brand image, undermine our customers’ confidence, reduce demand for our products and services, affect our relationships with current and future vendors, impact our results of operations and affect our ability to retain and recruit store associates and specialists. The significant expansion in the use of social media over recent years has compounded the potential scope of the negative publicity that could be generated by such negative incidents.
Strategic transactions, such as our acquisition of RONA, involve risks, and we may not realize the expected benefits because of numerous uncertainties and risks.
We regularly consider and enter into strategic transactions, including mergers, acquisitions, joint ventures, investments and other growth, market and geographic expansion strategies, with the expectation that these transactions will result in increases in
11
Table of Contents
sales, cost savings, synergies and other various benefits. Our ability to deliver the expected benefits from any strategic transaction is subject to numerous uncertainties and risks, including our ability to integrate personnel, labor models, financial, IT and other systems successfully; disruption of our ongoing business and distraction of management; hiring additional management and other critical personnel; and increasing the scope, geographic diversity and complexity of our operations. Effective internal controls are necessary to provide reliable and accurate financial reports, and the integration of businesses may create complexity in our financial systems and internal controls and make them more difficult to manage. Integration of businesses into our internal control system could cause us to fail to meet our financial reporting obligations. Additionally, any impairment of goodwill or other assets acquired or divested in a strategic transaction or charges to earnings associated with any strategic transaction, may materially reduce our earnings. Our shareholders may react unfavorably to our strategic transactions, and, if we do not realize any anticipated benefits from such transactions, we may be exposed to additional liabilities of any acquired business or joint venture and we may be exposed to litigation in connection with the strategic transaction. Further, we may finance these strategic transactions by incurring additional debt, which could increase leverage or impact our ability to access capital in the future.
Failure to achieve and maintain a high level of product and service quality could damage our image with customers and negatively impact our sales, profitability, cash flows and financial condition.
Product and service quality issues could result in a negative impact on customer confidence in Lowe’s and our brand image. If our product and service offerings do not meet applicable safety standards or our customers’ expectations regarding safety or quality, we could experience lost sales and increased costs and be exposed to legal, financial and reputational risks. Actual, potential or perceived product safety concerns could expose us to litigation, as well as government enforcement action, and result in costly product recalls and other liabilities. As a result, Lowe’s reputation as a retailer of high quality products and services, including both national and Lowe’s private brands, could suffer and impact customer loyalty.
We have many competitors who could take sales and market share from us if we fail to execute our merchandising, marketing and distribution strategies effectively, or if they develop a substantially more effective or lower cost means of meeting customer needs, resulting in a negative impact on our business and results of operations.
We operate in a highly competitive market for home improvement products and services and have numerous large and small, direct and indirect competitors. The principal competitive factors in our industry include convenience, customer service, quality and price of merchandise and services, in-stock levels, and merchandise assortment and presentation. We face growing competition from online and multi-channel retailers who have a similar product or service offering. Customers are increasingly able to quickly comparison shop and determine real-time product availability and price using digital tools. Our failure to respond effectively to competitive pressures and changes in the markets for home improvement products and services could affect our financial performance. Moreover, changes in the promotional pricing and other practices of our competitors, including the effects of competitor liquidation activities, may impact our results.
Our inability to effectively and efficiently manage and maintain our relationships with selected suppliers of brand name products could negatively impact our business operations and financial results.
We form strategic relationships with selected suppliers to market and develop products under a variety of recognized and respected national and international brand names. We also have relationships with certain suppliers to enable us to sell proprietary products which differentiate us from other retailers. The inability to effectively and efficiently manage and maintain our relationships with these suppliers could negatively impact our business operations and financial results.
Failure of a key vendor or service provider that we cannot quickly replace could disrupt our operations and negatively impact our business, financial condition and results of operations.
We rely upon a number of vendors as the sole or primary source of some of the products we sell. We also rely upon many independent service providers for technology solutions and other services that are important to many aspects of our business. Many of these vendors and service providers have certain products or specialized skills needed to support our business concept and our strategies. If these vendors or service providers discontinue operations or are unable to perform as expected or if we fail to manage them properly and we are unable to replace them quickly, our business could be adversely affected, at least temporarily, until we are able to replace them and potentially, in some cases, permanently.
If our domestic or international supply chain or our fulfillment network for our products is ineffective or disrupted for any reason, or if these operations are subject to trade policy changes, our results of operations could be adversely affected.
We source, stock and sell products from domestic and international vendors and their ability to reliably and efficiently fulfill our orders is critical to our business success. We source a large number of our products from foreign manufacturers with China continuing to be the dominant import source. The results of the November 2016 U.S. elections may signal a change in trade policy between the United States and other countries. Because we source a large percentage of our merchandise from outside the United States, major changes in tax policy or trade relations, such as the disallowance of tax deductions for imported
12
Table of Contents
merchandise or the imposition of additional tariffs or duties on imported products, could adversely affect our business, results of operations, effective income tax rate, liquidity and net income.
Financial instability among key vendors, political instability and labor unrest in source countries or elsewhere in our supply chain, changes in the costs of commodities in our supply chain (fuel, labor and currency exchange rates), port labor disputes and security, the outbreak of pandemics, weather-related events, natural disasters, work stoppages, shipping capacity restrains, changes in trade policy, retaliatory trade restrictions imposed by either the United States or a major source country, tariffs or duties, fluctuations in currency exchange rates and transport availability, capacity and costs are beyond our control and could negatively impact our business if they seriously disrupted the movement of products through our supply chain or increased their costs. Additionally, as we add fulfillment capabilities or pursue strategies with different fulfillment requirements, our fulfillment network becomes increasingly complex and operating it becomes more challenging. If our fulfillment network does not operate properly or if a vendor fails to deliver on its commitments, we could experience delays in inventory, increased delivery costs or merchandise out-of-stocks that could lead to lost sales and decreased customer confidence, and adversely affect our results of operations.
Failure to effectively manage our third-party installers could result in increased operational and legal risks and negatively impact our business, financial condition and results of operations.
We use third-party installers to provide installation services to our customers, and, as the general contractor, we are subject to regulatory requirements and risks, applicable to general contractors, including the management of the permitting, licensing and quality of our third-party installers. Our failure to effectively manage such requirements, the third-party installers, and our internal processes regarding installation services could result in lost sales, fines and lawsuits, as well as damage to our reputation, which could negatively affect our business.
Operating internationally presents unique challenges, including some that have required us to adapt our store operations, merchandising, marketing and distribution functions to serve customers in Canada and Mexico. Our business and results of operations could be negatively affected if we are unable to effectively address these challenges.
We expect continued store growth over the next five years in Canada and Mexico. Expanding internationally presents unique challenges that may increase the anticipated costs and risks, and slow the anticipated rate, of such expansion. Our future operating results in these countries or in other countries or regions in which we currently operate or may operate in the future could be negatively affected by a variety of factors, including unfavorable political or economic factors, adverse tax consequences, volatility in foreign currency exchange rates, increased difficulty in enforcing intellectual property rights, costs and difficulties of managing international operations, challenges with identifying and contracting with local suppliers and other risks created as a result of differences in culture, laws and regulations. These factors could restrict our ability to operate our international businesses profitably and therefore have a negative impact on our results of operations and financial position. In addition, our reported results of operations and financial position could also be negatively affected by exchange rates when the activities and balances of our foreign operations are translated into U.S. dollars for financial reporting purposes.
We must comply with various and multiple laws and regulations that differ substantially in each area where we operate. Changes in existing or new laws and regulations or regulatory enforcement priorities, or our inability to comply with such laws and regulations, could adversely affect our business, financial condition and results of operations.
Laws and regulations at the local, regional, state, federal and international levels change frequently, and the changes can impose significant costs and other burdens of compliance on our business and our vendors. If we fail to comply with these laws, rules and regulations, or the manner in which they are interpreted or applied, we may be subject to government enforcement action, litigation, damage to our reputation, civil and criminal liability, damages, fines and penalties, and increased cost of regulatory compliance, any of which could adversely affect our results of operations and financial performance. These laws, rules and regulations include, but are not limited to, import and export requirements, U.S. laws such as the Foreign Corrupt Practices Act, and local laws prohibiting corrupt payments to governmental officials. Although we have implemented policies and procedures to help ensure compliance with these laws, rules and regulations, there can be no certainty that our employees and third parties with whom we do business will not take actions in violation of our policies or laws. Many of these laws, rules and regulations are complex, evolving and are subject to varying interpretations and enforcement actions. Any changes in regulations, the imposition of additional regulations, or the enactment of any new legislation could have an adverse impact, directly or indirectly, on our financial condition and results of operations. We may also be subject to investigations or audits by governmental authorities and regulatory agencies as a result of enforcing existing laws and regulations or changes in enforcement priorities, which can occur in the ordinary course of business or which can result from increased scrutiny from a particular agency towards an industry, country or practice.
13
Table of Contents
Future litigation or governmental proceedings could result in material adverse consequences, including judgments or settlements, negatively affecting our business, financial condition and results of operations.
We are, and in the future will become, involved in lawsuits, regulatory inquiries, and governmental and other legal proceedings arising out of the ordinary course of our business. Some of these proceedings may raise difficult and complicated factual and legal issues and can be subject to uncertainties and complexities. The timing of the final resolutions to lawsuits, regulatory inquiries, and governmental and other legal proceedings is typically uncertain. Additionally, the possible outcomes of, or resolutions to, these proceedings could include adverse judgments or settlements, either of which could require substantial payments. Furthermore, defending against these proceedings may require a diversion of management’s attention and resources. None of the legal proceedings in which we are currently involved, individually or collectively, is considered material.
Our financial performance could be adversely affected if our management information systems are seriously disrupted or we fail to properly maintain, improve, upgrade and expand those systems.
An important part of our efforts to provide an omni-channel experience for our customers, include investing in, maintaining and making ongoing improvements of our existing management information systems that support operations, such as sales, inventory replenishment, merchandise ordering, project design and execution, transportation, receipt processing and fulfillment. Our systems are subject to damage or interruption as a result of catastrophic events, power outages, viruses, malicious attacks, telecommunications failures, and we may incur significant expense, data loss as well as an erosion of customer confidence. Additionally, we continually make investments in our systems which may introduce disruption. Our financial performance could be adversely affected if our management information systems are seriously disrupted or we fail to properly maintain, improve, upgrade and expand those systems.
Liquidity and access to capital rely on efficient, rational and open capital markets and are dependent on Lowe’s credit strength. Our inability to access capital markets could negatively affect our business, financial performance and results of operations.
We have relied on the public debt markets to fund portions of our capital investments and the commercial paper market and bank credit facilities to fund our working capital needs. Our access to these markets depends on our strong credit ratings, the overall condition of debt capital markets and our operating performance. Disruption in the financial markets or an erosion of our credit strength or declines on our credit rating could impact negatively our ability to meet capital requirements or fund working capital needs.
Our sales are dependent upon the health and stability of the general economy. Adverse changes in economic factors specific to the home improvement industry may negatively impact the rate of growth of our total sales and comparable sales.
Many U.S. and global economic factors may adversely affect our financial performance. These include, but are not limited to, periods of slow economic growth or recession, decreasing housing turnover or home price appreciation, volatility and/or lack of liquidity from time to time in U.S. and world financial markets and the consequent reduced availability and/or higher cost of borrowing to Lowe’s and its customers, slower rates of growth in real disposable personal income that could affect the rate of growth in consumer spending, high rates of unemployment, consumer debt levels, fluctuations in fuel and energy costs, inflation or deflation of commodity prices, natural disasters, and acts of both domestic and international terrorism. Sales of many of our product categories and services are driven by the activity level of home improvement projects. Adverse development in these factors could result in a decrease in home improvement activity which could reduce demand for our products and services.
Item 1B - Unresolved Staff Comments
None.
Item 2 - Properties
At February 3, 2017, our properties consisted of 2,129 stores in the U.S., Canada, and Mexico with a total of approximately 213 million square feet of selling space. Of the total stores operating at February 3, 2017, approximately 79% are owned, which includes stores on leased land, with the remainder being leased from third parties. We also operate regional distribution centers and other facilities to support distribution and fulfillment, as well as data centers and various support offices. Our executive offices are located in Mooresville, North Carolina.
Item 3 - Legal Proceedings
We are, from time to time, party to various legal proceedings considered to be in the normal course of business, none of which are considered material. We do not believe that any of these proceedings, individually or in the aggregate, would be expected to have a material adverse effect on our results of operations, financial position, or cash flows.
14
Table of Contents
Item 4 - Mine Safety Disclosures
Not applicable.
15
Table of Contents
EXECUTIVE OFFICERS AND CERTAIN SIGNIFICANT EMPLOYEES OF THE REGISTRANT
Set forth below is a list of names and ages of the executive officers and certain significant employees of the registrant indicating all positions and offices with the registrant held by each such person and each person’s principal occupations or employment during the past five years. Each executive officer of the registrant is elected by the board of directors. Each executive officer of the registrant holds office from the date of election until a successor is elected or until his or her death, resignation or removal.
|
| ||||
|
|
|
|
|
|
| Name |
| Age |
| Title |
| Robert A. Niblock |
| 54 |
| Chairman of the Board, President and Chief Executive Officer since 2011. |
|
|
|
|
|
|
| Marshall A. Croom |
| 56 |
| Chief Financial Officer since March 2017; Chief Risk Officer, 2012 – March 2017; Senior Vice President and Chief Risk Officer, 2009 – 2012. |
|
|
|
|
|
|
| Rick D. Damron |
| 54 |
| Chief Operating Officer since 2012; Executive Vice President, Store Operations, 2011 – 2012. |
|
|
|
|
|
|
| Matthew V. Hollifield |
| 50 |
| Senior Vice President and Chief Accounting Officer since 2005. |
|
|
|
|
|
|
| Richard D. Maltsbarger |
| 41 |
| Chief Development Officer and President of International since 2015; Chief Development Officer, 2014 – 2015; Business Development Executive, 2012 – 2014; Senior Vice President, Strategy, 2011 – 2012. |
|
|
|
|
|
|
| Ross W. McCanless |
| 59 |
| Chief Legal Officer, Secretary and Chief Compliance Officer since 2016; General Counsel, Secretary and Chief Compliance Officer, 2015 – 2016; Chief Legal Officer, Extended Stay America, Inc. and ESH Hospitality, Inc., 2013 – 2014; Chief Legal Officer, HVM, L.L.C., 2012 – 2013. |
|
|
|
|
|
|
| Michael P. McDermott |
| 47 |
| Chief Customer Officer since 2016; Chief Merchandising Officer, 2014 – 2016; Senior Vice President and General Merchandising Manager – Building and Maintenance, 2013 – 2014; Sales Leader – Appliances, General Electric Company, 2011 – 2013. |
|
|
|
|
|
|
| N. Brian Peace |
| 51 |
| Corporate Administration Executive since 2012; Senior Vice President, Corporate Affairs, 2006 – 2012. |
|
|
|
|
|
|
| Paul D. Ramsay |
| 52 |
| Chief Information Officer since 2014; Senior Vice President, Information Technology, 2011 – 2014. |
|
|
|
|
|
|
| Jennifer L. Weber |
| 50 |
| Chief Human Resources Officer since 2016; Executive Vice President, External Affairs and Strategic Policy, Duke Energy Corporation, 2014 – 2016; Executive Vice President and Chief Human Resources Officer, Duke Energy Corporation, 2011 – 2014. |
16
Table of Contents
Part II
Item 5 - Market for Registrant’s Common Equity, Related Stockholder Matters and Issuer Purchases of Equity Securities
Lowe’s common stock is traded on the New York Stock Exchange (NYSE). The ticker symbol for Lowe’s is “LOW”. As of March 31, 2017, there were 23,575 holders of record of Lowe’s common stock. The following table sets forth, for the periods indicated, the high and low sales prices per share of the common stock as reported by the NYSE Composite Tape and the dividends per share declared on the common stock during such periods.
|
| |||||||||||||||||||||||||||||||||||||||||||||||||||
|
|
|
|
|
|
|
|
|
|
|
|
|
|
|
|
|
|
|
|
|
|
|
|
| ||||||||||||||||||||||||||||
|
| Fiscal 2016 |
| Fiscal 2015 | ||||||||||||||||||||||||||||||||||||||||||||||||
|
| High |
| Low |
| Dividend |
| High |
| Low |
| Dividend | ||||||||||||||||||||||||||||||||||||||||
| 1st Quarter | $ | 77.63 |
|
| $ | 62.62 |
|
| $ | 0.28 |
|
| $ | 76.25 |
|
| $ | 66.17 |
|
| $ | 0.23 |
| ||||||||||||||||||||||||||||
| 2nd Quarter | 83.65 |
|
| 74.56 |
|
| 0.35 |
|
| 73.93 |
|
| 65.83 |
|
| 0.28 |
| ||||||||||||||||||||||||||||||||||
| 3rd Quarter | 82.68 |
|
| 66.71 |
|
| 0.35 |
|
| 74.78 |
|
| 64.22 |
|
| 0.28 |
| ||||||||||||||||||||||||||||||||||
| 4th Quarter | 76.47 |
|
| 64.87 |
|
| 0.35 |
|
| 78.13 |
|
| 66.93 |
|
| 0.28 |
| ||||||||||||||||||||||||||||||||||
Total Return to Shareholders
The following information in Item 5 of this Annual Report is not deemed to be “soliciting material” or to be “filed” with the SEC or subject to Regulation 14A or 14C under the Securities Exchange Act of 1934 or to the liabilities of Section 18 of the Securities Exchange Act of 1934, and will not be deemed to be incorporated by reference into any filing under the Securities Act of 1933 or the Securities Exchange Act of 1934, except to the extent we specifically incorporate it by reference into such a filing.
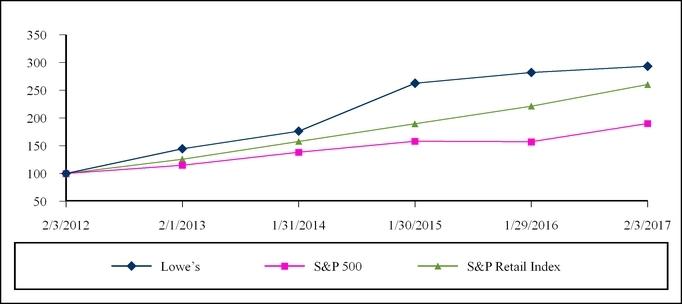
The following table and graph compare the total returns (assuming reinvestment of dividends) of the Company’s common stock, the S&P 500 Index (S&P 500) and the S&P Retailing Industry Group Index (S&P Retail Index). The graph assumes $100 invested on February 3, 2012 in the Company’s common stock and each of the indices.
|
| |||||||||||||||||||||||||||||||||||||||
|
|
|
|
|
|
|
|
|
|
|
|
|
|
|
|
|
|
|
|
|
|
|
|
| ||||||||||||||||
|
| 2/3/2012 |
|
| 2/1/2013 |
|
| 1/31/2014 |
|
| 1/30/2015 |
|
| 1/29/2016 |
|
| 2/3/2017 |
| ||||||||||||||||||||||
| Lowe’s | $ | 100.00 |
|
| $ | 144.61 |
|
| $ | 176.36 |
|
| $ | 262.41 |
|
| $ | 281.77 |
|
| $ | 293.31 |
| ||||||||||||||||
| S&P 500 | 100.00 |
|
| 115.06 |
|
| 138.42 |
|
| 158.11 |
|
| 157.06 |
|
| 190.14 |
| ||||||||||||||||||||||
| S&P Retail Index | $ | 100.00 |
|
| $ | 125.89 |
|
| $ | 157.75 |
|
| $ | 189.45 |
|
| $ | 221.27 |
|
| $ | 260.15 |
| ||||||||||||||||
17
Table of Contents
Issuer Purchases of Equity Securities
The following table sets forth information with respect to purchases of the Company’s common stock made during the fourth quarter of fiscal 2016:
|
| ||||||||||||||
|
|
|
|
|
|
|
|
|
|
|
|
|
|
| |
| (In millions, except average price paid per share) | Total Number of Shares Purchased 1 |
|
| Average Price Paid per Share |
|
| Total Number of Shares Purchased as Part of Publicly Announced Plans or Programs 2 |
|
| Dollar Value of Shares that May Yet Be Purchased Under the Plans or Programs 2 |
| |||
| October 29, 2016 – November 25, 2016 3 | 3.4 |
|
| $ | 70.95 |
|
| 3.4 |
|
| $ | 367 |
| |
| November 26, 2016 – December 30, 2016 | 2.1 |
|
| 72.97 |
|
| 2.1 |
|
| 215 |
| |||
| December 31, 2016 – February 3, 2017 3 | 2.2 |
|
| 72.09 |
|
| 2.2 |
|
| 5,076 |
| |||
| As of February 3, 2017 | 7.7 |
|
| $ | 71.83 |
|
| 7.7 |
|
| $ | 5,076 |
| |
|
|
| |||||||||||||
| 1 | During the fourth quarter of fiscal 2016, the Company repurchased an aggregate of 7.7 million shares of its common stock. The total number of shares purchased also includes an insignificant number of shares withheld from employees to satisfy either the exercise price of stock options or the statutory withholding tax liability upon the vesting of restricted stock awards. | |||||||||||||
|
|
| |||||||||||||
| 2 | On March 20, 2015, the Company announced that its Board of Directors authorized a $5.0 billion repurchase program with no expiration. On January 27, 2017, the Company announced that its Board of Directors authorized an additional $5.0 billion of share repurchases with no expiration. As of February 3, 2017, the Company had $5.1 billion share repurchases remaining available under the program. In fiscal 2017, the Company expects to repurchase shares totaling $3.5 billion through purchases made from time to time either in the open market or through private off market transactions in accordance with SEC regulations. | |||||||||||||
|
|
| |||||||||||||
| 3 | In November 2016, the Company entered into an Accelerated Share Repurchase (ASR) agreement with a third-party financial institution to repurchase $190 million of the Company’s common stock. Pursuant to the agreement, the Company paid $190 million to the financial institution and received an initial delivery of 2.4 million shares. In January 2017, the Company finalized the transaction and received an additional 0.2 million shares. The average price paid per share in settlement of the ASR agreement included in the table above was determined with reference to the volume-weighted average price of the Company’s common stock over the term of the ASR agreement. See Note 9 to the consolidated financial statements included in this Annual Report. | |||||||||||||
Item 6 - Selected Financial Data
|
| |||||||||||||||||||||||||||||||||||||||
|
|
|
|
|
|
|
|
|
|
|
|
|
|
|
|
|
|
|
|
| ||||||||||||||||||||
| Selected Statement of Earnings Data (In millions, except per share data) | 2016 1 |
|
| 2015 |
|
| 2014 |
|
| 2013 |
|
| 2012 |
| |||||||||||||||||||||||||
| Net sales | $ | 65,017 |
|
| $ | 59,074 |
|
| $ | 56,223 |
|
| $ | 53,417 |
|
| $ | 50,521 |
| ||||||||||||||||||||
| Gross margin | 22,464 |
|
| 20,570 |
|
| 19,558 |
|
| 18,476 |
|
| 17,327 |
| |||||||||||||||||||||||||
| Operating income | 5,846 |
|
| 4,971 |
|
| 4,792 |
|
| 4,149 |
|
| 3,560 |
| |||||||||||||||||||||||||
| Net earnings | 3,093 |
|
| 2,546 |
|
| 2,698 |
|
| 2,286 |
|
| 1,959 |
| |||||||||||||||||||||||||
| Basic earnings per common share | 3.48 |
|
| 2.73 |
|
| 2.71 |
|
| 2.14 |
|
| 1.69 |
| |||||||||||||||||||||||||
| Diluted earnings per common share | 3.47 |
|
| 2.73 |
|
| 2.71 |
|
| 2.14 |
|
| 1.69 |
| |||||||||||||||||||||||||
| Dividends per share | $ | 1.33 |
|
| $ | 1.07 |
|
| $ | 0.87 |
|
| $ | 0.70 |
|
| $ | 0.62 |
| ||||||||||||||||||||
| Selected Balance Sheet Data |
|
|
|
|
|
|
|
|
| ||||||||||||||||||||||||||||||
| Total assets | $ | 34,408 |
|
| $ | 31,266 |
|
| $ | 31,721 |
|
| $ | 32,471 |
|
| $ | 32,441 |
| ||||||||||||||||||||
| Long-term debt, excluding current maturities | $ | 14,394 |
|
| $ | 11,545 |
|
| $ | 10,806 |
|
| $ | 10,077 |
|
| $ | 9,022 |
| ||||||||||||||||||||
|
|
| ||||||||||||||||||||||||||||||||||||||
| 1 | Fiscal 2016 contained 53 weeks, while all other years contained 52 weeks. | ||||||||||||||||||||||||||||||||||||||
18
Table of Contents
Item 7 - Management’s Discussion and Analysis of Financial Condition and Results of Operations
The following discussion and analysis summarizes the significant factors affecting our consolidated operating results, financial condition, liquidity and capital resources during the three-year period ended February 3, 2017 (our fiscal years 2016, 2015 and 2014). Fiscal year 2016 contains 53 weeks of operating results compared to fiscal years 2015 and 2014 which contain 52 weeks. Unless otherwise noted, all references herein for the years 2016, 2015 and 2014 represent the fiscal years ended February 3, 2017, January 29, 2016 and January 30, 2015, respectively. We intend for this discussion to provide the reader with information that will assist in understanding our financial statements, the changes in certain key items in those financial statements from year to year, and the primary factors that accounted for those changes, as well as how certain accounting principles affect our financial statements. This discussion should be read in conjunction with our consolidated financial statements and notes to the consolidated financial statements included in this Annual Report that have been prepared in accordance with accounting principles generally accepted in the United States of America. This discussion and analysis is presented in six sections:
|
|
| ||||
| • | Executive Overview | ||||
|
|
| ||||
| • | Operations | ||||
|
|
| ||||
| • | Financial Condition, Liquidity and Capital Resources | ||||
|
|
| ||||
| • | Off-Balance Sheet Arrangements | ||||
|
|
| ||||
| • | Contractual Obligations and Commercial Commitments | ||||
|
|
| ||||
| • | Critical Accounting Policies and Estimates | ||||
EXECUTIVE OVERVIEW
Net sales for 2016 were $65.0 billion, a 10.1% increase over fiscal year 2015. The increase in total sales was driven by an increase in comparable sales, the acquisition of RONA in May 2016, the 53 rd week, and new stores. Comparable sales increased 4.2%, driven by a comparable average ticket increase of 2.5% and a comparable transaction increase of 1.6%. The addition of RONA and the 53 rd week contributed 3.8% and 1.6%, respectively, to the sales growth for 2016. Net earnings increased 21.5% to $3.1 billion. Diluted earnings per common share increased 27.1% in fiscal year 2016 to $3.47 from $2.73 in 2015. Adjusting 2016 and 2015 amounts for certain significant discrete items not originally contemplated in the business outlooks for those respective years, adjusted diluted earnings per common share increased 21.3% in fiscal year 2016 to $3.99 from $3.29 in 2015 (see discussion on non-GAAP financial measures beginning on page 22).
For 2016, cash flows from operating activities were approximately $5.6 billion, with $1.2 billion used for capital expenditures. Continuing to deliver on our commitment to return excess cash to shareholders, the Company repurchased 46.7 million shares of stock through the share repurchase program for $3.5 billion and paid $1.1 billion in dividends during the year.
Throughout 2016, we remained committed to our key priorities including differentiating ourselves with better customer experiences and improving our product and service offering for the Pro customer. In addition, we continued to enhance our omni-channel experiences, driving customer engagement by delivering convenience, inspiration, expertise, and efficiency across the most relevant moments of the customer’s project journey.
We continued to leverage our larger store formats and expertise in customer experience design to create product sets to inspire customers to envision a variety of possibilities in their own homes. Our customer experience design work is rooted in research around customers’ expectations and how they think about home improvement projects. Whether it is showcasing a series of kitchen vignettes to highlight all the design elements of a kitchen remodel, or a smaller project, such as a bathroom lighting upgrade, we simplify presentation by grouping fixtures by style and collection in order to provide a cohesive decorating solution. By providing an integrated assortment of products, inspiring and intuitive presentation and display, and optimal service components across all selling channels, we are able to provide better customer experiences that differentiate us in the marketplace.
We remained committed to building upon our strong foundation with the Pro customer by continuing to advance our product and service offerings to meet their unique needs. Throughout the year, we made improvements to inventory depth, national and local brand assortment, and the strength of our service offering through the use of our Account Executive ProServices teams. We enhanced features and functionality of LowesForPros.com, which provides an e-commerce platform where the Pro customer can develop requisition lists, access purchase history, create custom catalogs, and simplify online ordering, saving time and allowing them to run their business more efficiently.
We continued to enhance our omni-channel capabilities during the year. We upgraded the Lowes.com shopping experience with improved product content and search functionality inclusive of upgrades such as refined search algorithms, expanded
19
Table of Contents
content recommendations, improved click-to-chat capabilities, larger images, and expanded product views, and video content. We have built an array of tools to help our customers visualize their projects and bring them to life, displaying project ideas on Pinterest, Facebook, and our own channels on Apple TV, Fire TV, and Roku in addition to lowes.com and YouTube. During 2016, we completed the national rollout of our interior project specialist program. Both interior and exterior project specialists are now available across all U.S. home improvement stores to meet with customers in their homes to design, plan, and complete their home improvement projects. This in-home selling program, which is a critical element of our omni-channel strategy, represents a differentiated capability in capturing and serving customers’ interior and exterior project demand.
During the second quarter of 2016, we also completed our acquisition of RONA, one of Canada’s largest retailers and distributors of hardware, building materials, home renovation, and gardening products. The acquisition enables the Company to accelerate its growth strategy in the Canadian home improvement market, and we continued to make progress on the integration of RONA in the second half of the year. We remain focused on three critical factors to enable us to enhance our competitiveness and profitability in Canada and position us to capitalize on the long-term potential of the market. These include enhancing customer relevance, expanding customer reach by serving a new portion of the market, and driving increased profitability by leveraging our shared supplier relationships, enhanced scale, and private-label brand capabilities while eliminating RONA’s public company costs.
Looking Forward
Economic forecasts for 2017 suggest the outlook for the home improvement industry remains favorable as the economy continues to be led by growth in consumer spending. The home improvement industry is poised to grow its share of wallet as a percent of overall consumer spending, given sustained home price recovery and continued job and income gains. In addition, consumer balance sheets are strong as debt service ratios are near record lows and access to credit is gradually improving. Along with stronger incomes and rising home prices, we believe stronger household financial conditions will support discretionary home improvement spending. These macro factors should continue to contribute to household formation, which will sustain home buying and related spending as homeowners upgrade and refresh their homes.
In 2017, we look to build upon our strong foundation to better serve the needs of a rapidly changing customer and capitalize on a favorable macroeconomic backdrop. We are focused on three strategic objectives to drive value for our customers and shareholders. First, we are dedicated to expanding the reach of home improvement and driving profitable share gains. We are working to serve more customers - DIY, DIFM, and Pro - more effectively and differentiate ourselves by establishing market leadership for home improvement project solutions. Second, we are further adapting to an evolving customer, developing capabilities to anticipate and support their needs. We are empowering customers across the most relevant moments of their project journey, and we are advancing our customer service experience capabilities through our omni-channel assets. Finally, we are committed to generating long-term profitable growth and substantial returns for shareholders. By enhancing our operating discipline and focus, we are making productivity a core strength for Lowe’s. This commitment will drive focus and prioritization, allowing for investment in future capabilities to grow the business, maintain our leadership position, and drive value for shareholders.
20
Table of Contents
OPERATIONS
The following tables set forth the percentage relationship to net sales of each line item of the consolidated statements of earnings, as well as the percentage change in dollar amounts from the prior year. This table should be read in conjunction with the following discussion and analysis and the consolidated financial statements, including the related notes to the consolidated financial statements.
|
| |||||||||||||||
|
|
|
|
|
|
|
|
|
|
| ||||||
|
|
|
| Basis Point Increase / (Decrease) in Percentage of Net Sales from Prior Year 1 |
|
| Percentage Increase / (Decrease) in Dollar Amounts from Prior Year 1 |
| ||||||||
|
| 2016 |
| 2015 |
| 2016 vs. 2015 |
|
| 2016 vs. 2015 |
| ||||||
| Net sales | 100.00% |
| 100.00% |
| N/A |
|
| 10.1 | % | ||||||
| Gross margin | 34.55 |
| 34.82 |
| (27 | ) |
| 9.2 |
| ||||||
| Expenses: |
|
|
|
|
|
|
| ||||||||
| Selling, general and administrative | 23.27 |
| 23.88 |
| (61 | ) |
| 7.2 |
| ||||||
| Depreciation and amortization | 2.29 |
| 2.53 |
| (24 | ) |
| (0.3 | ) | ||||||
| Operating income | 8.99 |
| 8.41 |
| 58 |
|
| 17.6 |
| ||||||
| Interest - net | 0.99 |
| 0.93 |
| 6 |
|
| 16.9 |
| ||||||
| Pre-tax earnings | 8.00 |
| 7.48 |
| 52 |
|
| 17.7 |
| ||||||
| Income tax provision | 3.24 |
| 3.17 |
| 7 |
|
| 12.6 |
| ||||||
| Net earnings | 4.76% |
| 4.31% |
| 45 |
|
| 21.5 | % | ||||||
|
|
|
|
|
|
|
|
| ||||||||
|
|
|
| Basis Point Increase / (Decrease) in Percentage of Net Sales from Prior Year |
|
| Percentage Increase / (Decrease) in Dollar Amounts from Prior Year |
| ||||||||
|
| 2015 |
| 2014 |
| 2015 vs. 2014 |
|
| 2015 vs. 2014 |
| ||||||
| Net sales | 100.00% |
| 100.00% |
| N/A |
|
| 5.1 | % | ||||||
| Gross margin | 34.82 |
| 34.79 |
| 3 |
|
| 5.2 |
| ||||||
| Expenses: |
|
|
|
|
|
|
| ||||||||
| Selling, general and administrative | 23.88 |
| 23.60 |
| 28 |
|
| 6.3 |
| ||||||
| Depreciation and amortization | 2.53 |
| 2.66 |
| (13 | ) |
| — |
| ||||||
| Operating income | 8.41 |
| 8.53 |
| (12 | ) |
| 3.7 |
| ||||||
| Interest - net | 0.93 |
| 0.92 |
| 1 |
|
| 7.0 |
| ||||||
| Pre-tax earnings | 7.48 |
| 7.61 |
| (13 | ) |
| 3.3 |
| ||||||
| Income tax provision | 3.17 |
| 2.81 |
| 36 |
|
| 18.6 |
| ||||||
| Net earnings | 4.31% |
| 4.80% |
| (49 | ) |
| (5.6 | )% | ||||||
21
Table of Contents
|
| ||||||||||||||||||
|
|
|
|
|
|
|
|
|
|
|
|
| |||||||
| Other Metrics | 2016 |
|
| 2015 |
|
| 2014 |
| ||||||||||
| Comparable sales increase 2 | 4.2 | % |
| 4.8 | % |
| 4.3 | % | ||||||||||
| Total customer transactions (in millions) 1 | 945 |
|
| 878 |
|
| 857 |
| ||||||||||
| Average ticket 3 | $ | 68.82 |
|
| $ | 67.26 |
|
| $ | 65.61 |
| |||||||
| At end of year: |
|
|
|
|
| |||||||||||||
| Number of stores 4 | 2,129 |
|
| 1,857 |
|
| 1,840 |
| ||||||||||
| Sales floor square feet (in millions) | 213 |
|
| 202 |
|
| 201 |
| ||||||||||
| Average store size selling square feet (in thousands) 5 | 100 |
|
| 109 |
|
| 109 |
| ||||||||||
| Return on average assets 6 | 8.9 | % |
| 7.8 | % |
| 8.2 | % | ||||||||||
| Return on average shareholders’ equity 7 | 44.4 | % |
| 28.8 | % |
| 24.4 | % | ||||||||||
| Return on invested capital 8 | 15.8 | % |
| 14.1 | % |
| 13.9 | % | ||||||||||
|
|
| |||||||||||||||||
| 1 | The fiscal year ended February 3, 2017 had 53 weeks. The fiscal years ended January 29, 2016 and January 30, 2015 had 52 weeks. | |||||||||||||||||
|
|
| |||||||||||||||||
| 2 | A comparable location is defined as a location that has been open longer than 13 months. A location that is identified for relocation is no longer considered comparable one month prior to its relocation. The relocated location must then remain open longer than 13 months to be considered comparable. A location we have decided to close is no longer considered comparable as of the beginning of the month in which we announce its closing. Acquired locations are included in the comparable sales calculation beginning in the first full month following the first anniversary of the date of the acquisition. Comparable sales include online sales, which did not have a meaningful impact for the periods presented. The comparable store sales calculation for 2016 included in the preceding table was calculated using sales for a comparable 53-week period. | |||||||||||||||||
|
|
| |||||||||||||||||
| 3 | Average ticket is defined as net sales divided by the total number of customer transactions. | |||||||||||||||||
|
|
| |||||||||||||||||
| 4 | The number of stores as of February 3, 2017 includes 245 stores acquired in the acquisition of RONA. | |||||||||||||||||
|
|
| |||||||||||||||||
| 5 | Average store size selling square feet is defined as sales floor square feet divided by the number of stores open at the end of the period. The average Lowe’s-branded home improvement store has approximately 112,000 square feet of retail selling space. | |||||||||||||||||
|
|
| |||||||||||||||||
| 6 | Return on average assets is defined as net earnings divided by average total assets for the last five quarters. | |||||||||||||||||
|
|
| |||||||||||||||||
| 7 | Return on average shareholders’ equity is defined as net earnings divided by average shareholders’ equity for the last five quarters. | |||||||||||||||||
|
|
| |||||||||||||||||
| 8 | Return on invested capital is a non-GAAP financial measure. See below for additional information and a reconciliation to the most comparable GAAP measure. | |||||||||||||||||
Non-GAAP Financial Measures
Return on Invested Capital
Return on Invested Capital (ROIC) is a non-GAAP financial measure. We believe ROIC is a meaningful metric for investors because it represents management’s measure of how effectively the Company is using capital to generate profits.
We define ROIC as trailing four quarters’ net operating profit after tax divided by the average of ending debt and equity for the last five quarters. Although ROIC is a common financial metric, numerous methods exist for calculating ROIC. Accordingly, the method used by our management to calculate ROIC may differ from the methods other companies use to calculate their ROIC. We encourage you to understand the methods used by another company to calculate its ROIC before comparing its ROIC to ours.
We consider return on average debt and equity to be the financial measure computed in accordance with generally accepted accounting principles that is the most directly comparable GAAP financial measure to ROIC. The difference between these two measures is that ROIC adjusts net earnings to exclude tax adjusted interest expense.
22
Table of Contents
The calculation of ROIC, together with a reconciliation to the calculation of return on average debt and equity, the most comparable GAAP financial measure, is as follows:
|
| |||||||||||||||||
|
|
|
|
|
|
|
|
|
|
|
|
| ||||||
| (In millions, except percentage data) | 2016 |
|
| 2015 |
|
| 2014 |
| |||||||||
| Calculation of Return on Invested Capital |
|
|
|
|
| ||||||||||||
| Numerator |
|
|
|
|
| ||||||||||||
| Net earnings | $ | 3,093 |
|
| $ | 2,546 |
|
| $ | 2,698 |
| ||||||
| Plus: |
|
|
|
|
| ||||||||||||
| Interest expense - net | 645 |
|
| 552 |
|
| 516 |
| |||||||||
| Provision for income taxes | 2,108 |
|
| 1,873 |
|
| 1,578 |
| |||||||||
| Earnings before interest and taxes | 5,846 |
|
| 4,971 |
|
| 4,792 |
| |||||||||
| Less: |
|
|
|
|
| ||||||||||||
| Income tax adjustment 1 | 2,370 |
|
| 2,058 |
|
| 1,769 |
| |||||||||
| Net operating profit after tax | $ | 3,476 |
|
| $ | 2,913 |
|
| $ | 3,024 |
| ||||||
| Effective tax rate | 40.5 | % |
| 42.4 | % |
| 36.9 | % | |||||||||
| Denominator |
|
|
|
|
| ||||||||||||
| Average debt and equity 2 | $ | 21,958 |
|
| $ | 20,693 |
|
| $ | 21,744 |
| ||||||
| Return on invested capital | 15.8 | % |
| 14.1 | % |
| 13.9 | % | |||||||||
|
|
|
|
|
|
| ||||||||||||
| Calculation of Return on Average Debt and Equity |
|
|
|
|
| ||||||||||||
| Numerator |
|
|
|
|
| ||||||||||||
| Net earnings | $ | 3,093 |
|
| $ | 2,546 |
|
| $ | 2,698 |
| ||||||
| Denominator |
|
|
|
|
| ||||||||||||
| Average debt and equity 2 | $ | 21,958 |
|
| $ | 20,693 |
|
| $ | 21,744 |
| ||||||
| Return on average debt and equity | 14.1 | % |
| 12.3 | % |
| 12.4 | % | |||||||||
|
|
| ||||||||||||||||
| 1 | Income tax adjustment is defined as earnings before interest and taxes multiplied by the effective tax rate. | ||||||||||||||||
|
|
| ||||||||||||||||
| 2 | Average debt and equity is defined as average debt, including current maturities and short-term borrowings, plus total equity for the last five quarters. | ||||||||||||||||
Adjusted Diluted Earnings Per Share
To provide additional transparency, the Company has presented non-GAAP financial measures of adjusted diluted earnings per share to exclude the impact of certain discrete items not contemplated in Lowe’s 2016 and 2015 business outlooks. The Company believes this non-GAAP financial measure provides useful insight for analysts and investors in evaluating what management considers the Company’s core financial performance.
Adjusted diluted earnings per share should not be considered an alternative to, or more meaningful indicator of, the Company’s diluted earnings per common share as prepared in accordance with GAAP. The Company’s methods of determining this non-GAAP financial measure may differ from the method used by other companies for this or similar non-GAAP financial measures. Accordingly, these non-GAAP measures may not be comparable to the measures used by other companies.
23
Table of Contents
|
| ||||||||||||||||||||||||||||||||||||||||||||||
|
|
|
|
|
|
|
|
|
|
|
|
|
|
|
|
|
|
|
|
| |||||||||||||||||||||||||||
|
| 2016 |
| 2015 | |||||||||||||||||||||||||||||||||||||||||||
|
| Pre-Tax Earnings |
| Tax |
| Net Earnings |
| Pre-Tax Earnings |
| Tax |
| Net Earnings | |||||||||||||||||||||||||||||||||||
| Diluted earnings per share, as reported |
|
|
|
| $ | 3.47 |
|
|
|
|
|
| $ | 2.73 |
| |||||||||||||||||||||||||||||||
| Non-GAAP Adjustments - per share impacts |
|
|
|
|
|
|
|
|
|
|
| |||||||||||||||||||||||||||||||||||
| Severance-related costs 1 | 0.09 |
|
| (0.03 | ) |
| 0.06 |
|
| — |
|
| — |
|
| — |
| |||||||||||||||||||||||||||||
| IRC Section 987 charge 2 | — |
|
| 0.04 |
|
| 0.04 |
|
| — |
|
| — |
|
| — |
| |||||||||||||||||||||||||||||
| Premium paid to acquire noncontrolling interest 3 | — |
|
| — |
|
| 0.02 |
|
| — |
|
| — |
|
| — |
| |||||||||||||||||||||||||||||
| Net gain on foreign currency hedge 4 | (0.09 | ) |
| 0.04 |
|
| (0.05 | ) |
| — |
|
| — |
|
| — |
| |||||||||||||||||||||||||||||
| Australian joint venture impairment 5 | 0.33 |
|
| — |
|
| 0.33 |
|
| 0.56 |
|
| — |
|
| 0.56 |
| |||||||||||||||||||||||||||||
| Project write-offs 6 | 0.11 |
|
| (0.04 | ) |
| 0.07 |
|
| — |
|
| — |
|
| — |
| |||||||||||||||||||||||||||||
| Orchard Supply Hardware goodwill and long-lived asset impairment 7 | 0.08 |
|
| (0.03 | ) |
| 0.05 |
|
| — |
|
| — |
|
| — |
| |||||||||||||||||||||||||||||
| Adjusted diluted earnings per share |
|
|
|
| $ | 3.99 |
|
|
|
|
|
| $ | 3.29 |
| |||||||||||||||||||||||||||||||
|
|
|
|
|
|
|
|
|
|
|
|
| |||||||||||||||||||||||||||||||||||
|
|
| |||||||||||||||||||||||||||||||||||||||||||||
| 1 | Represents the costs associated with the Company’s organizational changes in the stores, distribution centers, and corporate offices. | |||||||||||||||||||||||||||||||||||||||||||||
|
|
| |||||||||||||||||||||||||||||||||||||||||||||
| 2 | Represents tax charge primarily related to the passage of Internal Revenue Code Section 987 regulations in 2016. | |||||||||||||||||||||||||||||||||||||||||||||
|
|
| |||||||||||||||||||||||||||||||||||||||||||||
| 3 | Represents the premium paid to RONA’s preferred shareholders. Under the two-class method, the premium paid was deducted from net earnings to compute net earnings allocable to common shareholders. | |||||||||||||||||||||||||||||||||||||||||||||
|
|
| |||||||||||||||||||||||||||||||||||||||||||||
| 4 | Represents the net settlement of a foreign currency hedge entered into in advance of the Company’s acquisition of RONA during 2016. | |||||||||||||||||||||||||||||||||||||||||||||
|
|
| |||||||||||||||||||||||||||||||||||||||||||||
| 5 | Represents impairment charges related to the Company’s Australian joint venture with Woolworths. | |||||||||||||||||||||||||||||||||||||||||||||
|
|
| |||||||||||||||||||||||||||||||||||||||||||||
| 6 | Represents charges recognized in 2016 for projects canceled as a part of the Company’s ongoing review of strategic initiatives. | |||||||||||||||||||||||||||||||||||||||||||||
|
|
| |||||||||||||||||||||||||||||||||||||||||||||
| 7 | Represents impairment charges associated with the Company’s Orchard Supply Hardware operations as part of a strategic reassessment of this business during 2016. | |||||||||||||||||||||||||||||||||||||||||||||
Fiscal 2016 Compared to Fiscal 2015
For the purpose of the following discussion, comparable store sales, comparable store average ticket and comparable store customer transactions are based upon comparable 53-week periods.
Net sales – Net sales increased 10.1% to $65.0 billion in 2016. The increase in total sales was driven by an increase in comparable sales, the addition of RONA, the 53 rd week, and new stores. The addition of RONA and the 53 rd week contributed 3.8% and 1.6%, respectively, to the sales growth for 2016. The comparable sales increase of 4.2% in 2016 was driven by a 2.5% increase in comparable average ticket and a 1.6% increase in comparable customer transactions. Comparable sales during each quarter of the fiscal year, as reported, were 7.3% in the first quarter, 2.0% in the second quarter, 2.7% in the third quarter, and 5.1% in the fourth quarter.
All of our product categories experienced comparable sales increases for the year. During 2016, we experienced comparable sales increases above the company average in Lumber & Building Materials, Appliances, Tools & Hardware, and Lawn & Garden. Performance in Lumber & Building Materials and Tools & Hardware was driven by strong demand from the Pro customer. Tools & Hardware also benefited from customers’ positive response to our continued enhancements in product assortment and brand relevance. Strong brand and service advantages in Appliances, as well as our continued investment in customer experience both in-store and online, drove solid comparable sales during the year. An extended outdoor selling season as a result of favorable weather conditions, positively impacted sales within Lawn & Garden. Geographically, all of our 14 U.S. regions experienced increases in comparable store sales, with the strongest results in the South and Northwest.
During the fourth quarter of 2016, we experienced comparable sales increases in 12 of 13 product categories, with comparable sales increases above the company average in Appliances, Lawn & Garden, Kitchens, Lumber & Building Materials, and Rough Plumbing & Electrical. We experienced low single-digit negative comparable sales in Outdoor Power Equipment. Strong brand and service advantages in Appliances as well as our successful Holiday events drove solid comparable sales during the quarter. Performance in Kitchens was driven by our strategy to focus on the entire Kitchen project, investment in project specialists, and targeted promotions. We experienced strength in several outdoor project categories, including Lawn & Garden, Lumber & Building Materials, and Rough Plumbing & Electrical. Warmer weather, particularly in the South and West, drove strong demand for outdoor projects in Lawn & Garden. Lumber & Building Materials benefited from continued recovery efforts from Hurricane Matthew and Louisiana flooding, as well as strong performance with the Pro customer. Performance in Outdoor Power Equipment was primarily driven by strong performance of winter-weather related products,
24
Table of Contents
such as snow throwers and generators, in the prior year due to a significant winter storm in the northeast during the fourth quarter.
Gross margin – Gross margin of 34.55% for 2016 represented a 27 basis point decrease from 2015. The change was primarily driven by 23 basis points decrease due to purchase price adjustments to RONA’s opening inventory balance, and 11 basis points decrease due to targeted promotional activity, partially offset by 9 basis points increase due to cost reductions associated with Value Improvement efforts.
During the fourth quarter of 2016, gross margin of 34.41% decreased 25 basis points as a percentage of sales. Gross margin was negatively impacted 25 basis points by the RONA business, primarily driven by purchase price adjustments to their opening inventory balance and mix of business.
SG&A – SG&A expense for 2016 leveraged 61 basis points as a percentage of sales compared to 2015. This was primarily driven by 45 basis points of net leverage associated with impairment charges recorded during 2016 versus 2015 relating to our Australian joint venture with Woolworths. We experienced 15 basis points of leverage associated with incentive compensation, 14 basis points in employee insurance costs, and 12 basis points related to the settlement of the foreign currency option contract entered into in anticipation of the RONA acquisition. This was partially offset by 15 basis points of deleverage associated with the write-off of cancelled technology-enabled projects as part of an ongoing review of our strategic initiatives and 12 basis points associated with severance and related costs for organizational changes in the stores, distribution centers, and corporate offices.
During the fourth quarter of 2016, SG&A expense leveraged 445 basis points as a percentage of sales due primarily to 403 basis points of leverage associated with a non-cash impairment charge resulting from our decision to exit our Australian joint venture recorded in the fourth quarter of the prior year. We experienced 59 basis points of leverage in benefits primarily related to incentive compensation due to lower attainment levels compared to the same quarter of the prior year. These were partially offset by 53 basis points of deleverage associated with separation events for organizational changes in the stores, distribution centers, and corporate offices. Store environment, operating salaries, and certain other costs also leveraged as a result of sales growth.
Depreciation and amortization – Depreciation and amortization expense leveraged 24 basis points for 2016 compared to 2015 primarily due to the increase in sales from the 53rd week, partially offset by incremental expense due to the acquisition of RONA. Property, less accumulated depreciation, increased to $19.9 billion at February 3, 2017, compared to $19.6 billion at January 29, 2016. As of February 3, 2017 and January 29, 2016, we owned 79% and 86% of our stores, respectively, which included stores on leased land.
Interest – Net – Net interest expense is comprised of the following:
|
| |||||||
|
|
|
|
|
|
|
|
|
| (In millions) | 2016 |
|
| 2015 |
| ||
| Interest expense, net of amount capitalized | $ | 647 |
|
| $ | 548 |
|
| Amortization of original issue discount and loan costs | 10 |
|
| 8 |
| ||
| Interest income | (12 | ) |
| (4 | ) | ||
| Interest - net | $ | 645 |
|
| $ | 552 |
|
Net interest expense increased due primarily to an increase in total debt compared to the prior year.
Income tax provision - Our effective income tax rate was 40.5% in 2016 compared to 42.4% in 2015. During 2016, the Company was impacted by the passage of the U.S. Internal Revenue Service Internal Revenue Code Section 987, which negatively impacted the income tax rate due to the adjustment of deferred tax assets associated with cumulative currency translation adjustments related to certain of the Company’s international operations. In addition, the Company recorded a deferred tax asset related to the investment in the Australian joint venture with Woolworths associated with the non-cash impairment charges that occurred during both 2016 and 2015. The deferred tax asset associated with these losses was offset with the establishment of a full valuation allowance due to the fact the benefit of these losses can only be realized to the extent the Company has available capital gains for offset, and no present or future capital gains have been identified through which this deferred tax asset can be realized.
Our effective income tax rates were 40.3% and 96.1% for the three months ended February 3, 2017 and January 29, 2016, respectively, due to the same factors that impacted the income tax provision in the year.
25
Table of Contents
Fiscal 2015 Compared to Fiscal 2014
Net sales – Net sales increased 5.1% to $59.1 billion in 2015. The increase in total sales was driven primarily by the comparable sales increase of 4.8% and new stores. The comparable sales increase of 4.8% in 2015 was driven by a 2.5% increase in comparable average ticket and a 2.2% increase in comparable customer transactions. Comparable sales during each quarter of the fiscal year, as reported, were 5.2% in the first quarter, 4.3% in the second quarter, 4.6% in the third quarter, and 5.2% in the fourth quarter.
All of our product categories experienced comparable sales increases for the year. During 2015, comparable sales were above the company average in the following product categories: Appliances, Outdoor Power Equipment, and Seasonal Living. Appliances experienced the strongest growth with a double digit increase in comparable sales as we further strengthened our brand offerings and breadth of assortment and continued to provide service advantages with next-day delivery and haul away. Within Outdoor Power Equipment, we drove strong performance in walk behind and riding mowers as well as pressure washers. The Outdoor Living Experience introduced last year drove comparable sales in our Seasonal Living category, where we continued to see strong sales in patio furniture, replacement cushions, and outdoor accessories. In addition, Tools & Hardware performed at approximately the overall company average driven by strong demand and continued improvement in both product assortment and brand relevance. Geographically, all of our 14 U.S. regions experienced increases in comparable store sales, as sales performance was well balanced across the country.
During the fourth quarter of 2015, we recorded comparable sales increases above the company average in Lumber & Building Materials, Appliances, Lawn & Garden, and Paint. We saw particular strength in outdoor project categories, led by Lumber & Building Materials and Lawn & Garden, as customers took advantage of mild weather to complete exterior projects such as roofs, fences, decks, and lawn care. Our landscape lighting experience also drove strong performance by providing inspiration and easy selection and installation for customers, while offering new product technologies such as LED. We achieved strong comparable sales increases in Appliances during the quarter through strengthened brand offerings and service advantages. Paint benefited from increased project activity, as well as growing awareness of our three-brand offering, providing customers with a full suite of top brands they can trust for their next paint project.
Gross margin – Gross margin of 34.82% for 2015 represented a three basis point increase from 2014 and was primarily driven by cost reductions associated with Value Improvement efforts and product cost deflation, partially offset by negative impacts from targeted promotional activity and mix of products sold.
During the fourth quarter of 2015, gross margin of 34.66% was flat as a percentage of sales due to the same factors that impacted gross margin in the year.
SG&A – SG&A expense for 2015 deleveraged 28 basis points as a percentage of sales compared to 2014. This was primarily driven by 90 basis points of deleverage associated with an impairment charge recorded during the fourth quarter of 2015 related to the valuation of our one-third interest in the Australian joint venture with Woolworths Limited. This was partially offset by 16 basis points of leverage associated with operating salaries as we optimized payroll hours against customer traffic and 16 basis points of leverage in advertising expense due to more efficient and effective media mix compared to the prior year. We experienced eight basis points of leverage in employee insurance costs due to increased sales in the current year partially offset by additional costs associated with the Affordable Care Act. We also experienced eight basis points of leverage in utilities due to stronger sales as well as a decrease in rates and consumption. In addition, we experienced seven basis points of leverage in building and site repair due to a decrease in the number of repairs during the year and seven basis points of leverage in external labor due to completed projects and increased focus on use of internal resources across information technology projects.
During the fourth quarter of 2015, SG&A expense deleveraged 331 basis points as a percentage of sales due primarily to 401 basis points of deleverage associated with the Australian joint venture impairment charge partially offset by leverage in operating salaries, advertising expense, utilities, employee insurance, and certain other fixed costs. We experienced 25 basis points of leverage in operating salaries associated with optimization of store payroll hours and 20 basis points in advertising expense due to more efficient and effective media mix. We also experienced 12 basis points of leverage in utilities primarily the result of warmer weather and 12 basis points in employee insurance costs due to a reduction in the number and severity of claims. Certain other fixed costs also leveraged as a result of sales growth.
Depreciation and amortization – Depreciation and amortization expense leveraged 13 basis points for 2015 compared to 2014 primarily due to the increase in sales. Property, less accumulated depreciation, decreased to $19.6 billion at January 29, 2016 compared to $20.0 billion at January 30, 2015. At January 29, 2016 and January 30, 2015, we owned 86% of our stores, which included stores on leased land.
26
Table of Contents
Interest – Net – Net interest expense is comprised of the following:
|
| |||||||
|
|
|
|
|
|
|
|
|
| (In millions) | 2015 |
|
| 2014 |
| ||
| Interest expense, net of amount capitalized | $ | 548 |
|
| $ | 515 |
|
| Amortization of original issue discount and loan costs | 8 |
|
| 7 |
| ||
| Interest income | (4 | ) |
| (6 | ) | ||
| Interest - net | $ | 552 |
|
| $ | 516 |
|
Net interest expense increased primarily as a result of the issuance of $1.75 billion and $1.25 billion of unsecured notes in September 2015 and 2014, respectively. This was partially offset by the repayment of $500 million unsecured notes on October 15, 2015.
Income tax provision – Our effective income tax rate was 42.4% in 2015 compared to 36.9% in 2014. During 2015, the Company recorded a deferred tax asset related to losses associated with the joint venture investment in Australia with Woolworths Limited. The deferred tax asset associated with these losses was offset with the establishment of a full valuation allowance due to the fact the benefit of these losses can only be realized to the extent the Company has available capital gains for offset, and no present or future capital gains have been identified through which this deferred tax asset can be realized. The effective tax rate in 2014 benefited from the favorable settlement of certain federal tax matters.
FINANCIAL CONDITION, LIQUIDITY AND CAPITAL RESOURCES
Cash Flows
The following table summarizes our cash flow activities for each of the three most recent fiscal years ended February 3, 2017:
|
| ||||||||||||
|
|
|
|
|
|
|
|
|
| ||||
| (In millions) | 2016 |
|
| 2015 |
|
| 2014 |
| ||||
| Net cash provided by (used in): |
|
|
|
|
| |||||||
| Operating activities | 5,617 |
|
| 4,784 |
|
| 4,929 |
| ||||
| Investing activities | (3,361 | ) |
| (1,343 | ) |
| (1,088 | ) | ||||
| Financing activities | (2,092 | ) |
| (3,493 | ) |
| (3,761 | ) | ||||
Cash flows from operating activities continued to provide the primary source of our liquidity. The increase in net cash provided by operating activities for 2016 versus 2015 was primarily driven by an increase in net earnings, adjusted for non-cash expenses and improved working capital management. The decrease in net cash provided by operating activities for 2015 versus 2014 was primarily driven by changes in working capital.
The increase in net cash used in investing activities for 2016 versus 2015 was primarily driven by the acquisition of RONA. The increase in net cash used in investing activities for 2015 versus 2014 was primarily driven by increased capital expenditures and purchases of investments, net of sales and maturities, partially offset by decreased contributions to equity method investments.
The decrease in net cash used in financing activities for 2016 versus 2015 was driven primarily by an increase in net proceeds from the issuance of long-term debt. The Company received proceeds of $3.3 billion from the issuance of unsecured notes in 2016 compared to $1.7 billion in 2015. The decrease in net cash used in financing activities is also attributable to a decrease in share repurchases, and is partially offset by an increase in repayments of long-term debt. The decrease in net cash used in financing activities for 2015 versus 2014 was driven primarily by increased proceeds from the issuance of long-term debt in 2015 and net repayments of short-term borrowings in 2014 versus net borrowings in 2015. This was partially offset by increased repayments of long-term debt and increased cash dividend payments in 2015.
Sources of Liquidity
Liquidity is provided primarily by our cash flows from operations, short-term borrowing facilities, and long-term debt.
In November 2016, the Company entered into an amended and restated credit agreement (the Amended Facility) with a syndicate of banks to modify the Company’s credit agreement dated August 29, 2014 (the 2014 Credit Facility), which provided for borrowings up to $1.75 billion through August 2019. The Amended Facility extends the maturity date to
27
Table of Contents
November 2021 and continues to provide for borrowings up to $1.75 billion. Subject to obtaining commitments from the lenders and satisfying other conditions specified in the Amended Facility, the Company may increase the aggregate availability by an additional $500 million. The Amended Facility supports our commercial paper program and has a $500 million letter of credit sublimit. Letters of credit issued pursuant to the facility reduce the amount available for borrowing under its terms. Borrowings made are unsecured and priced at fixed rates based upon market conditions at the time of funding in accordance with the terms of the facility. The Amended Facility contains customary representations, warranties, and covenants for a transaction of this type. We were in compliance with those covenants at February 3, 2017. As of February 3, 2017, there were $510 million of outstanding borrowings under the commercial paper program and no outstanding borrowings or letters of credit under the credit facility.
We expect to continue to have access to the capital markets on both short-term and long-term bases when needed for liquidity purposes by issuing commercial paper or new long-term debt. The availability and the borrowing costs of these funds could be adversely affected, however, by a downgrade of our debt ratings or a deterioration of certain financial ratios. The table below reflects our debt ratings by Standard & Poor’s (S&P) and Moody’s as of April 3, 2017, which we are disclosing to enhance understanding of our sources of liquidity and the effect of our ratings on our cost of funds. Although we currently do not expect a downgrade in our debt ratings, our commercial paper and senior debt ratings may be subject to revision or withdrawal at any time by the assigning rating organization, and each rating should be evaluated independently of any other rating.
|
| |||
|
|
|
|
|
| Debt Ratings | S&P |
| Moody’s |
| Commercial Paper | A-2 |
| P-2 |
| Senior Debt | A- |
| A3 |
| Outlook | Stable |
| Stable |
We believe that net cash provided by operating and financing activities will be adequate not only for our operating requirements, but also for investments in our existing stores and distribution facilities, investments in information technology, expansion plans, acquisitions, if any, and to return cash to shareholders through both dividends and share repurchases over the next 12 months. There are no provisions in any agreements that would require early cash settlement of existing debt or leases as a result of a downgrade in our debt rating or a decrease in our stock price. In addition, we do not believe it will be necessary to repatriate significant cash and cash equivalents and short-term investments held in foreign affiliates to fund domestic operations.
Cash Requirements
Capital expenditures
Our fiscal 2017 capital forecast is approximately $1.4 billion. Investments in our existing stores, including investments in remerchandising, store equipment, and technology, are expected to account for approximately 40% of net cash outflow. Our expansion plans are expected to account for approximately 35% of planned net cash outflow. Approximately 20% of planned net cash outflow is for corporate programs, including investments to enhance the customer experience, as well as enhancements to the corporate infrastructure. Other planned capital expenditures, accounting for approximately 5% of planned net cash outflow, are for investments in our existing distribution network.
Debt and capital
Unsecured debt of $500 million and $250 million is scheduled to mature in April 2017 and September 2017, respectively. See Note 8 to the consolidated financial statements included herein for additional information regarding long-term debt, including fiscal year 2016 financing activities.
We have an ongoing share repurchase program, authorized by the Company’s Board of Directors, that is executed through purchases made from time to time either in the open market or through private off-market transactions. Shares purchased under the share repurchase program are retired and returned to authorized and unissued status. As of February 3, 2017, we had $5.1 billion share repurchases remaining available under our program with no expiration date. In fiscal 2017, we expect to repurchase shares totaling $3.5 billion through purchases made from time to time either in the open market or through private off market transactions in accordance with SEC regulations. See Note 9 to the consolidated financial statements included herein for additional information regarding share repurchases.
28
Table of Contents
Dividends declared during fiscal 2016 totaled $1.2 billion. Our dividend payment dates are established such that dividends are paid in the quarter immediately following the quarter in which they are declared. The dividend declared in the fourth quarter of 2016 was paid in fiscal 2017 and totaled $304 million.
Our ratio of debt to equity plus debt was 70.8% and 62.3% as of February 3, 2017, and January 29, 2016, respectively.
OFF-BALANCE SHEET ARRANGEMENTS
Other than in connection with executing operating leases, we do not have any off-balance sheet financing that has, or is reasonably likely to have, a current or future material effect on our financial condition, cash flows, results of operations, liquidity, capital expenditures or capital resources.
CONTRACTUAL OBLIGATIONS AND COMMERCIAL COMMITMENTS
The following table summarizes our significant contractual obligations at February 3, 2017:
|
| ||||||||||||||||||||||||||||||||||||||||
|
|
|
|
|
|
|
|
|
|
|
|
|
|
|
|
|
|
|
|
| |||||||||||||||||||||
|
| Payments Due by Period | |||||||||||||||||||||||||||||||||||||||
| Contractual Obligations (in millions) | Total |
|
| Less Than 1 Year |
|
| 1-3 Years |
|
| 4-5 Years |
|
| After 5 Years |
| ||||||||||||||||||||||||||
| Long-term debt (principal amounts, excluding discount and debt issuance costs) | $ | 14,466 |
|
| $ | 751 |
|
| $ | 1,301 |
|
| $ | 1,526 |
|
| $ | 10,888 |
| |||||||||||||||||||||
| Long-term debt (interest payments) | 9,533 |
|
| 577 |
|
| 1,105 |
|
| 1,037 |
|
| 6,814 |
| ||||||||||||||||||||||||||
| Capitalized lease obligations 1, 2 | 1,454 |
|
| 87 |
|
| 260 |
|
| 165 |
|
| 942 |
| ||||||||||||||||||||||||||
| Operating leases 1 | 5,853 |
|
| 617 |
|
| 1,140 |
|
| 974 |
|
| 3,122 |
| ||||||||||||||||||||||||||
| Purchase obligations 3 | 1,409 |
|
| 876 |
|
| 393 |
|
| 139 |
|
| 1 |
| ||||||||||||||||||||||||||
| Total contractual obligations | $ | 32,715 |
|
| $ | 2,908 |
|
| $ | 4,199 |
|
| $ | 3,841 |
|
| $ | 21,767 |
| |||||||||||||||||||||
|
|
|
|
|
|
|
|
|
|
| |||||||||||||||||||||||||||||||
|
| Amount of Commitment Expiration by Period | |||||||||||||||||||||||||||||||||||||||
| Commercial Commitments (in millions) | Total |
|
| Less Than 1 Year |
|
| 1-3 Years |
|
| 4-5 Years |
|
| After 5 Years |
| ||||||||||||||||||||||||||
| Letters of Credit 4 | $ | 67 |
|
| $ | 60 |
|
| $ |
|
| $ | — |
|
| $ | — |
| ||||||||||||||||||||||
|
|
| |||||||||||||||||||||||||||||||||||||||
| 1 | Amounts do not include taxes, common area maintenance, insurance, or contingent rent because these amounts have historically been insignificant. | |||||||||||||||||||||||||||||||||||||||
|
|
| |||||||||||||||||||||||||||||||||||||||
| 2 | Amounts include imputed interest and residual values. | |||||||||||||||||||||||||||||||||||||||
|
|
| |||||||||||||||||||||||||||||||||||||||
| 3 | Purchase obligations include agreements to purchase goods or services that are enforceable, are legally binding, and specify all significant terms, including fixed or minimum quantities to be purchased; fixed, minimum or variable price provisions; and the approximate timing of the transaction. Our purchase obligations include firm commitments related to certain marketing and information technology programs, as well as purchases of merchandise inventory. | |||||||||||||||||||||||||||||||||||||||
|
|
| |||||||||||||||||||||||||||||||||||||||
| 4 | Letters of credit are issued primarily for insurance and construction contracts. | |||||||||||||||||||||||||||||||||||||||
CRITICAL ACCOUNTING POLICIES AND ESTIMATES
The preparation of the consolidated financial statements and notes to consolidated financial statements presented in this Annual Report requires us to make estimates that affect the reported amounts of assets, liabilities, sales and expenses, and related disclosures of contingent assets and liabilities. We base these estimates on historical results and various other assumptions believed to be reasonable, all of which form the basis for making estimates concerning the carrying values of assets and liabilities that are not readily available from other sources. Actual results may differ from these estimates.
Our significant accounting policies are described in Note 1 to the consolidated financial statements. We believe that the following accounting policies affect the most significant estimates and management judgments used in preparing the consolidated financial statements.
29
Table of Contents
Merchandise Inventory
Description
We record an obsolete inventory reserve for the anticipated loss associated with selling inventories below cost. This reserve is based on our current knowledge with respect to inventory levels, sales trends and historical experience. During 2016, our reserve increased approximately $14 million to $59 million as of February 3, 2017.
We also record an inventory reserve for the estimated shrinkage between physical inventories. This reserve is based primarily on actual shrinkage results from previous physical inventories. During 2016, the inventory shrinkage reserve increased approximately $18 million to $189 million as of February 3, 2017.
In addition, we receive funds from vendors in the normal course of business, principally as a result of purchase volumes, sales, early payments or promotions of vendors’ products. Generally, these vendor funds do not represent the reimbursement of specific, incremental and identifiable costs that we incurred to sell the vendor’s product. Therefore, we treat these funds as a reduction in the cost of inventory as the amounts are accrued, and recognize these funds as a reduction of cost of sales when the inventory is sold. Funds that are determined to be reimbursements of specific, incremental and identifiable costs incurred to sell vendors’ products are recorded as an offset to the related expense.
Judgments and uncertainties involved in the estimate
We do not believe that our merchandise inventories are subject to significant risk of obsolescence in the near term, and we have the ability to adjust purchasing practices based on anticipated sales trends and general economic conditions. However, changes in consumer purchasing patterns or a deterioration in product quality could result in the need for additional reserves. Likewise, changes in the estimated shrink reserve may be necessary, based on the timing and results of physical inventories. We also apply judgment in the determination of levels of obsolete inventory and assumptions about net realizable value.
For vendor funds, we develop accrual rates based on the provisions of the agreements in place. Due to the complexity and diversity of the individual vendor agreements, we perform analyses and review historical purchase trends and volumes throughout the year, adjust accrual rates as appropriate and confirm actual amounts with select vendors to ensure the amounts earned are appropriately recorded. Amounts accrued throughout the year could be impacted if actual purchase volumes differ from projected purchase volumes, especially in the case of programs that provide for increased funding when graduated purchase volumes are met.
Effect if actual results differ from assumptions
We have not made any material changes in the methodology used to establish our inventory valuation or the related reserves for obsolete inventory or inventory shrinkage during the past three fiscal years. We believe that we have sufficient current and historical knowledge to record reasonable estimates for both of these inventory reserves. However, it is possible that actual results could differ from recorded reserves. A 10% change in either the amount of products considered obsolete or the weighted average estimated loss rate used in the calculation of our obsolete inventory reserve would have affected net earnings by approximately $3 million for 2016. A 10% change in the estimated shrinkage rate included in the calculation of our inventory shrinkage reserve would have affected net earnings by approximately $12 million for 2016.
We have not made any material changes in the methodology used to recognize vendor funds during the past three fiscal years. If actual results are not consistent with the assumptions and estimates used, we could be exposed to additional adjustments that could positively or negatively impact gross margin and inventory. However, substantially all receivables associated with these activities do not require subjective long-term estimates because they are collected within the following fiscal year. Adjustments to gross margin and inventory in the following fiscal year have historically not been material.
Impairment of Investments
Description
We use the equity method to account for investments in companies if the investment provides the ability to exercise significant influence, but not control, over operating and financial policies of the investee. Our proportionate share of the net income or loss of these companies is included in consolidated net earnings. We use the cost method to account for investments in companies for which we do not exercise significant influence. Each of the Company’s equity method and cost method investments are subject to a review for impairment if, and when, circumstances indicate that the fair value of our investment could be less than the carrying value. Evidence considered in this evaluation includes, but would not necessarily be limited to, the financial condition and near-term prospects of the investee, recent operating trends and forecasted performance of the investee, market conditions in the geographic area or industry in which the investee operates, and the Company’s strategic plans for holding the investment in relation to the period of time expected for an anticipated recovery of its carrying value. If
30
Table of Contents
the results of our review indicate an other than temporary decline in the carrying value of our investment, the Company would write down the investment to its estimated fair value.
Judgments and uncertainties involved in the estimate
Our impairment evaluations for equity method and cost method investments require us to apply judgment in determining whether a decrease in value that is other than temporary has occurred. If we need to assess the recoverability of our investments, we will make assumptions regarding estimated future cash flows of those investments. These calculations require us to apply judgments, including assumptions of future performance, based on business plans and forecasts, recent economic and business trends, and competitive conditions.
Effect if actual results differ from assumptions
We own a one-third share in Hydrox Holdings Pty Ltd., a joint venture with Woolworths Limited (Woolworths), which operates Masters Home Improvement stores and Home Timber and Hardware Group’s retail stores and wholesale distribution in Australia. As a result of our decision to exit the investment in 2015, Woolworths is required to purchase Lowe’s one-third share of the joint venture at fair value as of January 18, 2016, the date of our notification of our intention to exit. The process for the two parties agreeing on fair value is prescribed in the Joint Venture Agreement.
During the third quarter of fiscal year 2016, Woolworths claimed a unilateral termination of the joint venture agreement, and executed other agreements to initiate the wind down of Hydrox without the Company’s approval as required under the joint venture agreement. Due to this, Lowe’s has concluded that under applicable accounting standards, the investment should be accounted for as a cost method investment going forward. As a result of this determination, accumulated foreign currency translation adjustments of $208 million were reclassified from accumulated other comprehensive loss into the carrying value of the cost method investment. In addition, the unilateral actions of Woolworths to begin the liquidation of Hydrox, represented a triggering event requiring the Company to evaluate the cost method investment for impairment. Management determined that the requirements for determining impairment were met, and leveraged wind down cash flow projections in determining the estimated fair value of the entity. The value was determined using an income approach based upon the expected future cash flows generated from the settlement of assets and liabilities inclusive of inventory, property, payables, lease liabilities and employee entitlements. As a result, the Company recorded a $290 million non-cash impairment charge during the third quarter of fiscal 2016 to reflect its estimated portion of the overall joint venture fair value in wind down. The assumptions that most significantly affect the fair value determination include the projected future cash anticipated in the settlement of assets and liabilities by Woolworths. Further changes in this estimate are possible as the parties proceed through the final stages of the valuation process as defined in the Joint Venture Agreement. The carrying value of the investment as of February 3, 2017 is $103 million. A 10% change in our current estimate of fair value of the joint venture would have affected net earnings by approximately $10 million for 2016.
Long-Lived Asset Impairment
Description
We review the carrying amounts of locations whenever certain events or changes in circumstances indicate that the carrying amounts may not be recoverable. When evaluating locations for impairment, our asset group is at an individual location level, as that is the lowest level for which cash flows are identifiable. Cash flows for individual locations do not include an allocation of corporate overhead.
We evaluate locations for triggering events relating to long-lived asset impairment on a quarterly basis to determine when a location’s asset carrying values may not be recoverable. For operating locations, our primary indicator that asset carrying values may not be recoverable is consistently negative cash flow for a 12-month period for those locations that have been open in the same location for a sufficient period of time to allow for meaningful analysis of ongoing operating results. Management also monitors other factors when evaluating operating locations for impairment, including individual locations’ execution of their operating plans and local market conditions, including incursion, which is the opening of either other Lowe’s locations or those of a direct competitor within the same market. We also consider there to be a triggering event when there is a current expectation that it is more likely than not that a given location will be closed significantly before the end of its previously estimated useful life.
A potential impairment has occurred if projected future undiscounted cash flows expected to result from the use and eventual disposition of the location’s assets are less than the carrying amount of the assets. When determining the stream of projected future cash flows associated with an individual operating location, management makes assumptions, incorporating local market conditions, about key store variables including sales growth rates, gross margin and controllable expenses, such as store payroll and occupancy expense, as well as asset residual values or lease rates. An impairment loss is recognized when the carrying amount of the operating location is not recoverable and exceeds its fair value.
31
Table of Contents
We use an income approach to determine the fair value of our individual operating locations, which requires discounting projected future cash flows. This involves making assumptions regarding both a location’s future cash flows, as described above, and an appropriate discount rate to determine the present value of those future cash flows. We discount our cash flow estimates at a rate commensurate with the risk that selected market participants would assign to the cash flows. The selected market participants represent a group of other retailers with a market footprint similar in size to ours.
Judgments and uncertainties involved in the estimate
Our impairment evaluations for long-lived assets require us to apply judgment in determining whether a triggering event has occurred, including the evaluation of whether it is more likely than not that a location will be closed significantly before the end of its previously estimated useful life. Our impairment loss calculations require us to apply judgment in estimating expected future cash flows, including estimated sales, margin, and controllable expenses, assumptions about market performance for operating locations, and estimated selling prices or lease rates for locations identified for closure. We also apply judgment in estimating asset fair values, including the selection of an appropriate discount rate for fair values determined using an income approach.
Effect if actual results differ from assumptions
During 2016, 14 operating locations experienced a triggering event and were evaluated for recoverability. Eleven of the 14 operating locations were determined to be impaired due to a decline in recent cash flow trends and an unfavorable sales outlook, resulting in an impairment loss of $34 million during 2016, compared to impairment losses of $8 million related to two operating locations impaired during 2015. Three of the 14 operating locations that experienced a triggering event during 2016 were determined to be recoverable and, therefore, were not impaired. A 10% reduction in projected sales used to estimate future cash flows for these operating locations would not have had a significant impact to impairment losses recognized during 2016.
We have not made any material changes in the methodology used to estimate the future cash flows of operating locations or locations identified for closure during the past three fiscal years. If the actual results are not consistent with the assumptions and judgments we have made in determining whether it is more likely than not that a location will be closed significantly before the end of its useful life or in estimating future cash flows and determining asset fair values, our actual impairment losses could vary positively or negatively from our estimated impairment losses.
Goodwill
Description
Goodwill is not amortized but is evaluated for impairment at least annually on the first day of the fourth quarter or whenever events or changes in circumstances indicate that it is more likely than not that the carrying amount may not be recoverable. We test for goodwill impairment at the reporting unit level, which is one level below the operating segment level. The evaluation begins with a qualitative assessment to determine whether a quantitative impairment test is necessary. If, after assessing qualitative factors, we determine it is more likely than not that the fair value of the reporting unit is less than the carrying amount, then the two-step goodwill impairment test is necessary.
The first step of the goodwill impairment test used to identify potential impairment, compares the fair value of a reporting unit with its carrying amount, including goodwill. Fair value represents the price a market participant would be willing to pay in a potential sale of the reporting unit and is based on discounted future cash flows. If the fair value exceeds carrying value, then no goodwill impairment has occurred. If the carrying value of the reporting unit exceeds its fair value, a second step is required to measure possible goodwill impairment loss. The second step includes hypothetically valuing the tangible and intangible assets and liabilities of the reporting unit as if the reporting unit had been acquired in a business combination. Then, the implied fair value of the reporting unit’s goodwill is compared to the carrying value of that goodwill. If the carrying value of the reporting unit’s goodwill exceeds the implied fair value of the goodwill, we recognize an impairment loss in an amount equal to the excess, not to exceed the carrying value.
Judgments and uncertainties involved in the estimate
The determination of the fair value of the reporting units requires us to make significant estimates and assumptions, including store growth rates, existing store sales growth rates, forecasting expenses and selecting appropriate discount rates.
Effect if actual results differ from assumptions
During the third quarter of fiscal year 2016, we determined our Orchard Supply Hardware (Orchard) reporting unit was impaired. We recorded impairment loss related to the Orchard reporting unit of $46 million, which represented the entire amount of goodwill allocated to this reporting unit.
32
Table of Contents
The carrying value of goodwill as of February 3, 2017, was $1.1 billion. We do not believe there is a reasonable likelihood that there will be a material change in the future estimates or assumptions we use to test for impairment losses on goodwill. However, if actual results are not consistent with our estimates or assumptions, we may be exposed to an impairment charge that could be material.
Self-Insurance
Description
We are self-insured for certain losses relating to workers’ compensation, automobile, general and product liability, extended protection plan, and certain medical and dental claims. Our self-insured retention or deductible, as applicable, is limited to $2 million per occurrence involving workers’ compensation, $5 million per occurrence involving general or product liability, and $10 million per occurrence involving automobile. We do not have any insurance coverage for self-insured extended protection plan or medical and dental claims. Self-insurance claims filed and claims incurred but not reported are accrued based upon our estimates of the discounted ultimate cost for self-insured claims incurred using actuarial assumptions followed in the insurance industry and historical experience. During 2016, our self-insurance liability decreased approximately $52 million to $831 million as of February 3, 2017.
Judgments and uncertainties involved in the estimate
These estimates are subject to changes in the regulatory environment, utilized discount rate, projected exposures including payroll, sales and vehicle units, as well as the frequency, lag and severity of claims.
Effect if actual results differ from assumptions
We have not made any material changes in the methodology used to establish our self-insurance liability during the past three fiscal years. Although we believe that we have the ability to reasonably estimate losses related to claims, it is possible that actual results could differ from recorded self-insurance liabilities. A 10% change in our self-insurance liability would have affected net earnings by approximately $51 million for 2016. A 100 basis point change in our discount rate would have affected net earnings by approximately $17 million for 2016.
Revenue Recognition
Description
See Note 1 to the consolidated financial statements for a discussion of our revenue recognition policies. The following accounting estimates relating to revenue recognition require management to make assumptions and apply judgment regarding the effects of future events that cannot be determined with certainty.
We sell separately-priced extended protection plan contracts under a Lowe’s-branded program for which the Company is ultimately self-insured. The Company recognizes revenues from extended protection plan sales on a straight-line basis over the respective contract term. Extended protection plan contract terms primarily range from one to four years from the date of purchase or the end of the manufacturer’s warranty, as applicable. The Company consistently groups and evaluates extended protection plan contracts based on the characteristics of the underlying products and the coverage provided in order to monitor for expected losses. A loss on the overall contract would be recognized if the expected costs of performing services under the contracts exceeded the amount of unamortized acquisition costs and related deferred revenue associated with the contracts. Deferred revenues associated with the extended protection plan contracts increased $34 million to $763 million as of February 3, 2017.
We defer revenue and cost of sales associated with settled transactions for which customers have not yet taken possession of merchandise or for which installation has not yet been completed. Revenue is deferred based on the actual amounts received. We use historical gross margin rates to estimate the adjustment to cost of sales for these transactions. During 2016, deferred revenues associated with these transactions increased $136 million to $755 million as of February 3, 2017.
Judgments and uncertainties involved in the estimate
For extended protection plans, there is judgment inherent in our evaluation of expected losses as a result of our methodology for grouping and evaluating extended protection plan contracts and from the actuarial determination of the estimated cost of the contracts. There is also judgment inherent in our determination of the recognition pattern of costs of performing services under these contracts.
33
Table of Contents
For the deferral of revenue and cost of sales associated with transactions for which customers have not yet taken possession of merchandise or for which installation has not yet been completed, there is judgment inherent in our estimates of gross margin rates.
Effect if actual results differ from assumptions
We have not made any material changes in the methodology used to recognize revenue on our extended protection plan contracts during the past three fiscal years. We currently do not anticipate incurring any overall contract losses on our extended protection plan contracts. Although we believe that we have the ability to adequately monitor and estimate expected losses under the extended protection plan contracts, it is possible that actual results could differ from our estimates. In addition, if future evidence indicates that the costs of performing services under these contracts are incurred on other than a straight-line basis, the timing of revenue recognition under these contracts could change. A 10% change in the amount of revenue recognized in 2016 under these contracts would have affected net earnings by approximately $22 million.
We have not made any material changes in the methodology used to reverse net sales and cost of sales related to amounts received for which customers have not yet taken possession of merchandise or for which installation has not yet been completed. We believe we have sufficient current and historical knowledge to record reasonable estimates related to the impact to cost of sales for these transactions. However, if actual results are not consistent with our estimates or assumptions, we may incur additional income or expense. A 10% change in the estimate of the gross margin rates applied to these transactions would have affected net earnings by approximately $11 million in 2016.
DISCLOSURE REGARDING FORWARD-LOOKING STATEMENTS
We speak throughout this Annual Report in forward-looking statements about our future, but particularly in “Management’s Discussion and Analysis of Financial Condition and Results of Operations”. The words “believe,” “expect,” “will,” “should,” “suggest”, and other similar expressions are intended to identify those forward-looking statements. While we believe our expectations are reasonable, they are not guarantees of future performance. Our actual results could differ substantially from our expectations.
For a detailed description of the risks and uncertainties that we are exposed to, you should read the “Risk Factors” included elsewhere in this Annual Report. All forward-looking statements speak only as of the date of this Annual Report or, in the case of any document incorporated by reference, the date of that document. All subsequent written and oral forward-looking statements attributable to us or any person acting on our behalf are qualified by the cautionary statements in this section and in the “Risk Factors” included elsewhere in this Annual Report. We do not undertake any obligation to update or publicly release any revisions to forward-looking statements to reflect events, circumstances or changes in expectations after the date of this report.
Item 7A - Quantitative and Qualitative Disclosures about Market Risk
In addition to the risks inherent in our operations, we are exposed to certain market risks, including changes in interest rates, commodity prices and foreign currency exchange rates.
Interest Rate Risk
Fluctuations in interest rates do not have a material impact on our financial condition and results of operations because our long-term debt is carried at amortized cost and consists primarily of fixed-rate instruments. Therefore, providing quantitative information about interest rate risk is not meaningful for our financial instruments.
Commodity Price Risk
We purchase certain commodity products that are subject to price volatility caused by factors beyond our control. We believe that the price volatility of these products is partially mitigated by our ability to adjust selling prices. The selling prices of these commodity products are influenced, in part, by the market price we pay, which is determined by industry supply and demand.
Foreign Currency Exchange Rate Risk
Historically, our exposure to foreign currency exchange rate fluctuations on the translation of our international operations into U.S. dollars has not been material to our financial condition and results of operations. We will be further exposed to this risk as we increase operations in Canada following the acquisition of RONA. To manage the foreign currency exchange rate risk on the consideration to be paid for the RONA acquisition, the Company entered into a foreign currency exchange option during
34
Table of Contents
the first quarter of fiscal 2016 to purchase 3.2 billion Canadian dollars at a strike price of 1.3933. In the second quarter of fiscal 2016, the option contract was settled. The net gain of $76 million was included in the accompanying consolidated statements of current and retained earnings.
35
Table of Contents
Item 8 - Financial Statements and Supplementary Data
MANAGEMENT’S REPORT ON INTERNAL CONTROL OVER FINANCIAL REPORTING
Management of Lowe’s Companies, Inc. and its subsidiaries is responsible for establishing and maintaining adequate internal control over financial reporting (Internal Control) as defined in Rule 13a-15(f) under the Securities Exchange Act of 1934, as amended. Our Internal Control was designed to provide reasonable assurance to our management and the Board of Directors regarding the reliability of financial reporting and the preparation and fair presentation of published financial statements.
All internal control systems, no matter how well designed, have inherent limitations, including the possibility of human error and the circumvention or overriding of controls. Therefore, even those systems determined to be effective can provide only reasonable assurance with respect to the reliability of financial reporting and financial statement preparation and presentation. Further, because of changes in conditions, the effectiveness may vary over time.
Our management, with the participation of the Chief Executive Officer and Chief Financial Officer, evaluated the effectiveness of our Internal Control as of February 3, 2017. In evaluating our Internal Control, we used the criteria set forth by the Committee of Sponsoring Organizations of the Treadway Commission (COSO) in Internal Control—Integrated Framework (2013). Based on our management’s assessment, we have concluded that, as of February 3, 2017, our Internal Control is effective.
Under guidelines established by the SEC, companies are permitted to exclude acquisitions from their first assessment of internal control over financial reporting following the date of acquisition. Management’s assessment of the effectiveness of the Company’s internal control over financial reporting excluded RONA inc. (RONA), a wholly owned subsidiary of Lowe’s Companies Inc. that consisted of the net assets purchased from RONA in May 2016. RONA represented 8.9% and 3.4% of the Company’s consolidated total assets and consolidated net sales, respectively, as of and for the year ended February 3, 2017. This acquisition is more fully discussed in Note 2 to our Consolidated Financial Statements for fiscal year 2016.
Deloitte & Touche LLP, the independent registered public accounting firm that audited the financial statements contained in this Annual Report, was engaged to audit our Internal Control. Their report appears on page 38.
36
Table of Contents
REPORT OF INDEPENDENT REGISTERED PUBLIC ACCOUNTING FIRM
To the Board of Directors and Shareholders of Lowe’s Companies, Inc.
Mooresville, North Carolina
We have audited the accompanying consolidated balance sheets of Lowe’s Companies, Inc. and subsidiaries (the “Company”) as of February 3, 2017 and January 29, 2016, and the related consolidated statements of earnings, comprehensive income, shareholders’ equity, and cash flows for each of the three fiscal years in the period ended February 3, 2017. Our audits also included the financial statement schedule listed in the Index at Item 15. These financial statements and financial statement schedule are the responsibility of the Company’s management. Our responsibility is to express an opinion on the financial statements and financial statement schedule based on our audits.
We conducted our audits in accordance with the standards of the Public Company Accounting Oversight Board (United States). Those standards require that we plan and perform the audit to obtain reasonable assurance about whether the financial statements are free of material misstatement. An audit includes examining, on a test basis, evidence supporting the amounts and disclosures in the financial statements. An audit also includes assessing the accounting principles used and significant estimates made by management, as well as evaluating the overall financial statement presentation. We believe that our audits provide a reasonable basis for our opinion.
In our opinion, such consolidated financial statements present fairly, in all material respects, the financial position of the Company at February 3, 2017 and January 29, 2016, and the results of its operations and its cash flows for each of the three fiscal years in the period ended February 3, 2017, in conformity with accounting principles generally accepted in the United States of America. Also, in our opinion, such financial statement schedule, when considered in relation to the basic consolidated financial statements taken as a whole, presents fairly, in all material respects, the information set forth therein.
We have also audited, in accordance with the standards of the Public Company Accounting Oversight Board (United States), the Company’s internal control over financial reporting as of February 3, 2017, based on the criteria established in Internal Control—Integrated Framework (2013) issued by the Committee of Sponsoring Organizations of the Treadway Commission and our report dated April 3, 2017 expressed an unqualified opinion on the Company’s internal control over financial reporting.
/s/ DELOITTE & TOUCHE LLP
Charlotte, North Carolina
April 3, 2017
37
Table of Contents
REPORT OF INDEPENDENT REGISTERED PUBLIC ACCOUNTING FIRM
To the Board of Directors and Shareholders of Lowe’s Companies, Inc.
Mooresville, North Carolina
We have audited the internal control over financial reporting of Lowe’s Companies, Inc. and subsidiaries (the “Company”) as of February 3, 2017, based on criteria established in Internal Control - Integrated Framework (2013) issued by the Committee of Sponsoring Organizations of the Treadway Commission. As described in Management’s Report on Internal Control over Financial Reporting, management excluded from its assessment the internal control over financial reporting at RONA Inc. (“RONA”), which was acquired on May 20, 2016 and whose financial statements constitute 8.9% and 3.4% of the Company’s consolidated total assets and consolidated net sales, respectively, as of and for the fiscal year ended February 3, 2017. Accordingly, our audit did not include the internal control over financial reporting at RONA. The Company’s management is responsible for maintaining effective internal control over financial reporting and for its assessment of the effectiveness of internal control over financial reporting, included in the accompanying Management’s Report on Internal Control over Financial Reporting. Our responsibility is to express an opinion on the Company’s internal control over financial reporting based on our audit.
We conducted our audit in accordance with the standards of the Public Company Accounting Oversight Board (United States). Those standards require that we plan and perform the audit to obtain reasonable assurance about whether effective internal control over financial reporting was maintained in all material respects. Our audit included obtaining an understanding of internal control over financial reporting, assessing the risk that a material weakness exists, testing and evaluating the design and operating effectiveness of internal control based on the assessed risk, and performing such other procedures as we considered necessary in the circumstances. We believe that our audit provides a reasonable basis for our opinion.
A company’s internal control over financial reporting is a process designed by, or under the supervision of, the company’s principal executive and principal financial officers, or persons performing similar functions, and effected by the company’s board of directors, management, and other personnel to provide reasonable assurance regarding the reliability of financial reporting and the preparation of financial statements for external purposes in accordance with generally accepted accounting principles. A company’s internal control over financial reporting includes those policies and procedures that (1) pertain to the maintenance of records that, in reasonable detail, accurately and fairly reflect the transactions and dispositions of the assets of the company; (2) provide reasonable assurance that transactions are recorded as necessary to permit preparation of financial statements in accordance with generally accepted accounting principles, and that receipts and expenditures of the company are being made only in accordance with authorizations of management and directors of the company; and (3) provide reasonable assurance regarding prevention or timely detection of unauthorized acquisition, use, or disposition of the company’s assets that could have a material effect on the financial statements.
Because of the inherent limitations of internal control over financial reporting, including the possibility of collusion or improper management override of controls, material misstatements due to error or fraud may not be prevented or detected on a timely basis. Also, projections of any evaluation of the effectiveness of the internal control over financial reporting to future periods are subject to the risk that the controls may become inadequate because of changes in conditions, or that the degree of compliance with the policies or procedures may deteriorate.
In our opinion, the Company maintained, in all material respects, effective internal control over financial reporting as of February 3, 2017, based on the criteria established in Internal Control - Integrated Framework (2013) issued by the Committee of Sponsoring Organizations of the Treadway Commission.
We have also audited, in accordance with the standards of the Public Company Accounting Oversight Board (United States), the consolidated financial statements and financial statement schedule as of and for the fiscal year ended February 3, 2017 of the Company and our report dated April 3, 2017 expressed an unqualified opinion on those financial statements and financial statement schedule.
/s/ DELOITTE & TOUCHE LLP
Charlotte, North Carolina
April 3, 2017
38
Table of Contents
Lowe’s Companies, Inc.
Consolidated Statements of Earnings
(In millions, except per share and percentage data)
|
| ||||||||||||||||||||||||||||||||||||
|
|
|
|
|
|
|
|
|
|
|
|
|
|
|
|
|
|
|
|
|
| ||||||||||||||||
|
| February 3, 2017 |
|
| % Sales |
|
| January 29, 2016 |
|
| % Sales |
|
| January 30, 2015 |
|
| % Sales |
| |||||||||||||||||||
| Fiscal years ended on | ||||||||||||||||||||||||||||||||||||
| Net sales | $ | 65,017 |
|
| 100.00 | % |
| $ | 59,074 |
|
| 100.00 | % |
| $ | 56,223 |
|
| 100.00 | % | ||||||||||||||||
| Cost of sales | 42,553 |
|
| 65.45 |
|
| 38,504 |
|
| 65.18 |
|
| 36,665 |
|
| 65.21 |
| |||||||||||||||||||
| Gross margin | 22,464 |
|
| 34.55 |
|
| 20,570 |
|
| 34.82 |
|
| 19,558 |
|
| 34.79 |
| |||||||||||||||||||
| Expenses: |
|
|
|
|
|
|
|
|
|
|
| |||||||||||||||||||||||||
| Selling, general and administrative | 15,129 |
|
| 23.27 |
|
| 14,105 |
|
| 23.88 |
|
| 13,272 |
|
| 23.60 |
| |||||||||||||||||||
| Depreciation and amortization | 1,489 |
|
| 2.29 |
|
| 1,494 |
|
| 2.53 |
|
| 1,494 |
|
| 2.66 |
| |||||||||||||||||||
| Operating income | 5,846 |
|
| 8.99 |
|
| 4,971 |
|
| 8.41 |
|
| 4,792 |
|
| 8.53 |
| |||||||||||||||||||
| Interest - net | 645 |
|
| 0.99 |
|
| 552 |
|
| 0.93 |
|
| 516 |
|
| 0.92 |
| |||||||||||||||||||
| Pre-tax earnings | 5,201 |
|
| 8.00 |
|
| 4,419 |
|
| 7.48 |
|
| 4,276 |
|
| 7.61 |
| |||||||||||||||||||
| Income tax provision | 2,108 |
|
| 3.24 |
|
| 1,873 |
|
| 3.17 |
|
| 1,578 |
|
| 2.81 |
| |||||||||||||||||||
| Net earnings | $ | 3,093 |
|
| 4.76 | % |
| $ | 2,546 |
|
| 4.31 | % |
| $ | 2,698 |
|
| 4.80 | % | ||||||||||||||||
|
|
|
|
|
|
|
|
|
|
|
|
| |||||||||||||||||||||||||
|
|
|
|
|
|
|
|
|
|
|
|
| |||||||||||||||||||||||||
| Basic earnings per common share | $ | 3.48 |
|
|
|
| $ | 2.73 |
|
|
|
| $ | 2.71 |
|
|
| |||||||||||||||||||
| Diluted earnings per common share | $ | 3.47 |
|
|
|
| $ | 2.73 |
|
|
|
| $ | 2.71 |
|
|
| |||||||||||||||||||
| Cash dividends per share | $ | 1.33 |
|
|
|
| $ | 1.07 |
|
|
|
| $ | 0.87 |
|
|
| |||||||||||||||||||
|
|
|
|
|
|
|
|
|
|
|
|
| |||||||||||||||||||||||||
Lowe’s Companies, Inc.
Consolidated Statements of Comprehensive Income
(In millions, except percentage data)
|
|
| ||||||||||||||||||||||||||||||||||||||||||||||||||||
|
|
|
|
|
|
|
|
|
|
|
|
|
|
|
|
|
|
|
|
|
|
| ||||||||||||||||||||||||||||||||
|
| February 3, 2017 |
|
| % Sales |
|
| January 29, 2016 |
|
| % Sales |
|
| January 30, 2015 |
|
| % Sales |
|
| |||||||||||||||||||||||||||||||||||
| Fiscal years ended on |
|
|
|
| |||||||||||||||||||||||||||||||||||||||||||||||||
| Net earnings | $ | 3,093 |
|
| 4.76 | % |
| $ | 2,546 |
|
| 4.31 | % |
| $ | 2,698 |
|
| 4.80 | % |
|
| |||||||||||||||||||||||||||||||
| Foreign currency translation adjustments - net of tax | 154 |
|
| 0.23 |
|
| (291 | ) |
| (0.49 | ) |
| (86 | ) |
| (0.15 | ) |
|
| ||||||||||||||||||||||||||||||||||
| Other comprehensive income/(loss) | 154 |
|
| 0.23 |
|
| (291 | ) |
| (0.49 | ) |
| (86 | ) |
| (0.15 | ) |
|
| ||||||||||||||||||||||||||||||||||
| Comprehensive income | $ | 3,247 |
|
| 4.99 | % |
| $ | 2,255 |
|
| 3.82 | % |
| $ | 2,612 |
|
| 4.65 | % |
|
| |||||||||||||||||||||||||||||||
|
|
|
|
|
|
|
|
|
|
|
|
|
|
| ||||||||||||||||||||||||||||||||||||||||
See accompanying notes to consolidated financial statements.
39
Table of Contents
Lowe’s Companies, Inc.
Consolidated Balance Sheets
(In millions, except par value and percentage data)
|
| ||||||||||||||||||||||||||
|
|
|
|
|
|
|
|
|
|
|
|
|
|
|
|
| |||||||||||
|
|
|
| February 3, 2017 |
|
| % Total |
|
| January 29, 2016 |
|
| % Total |
| |||||||||||||
|
| ||||||||||||||||||||||||||
| Assets |
|
|
|
|
|
|
|
|
| |||||||||||||||||
| Current assets: |
|
|
|
|
|
|
|
|
| |||||||||||||||||
| Cash and cash equivalents |
|
| $ | 558 |
|
| 1.6 | % |
| $ | 405 |
|
| 1.3 | % | |||||||||||
| Short-term investments |
|
| 100 |
|
| 0.3 |
|
| 307 |
|
| 1.0 |
| |||||||||||||
| Merchandise inventory - net |
|
| 10,458 |
|
| 30.4 |
|
| 9,458 |
|
| 30.3 |
| |||||||||||||
| Other current assets |
|
| 884 |
|
| 2.6 |
|
| 391 |
|
| 1.3 |
| |||||||||||||
| Total current assets |
|
| 12,000 |
|
| 34.9 |
|
| 10,561 |
|
| 33.9 |
| |||||||||||||
| Property, less accumulated depreciation |
|
| 19,949 |
|
| 58.0 |
|
| 19,577 |
|
| 62.6 |
| |||||||||||||
| Long-term investments |
|
| 366 |
|
| 1.1 |
|
| 222 |
|
| 0.7 |
| |||||||||||||
| Deferred income taxes - net |
|
| 222 |
|
| 0.6 |
|
| 241 |
|
| 0.8 |
| |||||||||||||
| Goodwill |
|
| 1,082 |
|
| 3.1 |
|
| 154 |
|
| 0.5 |
| |||||||||||||
| Other assets |
|
| 789 |
|
| 2.3 |
|
| 511 |
|
| 1.5 |
| |||||||||||||
| Total assets |
|
| $ | 34,408 |
|
| 100.0 | % |
| $ | 31,266 |
|
| 100.0 | % | |||||||||||
|
|
|
|
|
|
|
|
|
|
| |||||||||||||||||
| Liabilities and shareholders’ equity |
|
|
|
|
|
|
|
|
| |||||||||||||||||
| Current liabilities: |
|
|
|
|
|
|
|
|
| |||||||||||||||||
| Short-term borrowings |
|
| $ | 510 |
|
| 1.5 | % |
| $ | 43 |
|
| 0.1 | % | |||||||||||
| Current maturities of long-term debt |
|
| 795 |
|
| 2.3 |
|
| 1,061 |
|
| 3.4 |
| |||||||||||||
| Accounts payable |
|
| 6,651 |
|
| 19.3 |
|
| 5,633 |
|
| 18.0 |
| |||||||||||||
| Accrued compensation and employee benefits |
|
| 790 |
|
| 2.3 |
|
| 820 |
|
| 2.6 |
| |||||||||||||
| Deferred revenue |
|
| 1,253 |
|
| 3.6 |
|
| 1,078 |
|
| 3.4 |
| |||||||||||||
| Other current liabilities |
|
| 1,975 |
|
| 5.7 |
|
| 1,857 |
|
| 6.1 |
| |||||||||||||
| Total current liabilities |
|
| 11,974 |
|
| 34.7 |
|
| 10,492 |
|
| 33.6 |
| |||||||||||||
| Long-term debt, excluding current maturities |
|
| 14,394 |
|
| 41.8 |
|
| 11,545 |
|
| 36.9 |
| |||||||||||||
| Deferred revenue - extended protection plans |
|
| 763 |
|
| 2.2 |
|
| 729 |
|
| 2.3 |
| |||||||||||||
| Other liabilities |
|
| 843 |
|
| 2.6 |
|
| 846 |
|
| 2.7 |
| |||||||||||||
| Total liabilities |
|
| 27,974 |
|
| 81.3 |
|
| 23,612 |
|
| 75.5 |
| |||||||||||||
|
|
|
|
|
|
|
|
|
|
| |||||||||||||||||
| Commitments and contingencies |
|
|
|
|
|
|
|
|
| |||||||||||||||||
|
|
|
|
|
|
|
|
|
|
| |||||||||||||||||
| Shareholders’ equity: |
|
|
|
|
|
|
|
|
| |||||||||||||||||
| Preferred stock - $5 par value, none issued |
|
| — |
|
| — |
|
| — |
|
| — |
| |||||||||||||
| Common stock - $.50 par value; |
|
|
|
|
|
|
|
|
|
|
| |||||||||||||||
| Shares issued and outstanding |
|
|
|
|
|
|
|
|
| |||||||||||||||||
| February 3, 2017 | 866 |
|
|
|
|
|
|
|
| |||||||||||||||||
| January 29, 2016 | 910 |
| 433 |
|
| 1.3 |
|
| 455 |
|
| 1.5 |
| |||||||||||||
| Capital in excess of par value |
|
| — |
|
| — |
|
| — |
|
| — |
| |||||||||||||
| Retained earnings |
|
| 6,241 |
|
| 18.1 |
|
| 7,593 |
|
| 24.3 |
| |||||||||||||
| Accumulated other comprehensive loss |
|
| (240 | ) |
| (0.7 | ) |
| (394 | ) |
| (1.3 | ) | |||||||||||||
| Total shareholders’ equity |
|
| 6,434 |
|
| 18.7 |
|
| 7,654 |
|
| 24.5 |
| |||||||||||||
| Total liabilities and shareholders’ equity |
|
| $ | 34,408 |
|
| 100.0 | % |
| $ | 31,266 |
|
| 100.0 | % | |||||||||||
See accompanying notes to consolidated financial statements.
40
Table of Contents
Lowe’s Companies, Inc.
Consolidated Statements of Shareholders’ Equity
(In millions)
|
|
| |||||||||||||||||||||||||||||||||||||||||||||||||||||||||||||||||||||||||||||||||||||||||||||||||||||||||||||||||||||||||||||||||||||||||||||||||||||||||||||||||||||||||||||||||||||||
|
|
|
|
|
|
|
|
|
|
|
|
|
|
|
|
|
|
|
|
|
|
|
|
|
|
|
|
|
|
|
|
| |||||||||||||||||||||||||||||||||||||||||||||||||||||||||||||||||||||||||||||||||||||||||||||||||||||||||||||||||||||||||||||||||||||||||||||||||||||||||
|
| Common Stock |
| Capital in Excess of Par Value |
|
| Retained Earnings |
|
| Accumulated Other Comprehensive Income/(Loss) |
|
| Total Lowe’s Companies, Inc. Shareholders’ Equity |
|
| Noncontrolling Interest |
|
| Total Equity |
|
| ||||||||||||||||||||||||||||||||||||||||||||||||||||||||||||||||||||||||||||||||||||||||||||||||||||||||||||||||||||||||||||||||||||||||||||||||||||||||||||||||||||
|
| Shares |
|
| Amount |
|
|
|
|
|
|
|
|
|
|
|
|
|
|
|
|
|
|
|
|
|
|
| |||||||||||||||||||||||||||||||||||||||||||||||||||||||||||||||||||||||||||||||||||||||||||||||||||||||||||||||||||||||||||||||||||||||||||||||||||||||||||||
| Balance January 31, 2014 | 1,030 |
|
| $ | 515 |
|
| $ | — |
|
| $ | 11,355 |
|
| $ | (17 | ) |
| $ | 11,853 |
|
| $ | — |
|
| $ | 11,853 |
|
|
|
|
| ||||||||||||||||||||||||||||||||||||||||||||||||||||||||||||||||||||||||||||||||||||||||||||||||||||||||||||||||||||||||||||||||||||||||||||||||||||||
| Net earnings |
|
|
|
|
|
| 2,698 |
|
|
|
| 2,698 |
|
|
|
| 2,698 |
|
|
|
|
| ||||||||||||||||||||||||||||||||||||||||||||||||||||||||||||||||||||||||||||||||||||||||||||||||||||||||||||||||||||||||||||||||||||||||||||||||||||||||||||||||||
| Other comprehensive loss |
|
|
|
|
|
|
|
| (86 | ) |
| (86 | ) |
|
|
| (86 | ) |
|
|
|
| ||||||||||||||||||||||||||||||||||||||||||||||||||||||||||||||||||||||||||||||||||||||||||||||||||||||||||||||||||||||||||||||||||||||||||||||||||||||||||||||||||
| Tax effect of non-qualified stock options exercised and restricted stock vested |
|
|
|
| 41 |
|
|
|
|
|
| 41 |
|
|
|
| 41 |
|
|
|
|
| ||||||||||||||||||||||||||||||||||||||||||||||||||||||||||||||||||||||||||||||||||||||||||||||||||||||||||||||||||||||||||||||||||||||||||||||||||||||||||||||||||
| Cash dividends declared, $0.87 per share |
|
|
|
|
|
| (858 | ) |
|
|
| (858 | ) |
|
|
| (858 | ) |
|
|
|
| ||||||||||||||||||||||||||||||||||||||||||||||||||||||||||||||||||||||||||||||||||||||||||||||||||||||||||||||||||||||||||||||||||||||||||||||||||||||||||||||||||
| Share-based payment expense |
|
|
|
| 111 |
|
|
|
|
|
| 111 |
|
|
|
| 111 |
|
|
|
|
| ||||||||||||||||||||||||||||||||||||||||||||||||||||||||||||||||||||||||||||||||||||||||||||||||||||||||||||||||||||||||||||||||||||||||||||||||||||||||||||||||||
| Repurchase of common stock | (75 | ) |
| (37 | ) |
| (286 | ) |
| (3,604 | ) |
|
|
| (3,927 | ) |
|
|
| (3,927 | ) |
|
|
|
| |||||||||||||||||||||||||||||||||||||||||||||||||||||||||||||||||||||||||||||||||||||||||||||||||||||||||||||||||||||||||||||||||||||||||||||||||||||||||||||||
| Issuance of common stock under share-based payment plans | 5 |
|
| 2 |
|
| 134 |
|
|
|
|
|
| 136 |
|
|
|
| 136 |
|
|
|
|
| ||||||||||||||||||||||||||||||||||||||||||||||||||||||||||||||||||||||||||||||||||||||||||||||||||||||||||||||||||||||||||||||||||||||||||||||||||||||||||||||||
| Balance January 30, 2015 | 960 |
|
| $ | 480 |
|
| $ | — |
|
| $ | 9,591 |
|
| $ | (103 | ) |
| $ | 9,968 |
|
| $ | — |
|
| $ | 9,968 |
|
|
|
|
| ||||||||||||||||||||||||||||||||||||||||||||||||||||||||||||||||||||||||||||||||||||||||||||||||||||||||||||||||||||||||||||||||||||||||||||||||||||||
| Net earnings |
|
|
|
|
|
| 2,546 |
|
|
|
| 2,546 |
|
|
|
| 2,546 |
|
|
|
|
| ||||||||||||||||||||||||||||||||||||||||||||||||||||||||||||||||||||||||||||||||||||||||||||||||||||||||||||||||||||||||||||||||||||||||||||||||||||||||||||||||||
| Other comprehensive loss |
|
|
|
|
|
|
|
| (291 | ) |
| (291 | ) |
|
|
| (291 | ) |
|
|
|
| ||||||||||||||||||||||||||||||||||||||||||||||||||||||||||||||||||||||||||||||||||||||||||||||||||||||||||||||||||||||||||||||||||||||||||||||||||||||||||||||||||
| Tax effect of non-qualified stock options exercised and restricted stock vested |
|
|
|
| 61 |
|
|
|
|
|
| 61 |
|
|
|
| 61 |
|
|
|
|
| ||||||||||||||||||||||||||||||||||||||||||||||||||||||||||||||||||||||||||||||||||||||||||||||||||||||||||||||||||||||||||||||||||||||||||||||||||||||||||||||||||
| Cash dividends declared, $1.07 per share |
|
|
|
|
|
| (991 | ) |
|
|
| (991 | ) |
|
|
| (991 | ) |
|
|
|
| ||||||||||||||||||||||||||||||||||||||||||||||||||||||||||||||||||||||||||||||||||||||||||||||||||||||||||||||||||||||||||||||||||||||||||||||||||||||||||||||||||
| Share-based payment expense |
|
|
|
| 112 |
|
|
|
|
|
| 112 |
|
|
|
| 112 |
|
|
|
|
| ||||||||||||||||||||||||||||||||||||||||||||||||||||||||||||||||||||||||||||||||||||||||||||||||||||||||||||||||||||||||||||||||||||||||||||||||||||||||||||||||||
| Repurchase of common stock | (54 | ) |
| (27 | ) |
| (298 | ) |
| (3,553 | ) |
|
|
| (3,878 | ) |
|
|
| (3,878 | ) |
|
|
|
| |||||||||||||||||||||||||||||||||||||||||||||||||||||||||||||||||||||||||||||||||||||||||||||||||||||||||||||||||||||||||||||||||||||||||||||||||||||||||||||||
| Issuance of common stock under share-based payment plans | 4 |
|
| 2 |
|
| 125 |
|
|
|
|
|
| 127 |
|
|
|
| 127 |
|
|
|
|
| ||||||||||||||||||||||||||||||||||||||||||||||||||||||||||||||||||||||||||||||||||||||||||||||||||||||||||||||||||||||||||||||||||||||||||||||||||||||||||||||||
| Balance January 29, 2016 | 910 |
|
| $ | 455 |
|
| $ | — |
|
| $ | 7,593 |
|
| $ | (394 | ) |
| $ | 7,654 |
|
| $ | — |
|
| 7,654 |
|
|
|
|
| |||||||||||||||||||||||||||||||||||||||||||||||||||||||||||||||||||||||||||||||||||||||||||||||||||||||||||||||||||||||||||||||||||||||||||||||||||||||
| Net earnings |
|
|
|
|
|
| 3,091 |
|
|
|
| 3,091 |
|
| 2 |
|
| 3,093 |
|
|
|
|
| |||||||||||||||||||||||||||||||||||||||||||||||||||||||||||||||||||||||||||||||||||||||||||||||||||||||||||||||||||||||||||||||||||||||||||||||||||||||||||||||||
| Other comprehensive income |
|
|
|
|
|
|
|
| 154 |
|
| 154 |
|
|
|
| 154 |
|
|
|
|
| ||||||||||||||||||||||||||||||||||||||||||||||||||||||||||||||||||||||||||||||||||||||||||||||||||||||||||||||||||||||||||||||||||||||||||||||||||||||||||||||||||
| Tax effect of non-qualified stock options exercised and restricted stock vested |
|
|
|
| 57 |
|
|
|
|
|
| 57 |
|
|
|
| 57 |
|
|
|
|
| ||||||||||||||||||||||||||||||||||||||||||||||||||||||||||||||||||||||||||||||||||||||||||||||||||||||||||||||||||||||||||||||||||||||||||||||||||||||||||||||||||
| Cash dividends declared, $1.33 per share |
|
|
|
|
|
| (1,169 | ) |
|
|
| (1,169 | ) |
|
|
| (1,169 | ) |
|
|
|
| ||||||||||||||||||||||||||||||||||||||||||||||||||||||||||||||||||||||||||||||||||||||||||||||||||||||||||||||||||||||||||||||||||||||||||||||||||||||||||||||||||
| Share-based payment expense |
|
|
|
| 104 |
|
|
|
|
|
| 104 |
|
|
|
| 104 |
|
|
|
|
| ||||||||||||||||||||||||||||||||||||||||||||||||||||||||||||||||||||||||||||||||||||||||||||||||||||||||||||||||||||||||||||||||||||||||||||||||||||||||||||||||||
| Repurchase of common stock | (48 | ) |
| (24 | ) |
| (279 | ) |
| (3,274 | ) |
|
|
| (3,577 | ) |
|
|
| (3,577 | ) |
|
|
|
| |||||||||||||||||||||||||||||||||||||||||||||||||||||||||||||||||||||||||||||||||||||||||||||||||||||||||||||||||||||||||||||||||||||||||||||||||||||||||||||||
| Issuance of common stock under share-based payment plans | 4 |
|
| 2 |
|
| 136 |
|
|
|
|
|
| 138 |
|
|
|
| 138 |
|
|
|
|
| ||||||||||||||||||||||||||||||||||||||||||||||||||||||||||||||||||||||||||||||||||||||||||||||||||||||||||||||||||||||||||||||||||||||||||||||||||||||||||||||||
| Noncontrolling interest resulting from acquisition |
|
|
|
|
|
|
|
|
|
| — |
|
| 109 |
|
| 109 |
|
|
|
|
| ||||||||||||||||||||||||||||||||||||||||||||||||||||||||||||||||||||||||||||||||||||||||||||||||||||||||||||||||||||||||||||||||||||||||||||||||||||||||||||||||||
| Dividends paid to noncontrolling interest holders |
|
|
|
|
|
|
|
|
|
| — |
|
| (2 | ) |
| (2 | ) |
|
|
|
| ||||||||||||||||||||||||||||||||||||||||||||||||||||||||||||||||||||||||||||||||||||||||||||||||||||||||||||||||||||||||||||||||||||||||||||||||||||||||||||||||||
| Purchase of noncontrolling interest |
|
|
|
| (18 | ) |
|
|
|
|
| (18 | ) |
| (109 | ) |
| (127 | ) |
|
|
|
| |||||||||||||||||||||||||||||||||||||||||||||||||||||||||||||||||||||||||||||||||||||||||||||||||||||||||||||||||||||||||||||||||||||||||||||||||||||||||||||||||
| Balance February 3, 2017 | 866 |
|
| $ | 433 |
|
| $ | — |
|
| $ | 6,241 |
|
| $ | (240 | ) |
| $ | 6,434 |
|
| $ | — |
|
| $ | 6,434 |
|
|
|
|
| ||||||||||||||||||||||||||||||||||||||||||||||||||||||||||||||||||||||||||||||||||||||||||||||||||||||||||||||||||||||||||||||||||||||||||||||||||||||
See accompanying notes to consolidated financial statements.
41
Table of Contents
Lowe’s Companies, Inc.
Consolidated Statements of Cash Flows
(In millions)
|
| |||||||||||||
|
|
|
|
|
|
|
|
|
|
|
|
| ||
|
| February 3, 2017 |
|
| January 29, 2016 |
|
| January 30, 2015 |
| |||||
| Fiscal years ended on | |||||||||||||
| Cash flows from operating activities: |
|
|
|
|
| ||||||||
| Net earnings | $ | 3,093 |
|
| $ | 2,546 |
|
| $ | 2,698 |
| ||
| Adjustments to reconcile net earnings to net cash provided by operating activities: |
|
|
|
|
| ||||||||
| Depreciation and amortization | 1,590 |
|
| 1,587 |
|
| 1,586 |
| |||||
| Deferred income taxes | 28 |
|
| (68 | ) |
| (124 | ) | |||||
| Loss on property and other assets – net | 143 |
|
| 30 |
|
| 25 |
| |||||
| Loss on cost method and equity method investments | 302 |
|
| 594 |
|
| 57 |
| |||||
| Share-based payment expense | 90 |
|
| 117 |
|
| 119 |
| |||||
| Changes in operating assets and liabilities: |
|
|
|
|
| ||||||||
| Merchandise inventory – net | (178 | ) |
| (582 | ) |
| 170 |
| |||||
| Other operating assets | (183 | ) |
| (34 | ) |
| 83 |
| |||||
| Accounts payable | 653 |
|
| 524 |
|
| 127 |
| |||||
| Other operating liabilities | 79 |
|
| 70 |
|
| 188 |
| |||||
| Net cash provided by operating activities | 5,617 |
|
| 4,784 |
|
| 4,929 |
| |||||
|
|
|
|
|
|
| ||||||||
| Cash flows from investing activities: |
|
|
|
|
| ||||||||
| Purchases of investments | (1,192 | ) |
| (934 | ) |
| (820 | ) | |||||
| Proceeds from sale/maturity of investments | 1,254 |
|
| 884 |
|
| 805 |
| |||||
| Capital expenditures | (1,167 | ) |
| (1,197 | ) |
| (880 | ) | |||||
| Contributions to equity method investments – net | — |
|
| (125 | ) |
| (241 | ) | |||||
| Proceeds from sale of property and other long-term assets | 37 |
|
| 57 |
|
| 52 |
| |||||
| Purchases of derivative instruments | (103 | ) |
| — |
|
| — |
| |||||
| Proceeds from settlement of derivative instruments | 179 |
|
| — |
|
| — |
| |||||
| Acquisition of business - net | (2,356 | ) |
| — |
|
| — |
| |||||
| Other – net | (13 | ) |
| (28 | ) |
| (4 | ) | |||||
| Net cash used in investing activities | (3,361 | ) |
| (1,343 | ) |
| (1,088 | ) | |||||
|
|
|
|
|
|
| ||||||||
| Cash flows from financing activities: |
|
|
|
|
| ||||||||
| Net change in short-term borrowings | 466 |
|
| 43 |
|
| (386 | ) | |||||
| Net proceeds from issuance of long-term debt | 3,267 |
|
| 1,718 |
|
| 1,239 |
| |||||
| Repayment of long-term debt | (1,173 | ) |
| (552 | ) |
| (48 | ) | |||||
| Proceeds from issuance of common stock under share-based payment plans | 139 |
|
| 125 |
|
| 137 |
| |||||
| Cash dividend payments | (1,121 | ) |
| (957 | ) |
| (822 | ) | |||||
| Repurchase of common stock | (3,595 | ) |
| (3,925 | ) |
| (3,905 | ) | |||||
| Other – net | (75 | ) |
| 55 |
|
| 24 |
| |||||
| Net cash used in financing activities | (2,092 | ) |
| (3,493 | ) |
| (3,761 | ) | |||||
|
|
|
|
|
|
| ||||||||
| Effect of exchange rate changes on cash | (11 | ) |
| (9 | ) |
| (5 | ) | |||||
|
|
|
|
|
|
| ||||||||
| Net increase/(decrease) in cash and cash equivalents | 153 |
|
| (61 | ) |
| 75 |
| |||||
| Cash and cash equivalents, beginning of year | 405 |
|
| 466 |
|
| 391 |
| |||||
| Cash and cash equivalents, end of year | $ | 558 |
|
| $ | 405 |
|
| $ | 466 |
| ||
See accompanying notes to consolidated financial statements.
42
Table of Contents
NOTES TO CONSOLIDATED FINANCIAL STATEMENTS
YEARS ENDED FEBRUARY 3, 2017, JANUARY 29, 2016 AND JANUARY 30, 2015
NOTE 1: Summary of Significant Accounting Policies
Lowe’s Companies, Inc. and subsidiaries (the Company) is the world’s second-largest home improvement retailer and operated 2,129 stores in the United States, Canada, and Mexico at February 3, 2017. Below are those accounting policies considered by the Company to be significant.
Fiscal Year - The Company’s fiscal year ends on the Friday nearest the end of January. Fiscal 2016 contained 53 weeks, and fiscal years 2015 and 2014 each contained 52 weeks. All references herein for the years 2016, 2015, and 2014 represent the fiscal years ended February 3, 2017, January 29, 2016, and January 30, 2015, respectively.
Principles of Consolidation - The consolidated financial statements include the accounts of the Company and its wholly-owned or controlled operating subsidiaries. All intercompany accounts and transactions have been eliminated.
Foreign Currency - The functional currencies of the Company’s international subsidiaries are generally the local currencies of the countries in which the subsidiaries are located. Foreign currency denominated assets and liabilities are translated into U.S. dollars using the exchange rates in effect at the consolidated balance sheet date. Results of operations and cash flows are translated using the average exchange rates throughout the period. The effect of exchange rate fluctuations on translation of assets and liabilities is included as a component of shareholders’ equity in accumulated other comprehensive loss. Gains and losses from foreign currency transactions are included in selling, general and administrative (SG&A) expense.
Use of Estimates - The preparation of the Company’s financial statements in accordance with accounting principles generally accepted in the United States of America requires management to make estimates that affect the reported amounts of assets, liabilities, sales and expenses, and related disclosures of contingent assets and liabilities. The Company bases these estimates on historical results and various other assumptions believed to be reasonable, all of which form the basis for making estimates concerning the carrying values of assets and liabilities that are not readily available from other sources. Actual results may differ from these estimates.
Cash and Cash Equivalents - Cash and cash equivalents include cash on hand, demand deposits, and short-term investments with original maturities of three months or less when purchased. Cash and cash equivalents are carried at amortized cost on the consolidated balance sheets. The majority of payments due from financial institutions for the settlement of credit card and debit card transactions process within two business days and are, therefore, classified as cash and cash equivalents.
Investments - As of February 3, 2017, investments consisted primarily of money market funds, municipal obligations, certificates of deposit, and municipal floating rate obligations, all of which are classified as available-for-sale. Available-for-sale securities are recorded at fair value, and unrealized gains and losses are recorded, net of tax, as a component of accumulated other comprehensive income. Gross unrealized gains and losses were insignificant at February 3, 2017 and January 29, 2016.
The proceeds from sales of available-for-sale securities were $505 million, $394 million, and $283 million for 2016, 2015, and 2014, respectively. Gross realized gains and losses on the sale of available-for-sale securities were not significant for any of the periods presented.
Investments with a stated maturity date of one year or less from the balance sheet date or that are expected to be used in current operations are classified as short-term investments. All other investments are classified as long-term. Investments classified as long-term at February 3, 2017, will mature in one to 38 years, based on stated maturity dates.
The Company classifies as investments restricted balances primarily pledged as collateral for the Company’s extended protection plan program. Restricted balances included in short-term investments were $81 million at February 3, 2017, and $234 million at January 29, 2016. Restricted balances included in long-term investments were $354 million at February 3, 2017, and $202 million at January 29, 2016.
Merchandise Inventory - The majority of the Company’s inventory is stated at the lower of cost or market using the first-in, first-out method of inventory accounting. Inventory for certain subsidiaries representing approximately 8% of the consolidated inventory balance as of February 3, 2017, is stated at lower of cost or market using other inventory methods, including the weighted average cost method and the retail inventory method. The cost of inventory includes certain costs associated with the preparation of inventory for resale, including distribution center costs, and is net of vendor funds.
43
Table of Contents
The Company records an inventory reserve for the anticipated loss associated with selling inventories below cost. This reserve is based on management’s current knowledge with respect to inventory levels, sales trends, and historical experience. Management does not believe the Company’s merchandise inventories are subject to significant risk of obsolescence in the near term, and management has the ability to adjust purchasing practices based on anticipated sales trends and general economic conditions. However, changes in consumer purchasing patterns could result in the need for additional reserves. The Company also records an inventory reserve for the estimated shrinkage between physical inventories. This reserve is based primarily on actual shrink results from previous physical inventories. Changes in the estimated shrink reserve are made based on the timing and results of physical inventories.
The Company receives funds from vendors in the normal course of business, principally as a result of purchase volumes, sales, early payments, or promotions of vendors’ products. Generally, these vendor funds do not represent the reimbursement of specific, incremental, and identifiable costs incurred by the Company to sell the vendor’s product. Therefore, the Company treats these funds as a reduction in the cost of inventory as the amounts are accrued, and are recognized as a reduction of cost of sales when the inventory is sold. Funds that are determined to be reimbursements of specific, incremental, and identifiable costs incurred to sell vendors’ products are recorded as an offset to the related expense. The Company develops accrual rates for vendor funds based on the provisions of the agreements in place. Due to the complexity and diversity of the individual vendor agreements, the Company performs analyses and reviews historical trends throughout the year and confirms actual amounts with select vendors to ensure the amounts earned are appropriately recorded. Amounts accrued throughout the year could be impacted if actual purchase volumes differ from projected annual purchase volumes, especially in the case of programs that provide for increased funding when graduated purchase volumes are met.
Credit Programs - The Company has an agreement with Synchrony Bank (Synchrony), formerly GE Capital Retail, under which Synchrony purchases at face value commercial business accounts receivable originated by the Company and services these accounts. This agreement expires in December 2023, unless terminated sooner by the parties. The Company primarily accounts for these transfers as sales of the accounts receivable. When the Company transfers its commercial business accounts receivable, it retains certain interests in those receivables, including the funding of a loss reserve and its obligation related to Synchrony’s ongoing servicing of the receivables sold. Any gain or loss on the sale is determined based on the previous carrying amounts of the transferred assets allocated at fair value between the receivables sold and the interests retained. Fair value is based on the present value of expected future cash flows, taking into account the key assumptions of anticipated credit losses, payment rates, late fee rates, Synchrony’s servicing costs, and the discount rate commensurate with the uncertainty involved. Due to the short-term nature of the receivables sold, changes to the key assumptions would not materially impact the recorded gain or loss on the sales of receivables or the fair value of the retained interests in the receivables.
Total commercial business accounts receivable sold to Synchrony were $2.8 billion in 2016, $2.6 billion in 2015, and $2.4 billion in 2014. The Company recognized losses of $32 million in 2016, $36 million in 2015, and $38 million in 2014 on these receivable sales as SG&A expense, which primarily relates to the fair value of obligations related to servicing costs that are remitted to Synchrony monthly. At February 3, 2017 and January 29, 2016, the fair value of the retained interests was determined based on the present value of expected future cash flows and was insignificant.
Sales generated through the Company’s proprietary credit cards are not reflected in receivables. Under an agreement with Synchrony, credit is extended directly to customers by Synchrony. All credit program-related services are performed and controlled directly by Synchrony. The Company has the option, but no obligation, to purchase the receivables at the end of the agreement in December 2023. Tender costs, including amounts associated with accepting the Company’s proprietary credit cards, are included in SG&A expense in the consolidated statements of earnings.
The total portfolio of receivables held by Synchrony, including both receivables originated by Synchrony from the Company’s proprietary credit cards and commercial business accounts receivable originated by the Company and sold to Synchrony, approximated $9.6 billion at February 3, 2017, and $8.8 billion at January 29, 2016.
Property and Depreciation - Property is recorded at cost. Costs associated with major additions are capitalized and depreciated. Capital assets are expected to yield future benefits and have original useful lives which exceed one year. The total cost of a capital asset generally includes all applicable sales taxes, delivery costs, installation costs, and other appropriate costs incurred by the Company, including interest in the case of self-constructed assets. Upon disposal, the cost of properties and related accumulated depreciation is removed from the accounts, with gains and losses reflected in SG&A expense in the consolidated statements of earnings.
Property consists of land, buildings and building improvements, equipment, and construction in progress. Buildings and building improvements includes owned buildings, as well as buildings under capital lease and leasehold improvements.
44
Table of Contents
Equipment primarily includes store racking and displays, computer hardware and software, forklifts, vehicles, and other store equipment .
Depreciation is provided over the estimated useful lives of the depreciable assets. Assets are depreciated using the straight-line method. Leasehold improvements and assets under capital lease are depreciated over the shorter of their estimated useful lives or the term of the related lease, which may include one or more option renewal periods where failure to exercise such options would result in an economic penalty in such amount that renewal appears, at the inception of the lease, to be reasonably assured. During the term of a lease, if leasehold improvements are placed in service significantly after the inception of the lease, the Company depreciates these leasehold improvements over the shorter of the useful life of the leasehold assets or a term that includes lease renewal periods deemed to be reasonably assured at the time the leasehold improvements are placed into service. The amortization of these assets is included in depreciation expense in the consolidated financial statements.
Long-Lived Asset Impairment/Exit Activities - The carrying amounts of long-lived assets are reviewed whenever certain events or changes in circumstances indicate that the carrying amounts may not be recoverable. A potential impairment has occurred for long-lived assets held-for-use if projected future undiscounted cash flows expected to result from the use and eventual disposition of the assets are less than the carrying amounts of the assets. An impairment loss is recorded for long-lived assets held-for-use when the carrying amount of the asset is not recoverable and exceeds its fair value.
Excess properties that are expected to be sold within the next 12 months and meet the other relevant held-for-sale criteria are classified as long-lived assets held-for-sale. Excess properties consist primarily of retail outparcels and property associated with relocated or closed locations. An impairment loss is recorded for long-lived assets held-for-sale when the carrying amount of the asset exceeds its fair value less cost to sell. A long-lived asset is not depreciated while it is classified as held-for-sale.
For long-lived assets to be abandoned, the Company considers the asset to be disposed of when it ceases to be used. Until it ceases to be used, the Company continues to classify the asset as held-for-use and tests for potential impairment accordingly. If the Company commits to a plan to abandon a long-lived asset before the end of its previously estimated useful life, its depreciable life is re-evaluated.
The Company recorded long-lived asset impairment losses of $43 million during 2016, including $34 million for operating locations and $9 million for excess properties classified as held-for-use. The Company recorded impairment losses of $10 million during 2015, including $8 million for operating locations and $2 million for excess properties classified as held-for-use. The Company recorded long-lived asset impairment of $28 million during 2014, including $26 million for operating locations and $2 million for excess properties classified as held-for-use. Impairment losses are included in SG&A expense in the consolidated statements of earnings. Fair value measurements associated with long-lived asset impairments are further described in Note 4 to the consolidated financial statements.
The net carrying amount of excess properties that do not meet the held-for-sale criteria is included in other assets (noncurrent) on the consolidated balance sheets and totaled $174 million and $131 million at February 3, 2017 and January 29, 2016, respectively.
When locations under operating leases are closed, a liability is recognized for the fair value of future contractual obligations, including future minimum lease payments, property taxes, utilities, common area maintenance, and other ongoing expenses, net of estimated sublease income and other recoverable items. When the Company commits to an exit plan and communicates that plan to affected employees, a liability is recognized in connection with one-time employee termination benefits. Subsequent changes to the liabilities, including a change resulting from a revision to either the timing or the amount of estimated cash flows, are recognized in the period of change. Expenses associated with exit activities are included in SG&A expense in the consolidated statement of earnings.
Goodwill - Goodwill is the excess of the purchase price over the fair value of identifiable net assets acquired, less liabilities assumed, in a business combination. The Company reviews goodwill for impairment at the reporting unit level, which is one level below the operating segment level. Goodwill is not amortized but is evaluated for impairment at least annually on the first day of the fourth quarter or whenever events or changes in circumstances indicate that it is more likely than not that the carrying amount may not be recoverable.
The first step of the goodwill impairment test used to identify potential impairment compares the fair value of a reporting unit with its carrying amount, including goodwill. Fair value represents the price a market participant would be willing to pay in a potential sale of the reporting unit and is based on discounted future cash flows. If the fair value exceeds carrying value, then no goodwill impairment has occurred. If the carrying value of the reporting unit exceeds its fair value, a second step is required to measure possible goodwill impairment loss. The second step includes hypothetically valuing the tangible and intangible
45
Table of Contents
assets and liabilities of the reporting unit as if the reporting unit had been acquired in a business combination. Then, the implied fair value of the reporting unit’s goodwill is compared to the carrying value of that goodwill. If the carrying value of the reporting unit’s goodwill exceeds the implied fair value of the goodwill, an impairment loss is recognized in an amount equal to the excess, not to exceed the carrying value.
A reporting unit is an operating segment or a business unit one level below that operating segment, for which discrete financial information is prepared and regularly reviewed by segment management. During fiscal year 2016, goodwill was allocated to the following reporting units: U.S. Home Improvement, Orchard Supply Hardware (Orchard), Canada - Retail, and Canada - Distribution.
During the third quarter of fiscal year 2016, due to a strategic reassessment of the Orchard operations, the Company determined potential indicators of impairment within the reporting unit existed, and quantitatively evaluated the Orchard reporting unit for impairment. The Company classified this fair value measurement as Level 3. See Note 4 for additional information on the Company’s fair value measurements. The Company performed a discounted cash flow analysis for the Orchard reporting unit. The discounted cash flow model included management assumptions for expected sales growth, expansion plans, capital expenditures, and overall operational forecasts. The analysis led to the conclusion that the goodwill allocated to the Orchard reporting unit had no implied value. Accordingly, the full carrying value of $46 million relating to Orchard goodwill was impaired during the third quarter.
The changes in the carrying amount of goodwill for 2016, 2015, and 2014 were as follows:
|
| ||||||||||||||||||
|
|
|
|
|
|
|
|
|
|
|
|
| |||||||
| (In millions) | 2016 |
|
| 2015 |
|
| 2014 |
| ||||||||||
| Goodwill, balance at beginning of year | $ | 154 |
|
| $ | 154 |
|
| $ | 155 |
| |||||||
| Acquisitions | 1,015 |
|
| — |
|
| — |
| ||||||||||
| Impairment | (46 | ) |
| — |
|
| (1 | ) | ||||||||||
| Foreign currency translation adjustments | (41 | ) |
| — |
|
| — |
| ||||||||||
| Goodwill, balance at end of year | $ | 1,082 |
|
| $ | 154 |
|
| $ | 154 |
| |||||||
In May 2016, the Company completed its acquisition of RONA inc. (RONA). As a result of the acquisition, goodwill increased $976 million which was allocated to the Canada - Retail and Canada - Distribution reporting units. See Note 2 for additional information on the RONA acquisition.
Gross carrying amounts and cumulative goodwill impairment losses are as follows:
|
| |||||||||||||||||
|
|
|
|
|
|
|
|
|
|
|
|
|
|
|
|
| ||
|
| February 3, 2017 |
| January 29, 2016 | ||||||||||||||
| (In millions) | Gross Carrying Amount |
|
| Cumulative Impairment |
|
| Gross Carrying Amount |
|
| Cumulative Impairment |
| ||||||
| Goodwill | $ | 1,129 |
|
| $ | (47 | ) |
| $ | 155 |
|
| $ | (1 | ) | ||
Equity Method Investments - The Company’s investments in certain unconsolidated entities are accounted for under the equity method. The balance of these investments is included in other assets (noncurrent) in the accompanying consolidated balance sheets. The balance is increased to reflect the Company’s capital contributions and equity in earnings of the investees. The balance is decreased for its equity in losses of the investees, for distributions received that are not in excess of the carrying amount of the investments, and for any other than temporary impairment losses recognized. The Company’s equity in earnings and losses of the investees and other than temporary impairment losses are included in SG&A expense.
Equity method investments are evaluated for impairment whenever events or changes in circumstances indicate that a decline in value has occurred that is other than temporary. Evidence considered in this evaluation includes, but would not necessarily be limited to, the financial condition and near-term prospects of the investee, recent operating trends and forecasted performance of the investee, market conditions in the geographic area or industry in which the investee operates and the Company’s strategic plans for holding the investment in relation to the period of time expected for an anticipated recovery of its carrying value. Investments that are determined to have a decline in value deemed to be other than temporary are written down to estimated fair value. See Note 3 for additional information on the investment in the Australian joint venture.
Leases - For lease agreements that provide for escalating rent payments or free-rent occupancy periods, the Company recognizes rent expense on a straight-line basis over the non-cancellable lease term and option renewal periods where failure to exercise such options would result in an economic penalty in such amount that renewal appears, at the inception of the lease, to
46
Table of Contents
be reasonably assured. The lease term commences on the date that the Company takes possession of or controls the physical use of the property. Deferred rent is included in other liabilities (noncurrent) on the consolidated balance sheets.
When the Company renegotiates and amends a lease to extend the non-cancellable lease term prior to the date at which it would have been required to exercise or decline a term extension option, the amendment is treated as a new lease. The new lease begins on the date the lease amendment is entered into and ends on the last date of the non-cancellable lease term, as adjusted to include any option renewal periods where failure to exercise such options would result in an economic penalty in such amount that renewal appears, at the inception of the lease amendment, to be reasonably assured. The new lease is classified as operating or capital under the authoritative guidance through use of assumptions regarding residual value, economic life, incremental borrowing rate, and fair value of the leased asset(s) as of the date of the amendment.
Accounts Payable - The Company has an agreement with a third party to provide an accounts payable tracking system which facilitates participating suppliers’ ability to finance payment obligations from the Company with designated third-party financial institutions. Participating suppliers may, at their sole discretion, make offers to finance one or more payment obligations of the Company prior to their scheduled due dates at a discounted price to participating financial institutions. The Company’s goal in entering into this arrangement is to capture overall supply chain savings, in the form of pricing, payment terms, or vendor funding, created by facilitating suppliers’ ability to finance payment obligations at more favorable discount rates, while providing them with greater working capital flexibility.
The Company’s obligations to its suppliers, including amounts due and scheduled payment dates, are not impacted by suppliers’ decisions to finance amounts under this arrangement. However, the Company’s right to offset balances due from suppliers against payment obligations is restricted by this arrangement for those payment obligations that have been financed by suppliers. As of February 3, 2017 and January 29, 2016, $1.6 billion and $1.3 billion, respectively, of the Company’s outstanding payment obligations had been placed on the accounts payable tracking system, and participating suppliers had financed $1.0 billion and $921 million, respectively, of those payment obligations to participating financial institutions.
Other Current Liabilities - Other current liabilities on the consolidated balance sheets consist of:
|
| |||||||||||
|
|
|
|
|
|
|
|
| ||||
| (In millions) | February 3, 2017 |
|
| January 29, 2016 |
| ||||||
| Self-insurance liabilities | $ | 327 |
|
| $ | 343 |
| ||||
| Accrued dividends | 304 |
|
| 255 |
| ||||||
| Sales tax liabilities | 210 |
|
| 140 |
| ||||||
| Accrued interest | 194 |
|
| 179 |
| ||||||
| Accrued property taxes | 108 |
|
| 111 |
| ||||||
| Other | 832 |
|
| 829 |
| ||||||
| Total | $ | 1,975 |
|
| $ | 1,857 |
| ||||
Self-Insurance - The Company is self-insured for certain losses relating to workers’ compensation, automobile, property, and general and product liability claims. The Company has insurance coverage to limit the exposure arising from these claims. The Company is also self-insured for certain losses relating to extended protection plan and medical and dental claims. Self-insurance claims filed and claims incurred but not reported are accrued based upon management’s estimates of the discounted ultimate cost for self-insured claims incurred using actuarial assumptions followed in the insurance industry and historical experience. Although management believes it has the ability to reasonably estimate losses related to claims, it is possible that actual results could differ from recorded self-insurance liabilities. The total self-insurance liability, including the current and non-current portions, was $831 million and $883 million at February 3, 2017, and January 29, 2016, respectively.
The Company provides surety bonds issued by insurance companies to secure payment of workers’ compensation liabilities as required in certain states where the Company is self-insured. Outstanding surety bonds relating to self-insurance were $243 million and $240 million at February 3, 2017, and January 29, 2016, respectively.
Income Taxes - The Company establishes deferred income tax assets and liabilities for temporary differences between the tax and financial accounting bases of assets and liabilities. The tax effects of such differences are reflected in the consolidated balance sheets at the enacted tax rates expected to be in effect when the differences reverse. A valuation allowance is recorded to reduce the carrying amount of deferred tax assets if it is more likely than not that all or a portion of the asset will not be realized. The tax balances and income tax expense recognized by the Company are based on management’s interpretation of the tax statutes of multiple jurisdictions.
47
Table of Contents
The Company establishes a liability for tax positions for which there is uncertainty as to whether or not the position will be ultimately sustained. The Company includes interest related to tax issues as part of net interest on the consolidated financial statements. The Company records any applicable penalties related to tax issues within the income tax provision.
Shareholders’ Equity - The Company has a share repurchase program that is executed through purchases made from time to time either in the open market or through private market transactions. Shares purchased under the repurchase program are retired and returned to authorized and unissued status. Any excess of cost over par value is charged to additional paid-in capital to the extent that a balance is present. Once additional paid-in capital is fully depleted, remaining excess of cost over par value is charged to retained earnings.
Revenue Recognition - The Company recognizes revenues, net of sales tax, when sales transactions occur and customers take possession of the merchandise. A provision for anticipated merchandise returns is provided through a reduction of sales and cost of sales in the period that the related sales are recorded. Revenues from product installation services are recognized when the installation is completed. Deferred revenues associated with amounts received for which customers have not yet taken possession of merchandise or for which installation has not yet been completed were $755 million and $619 million at February 3, 2017, and January 29, 2016, respectively.
Revenues from stored-value cards, which include gift cards and returned merchandise credits, are deferred and recognized when the cards are redeemed. The liability associated with outstanding stored-value cards was $498 million and $459 million at February 3, 2017, and January 29, 2016, respectively, and these amounts are included in deferred revenue on the consolidated balance sheets. The Company recognizes income from unredeemed stored-value cards at the point at which redemption becomes remote. The Company’s stored-value cards have no expiration date or dormancy fees. Therefore, to determine when redemption is remote, the Company analyzes an aging of the unredeemed cards based on the date of last stored-value card use. The amount of revenue recognized from unredeemed stored-value cards for which redemption was deemed remote was not significant for 2016, 2015, and 2014.
Extended Protection Plans - The Company sells separately-priced extended protection plan contracts under a Lowe’s-branded program for which the Company is ultimately self-insured. The Company recognizes revenue from extended protection plan sales on a straight-line basis over the respective contract term. Extended protection plan contract terms primarily range from one to four years from the date of purchase or the end of the manufacturer’s warranty, as applicable. Changes in deferred revenue for extended protection plan contracts are summarized as follows:
|
| |||||||||||
|
|
|
|
|
|
|
|
|
|
|
|
|
| (In millions) | 2016 |
|
| 2015 |
|
| 2014 |
| |||
| Deferred revenue - extended protection plans, beginning of year | $ | 729 |
|
| $ | 730 |
|
| $ | 730 |
|
| Additions to deferred revenue | 387 |
|
| 350 |
|
| 318 |
| |||
| Deferred revenue recognized | (353 | ) |
| (351 | ) |
| (318 | ) | |||
| Deferred revenue - extended protection plans, end of year | $ | 763 |
|
| $ | 729 |
|
| $ | 730 |
|
Incremental direct acquisition costs associated with the sale of extended protection plans are also deferred and recognized as expense on a straight-line basis over the respective contract term. Deferred costs associated with extended protection plan contracts were $18 million and $20 million at February 3, 2017, and January 29, 2016, respectively. The Company’s extended protection plan deferred costs are included in other assets (noncurrent) on the consolidated balance sheets. All other costs, such as costs of services performed under the contract, general and administrative expenses, and advertising expenses are expensed as incurred.
The liability for extended protection plan claims incurred is included in other current liabilities on the consolidated balance sheets and was not material in any of the years presented. Expenses for claims are recognized when incurred and totaled $141 million, $127 million, and $123 million for 2016, 2015, and 2014, respectively.
48
Table of Contents
Cost of Sales and Selling, General and Administrative Expenses - The following lists the primary costs classified in each major expense category:
|
| ||
|
|
|
|
| Cost of Sales |
| Selling, General and Administrative |
| Total cost of products sold, including: - Purchase costs, net of vendor funds; - Freight expenses associated with moving merchandise inventories from vendors to retail stores; - Costs associated with operating the Company’s distribution network, including payroll and benefit costs and occupancy costs; Costs of installation services provided; Costs associated with delivery of products directly from vendors to customers by third parties; Costs associated with inventory shrinkage and obsolescence; Costs of services performed under the extended protection plan. |
| Payroll and benefit costs for retail and corporate employees; Occupancy costs of retail and corporate facilities; Advertising; Costs associated with delivery of products from stores and distribution centers to customers; Third-party, in-store service costs; Tender costs, including bank charges, costs associated with credit card interchange fees and amounts associated with accepting the Company’s proprietary credit cards; Costs associated with self-insured plans, and premium costs for stop-loss coverage and fully insured plans; Long-lived asset impairment losses and gains/losses on disposal of assets; Other administrative costs, such as supplies, and travel and entertainment. |
Advertising - Costs associated with advertising are charged to expense as incurred. Advertising expenses were $893 million, $769 million, and $819 million in 2016, 2015, and 2014, respectively.
Shipping and Handling Costs - The Company includes shipping and handling costs relating to the delivery of products directly from vendors to customers by third parties in cost of sales. Shipping and handling costs, which include third-party delivery costs, salaries, and vehicle operations expenses relating to the delivery of products from stores and distribution centers to customers, are classified as SG&A expense. Shipping and handling costs included in SG&A expense were $700 million, $607 million and $548 million in 2016, 2015, and 2014, respectively.
Store Opening Costs - Costs of opening new or relocated retail stores, which include payroll and supply costs incurred prior to store opening and grand opening advertising costs, are charged to expense as incurred.
Comprehensive Income - The Company reports comprehensive income in its consolidated statements of comprehensive income and consolidated statements of shareholders’ equity. Comprehensive income represents changes in shareholders’ equity from non-owner sources and is comprised of net earnings adjusted primarily for foreign currency translation adjustments. Net foreign currency translation losses, net of tax, classified in accumulated other comprehensive loss were $240 million, $394 million, and $103 million at February 3, 2017, January 29, 2016, and January 30, 2015, respectively.
Segment Information - The Company’s home improvement retail operations represent a single reportable segment. Key operating decisions are made at the Company level in order to maintain a consistent retail store presentation. The Company’s home improvement retail stores sell similar products and services, use similar processes to sell those products and services, and sell their products and services to similar classes of customers. In addition, the Company’s operations exhibit similar long-term economic characteristics. The amounts of long-lived assets and net sales outside of the U.S. were approximately 8.7% and 5.7%, respectively, at February 3, 2017 and were not significant at January 29, 2016, and January 30, 2015.
Reclassifications - Certain prior period amounts have been reclassified to conform to current classifications.
Recent Accounting Pronouncements - In January 2017, the Financial Accounting Standards Board (FASB) issued Accounting Standards Update (ASU) 2017-04, Intangibles-Goodwill and Other (Topic 350) . The ASU eliminates Step 2 of the goodwill impairment test, which requires determining the fair value of assets acquired or liabilities assumed in a business combination. Under the amendments in this update, a goodwill impairment test is performed by comparing the fair value of the reporting unit with its carrying amount. An entity should recognize an impairment charge for the amount by which the carrying amount exceeds the reporting unit’s fair value; however, the loss recognized should not exceed the total amount of goodwill allocated to that reporting unit. This ASU is effective for annual periods beginning after December 15, 2019, and interim periods within those annual periods, with early adoption permitted. The adoption of this guidance by the Company is not expected to have a material impact on its consolidated financial statements.
49
Table of Contents
In March 2016, the FASB issued ASU 2016-09, Compensation-Stock Compensation (Topic 718): Improvements to Employee Share-Based Payment Accounting . The ASU eliminates the APIC pool concept and requires that excess tax benefits and tax deficiencies be recorded in the income statement when awards are settled. The pronouncement also addresses simplifications related to statement of cash flows classification, accounting for forfeitures, and minimum statutory tax withholding requirements. This ASU is effective for annual periods beginning after December 15, 2016, and interim periods within those annual periods, with early adoption permitted. We plan to adopt this ASU in the first quarter of fiscal year 2017. The primary impact of adopting the ASU will be the recognition of excess tax benefits and deficiencies within income taxes, which will increase the volatility within our provision for income taxes as these excess amounts are dependent on our stock price at the date the awards vest or are exercised. The Company has elected to continue estimating forfeitures of share-based awards when determining compensation cost to be recognized each period. The Company does not expect the other provisions within the ASU to have a material impact on its consolidated financial statements.
In February 2016, the FASB issued ASU 2016-02, Leases (Topic 842). The guidance in this ASU supersedes the leasing guidance in Topic 840, Leases . Under the new guidance, lessees are required to recognize lease assets and lease liabilities on the balance sheet for those leases previously classified as operating leases. For leases with a term of 12 months or less, a lessee is permitted to make an accounting policy election by class of underlying asset not to recognize lease assets and lease liabilities. If a lessee makes this election, it should recognize lease expense for such leases generally on a straight-line basis over the lease term. This ASU is effective for fiscal years beginning after December 15, 2018, and interim periods within those fiscal years, with early adoption permitted. The Company is currently evaluating the impact of adopting this ASU on its consolidated financial statements but expects the ASU to have a material impact on its financial position, as a result of the requirement to recognize right-of-use assets and lease liabilities on the Company’s consolidated balance sheets.
In January 2016, the FASB issued ASU 2016-01, Recognition and Measurement of Financial Assets and Liabilities. The ASU requires, among other things, that entities measure equity investments (except those accounted for under the equity method of accounting or those that result in consolidation of the investee) at fair value, with changes in fair value recognized in net income. Under this ASU, entities will no longer be able to recognize unrealized holding gains and losses on available-for-sale equity securities in other comprehensive income, and they will no longer be able to use the cost method of accounting for equity securities that do not have readily determinable fair values. The guidance for classifying and measuring investments in debt securities and loans is not impacted. ASU 2016-01 eliminates certain disclosure requirements related to financial instruments measured at amortized cost and adds disclosures related to the measurement categories of financial assets and financial liabilities. The guidance is effective for annual periods beginning after December 15, 2017. Early adoption is permitted for only certain portions of the ASU. The adoption of this guidance by the Company is not expected to have a material impact on its consolidated financial statements.
In July 2015, the FASB issued ASU 2015-11, Simplifying the Measurement of Inventory. The ASU requires entities using the first-in, first-out (FIFO) inventory costing method to subsequently value inventory at the lower of cost and net realizable value. The ASU defines net realizable value as the estimated selling prices in the ordinary course of business, less reasonably predictable costs of completion, disposal, and transportation. This ASU requires prospective application and is effective for fiscal years beginning after December 15, 2016, and interim periods within those fiscal years, with early adoption permitted. The adoption of this guidance by the Company is not expected to have a material impact on its consolidated financial statements.
In May 2014, the FASB issued ASU 2014-09, Revenue from Contracts with Customers. The ASU is a comprehensive new revenue recognition model that requires a company to recognize revenue to depict the transfer of goods or services to customers in an amount that reflects the consideration to which the entity expects to be entitled in exchange for those goods or services. In August 2015, the FASB issued ASU 2015-14, which deferred the effective date of the ASU to fiscal years beginning after December 15, 2017, and interim periods within those fiscal years. Early adoption is permitted for fiscal years beginning after December 15, 2016. Companies may use either a full retrospective or a modified retrospective approach to adopt this ASU. The Company continues to evaluate the adoption of this standard and its subsequent related amendments and interpretations. However, based on our preliminary assessment, we do not expect the standard to materially affect our consolidated financial statements. We have determined the adoption of the guidance will impact the timing of recognition of our stored value card breakage. Currently, breakage is recognized using the remote method and will be recognized using the proportional method upon adoption of the guidance We do not intend to early adopt the guidance, and based on our initial assessment of potential impacts to our consolidated financial statements, we expect to use a modified retrospective approach to adoption.
50
Table of Contents
NOTE 2: Acquisitions
On May 20, 2016, the Company acquired all of the issued and outstanding common shares of RONA for C$24 per share in cash. In addition, as part of the transaction, borrowings under RONA’s revolving credit facility were settled in full at the closing of the acquisition, and the facility was eliminated. Total cash consideration to acquire the equity and settle the debt was C$3.1 billion ($2.4 billion) and is included in the investing section of the consolidated statements of cash flows. RONA is one of Canada’s largest retailers and distributors of hardware, building materials, home renovation, and gardening products. The acquisition is expected to enable the Company to accelerate its growth strategy by significantly expanding its presence in the Canadian home improvement market. Acquisition-related costs were expensed as incurred and were not significant. The following represents the aggregate purchase price allocation which includes purchase accounting adjustments made during the measurement period:
|
| ||||
|
|
|
|
| |
| (In millions) | May 20, 2016 | |||
| Purchase price: |
| |||
| Cash paid to common shareholders | $ | 1,999 |
| |
| Cash paid to debt holders | 368 |
| ||
| Total cash paid | $ | 2,367 |
| |
|
|
| |||
| Allocation: |
| |||
| Cash acquired | $ | 83 |
| |
| Accounts receivable | 260 |
| ||
| Merchandise inventory | 814 |
| ||
| Property | 886 |
| ||
| Amortizable intangible assets: |
| |||
| Trademarks | 204 |
| ||
| Dealer relationships | 106 |
| ||
| Other assets | 127 |
| ||
| Goodwill | 976 |
| ||
| Current liabilities assumed | (619 | ) | ||
| Long-term liabilities assumed | (361 | ) | ||
| Noncontrolling interest | (109 | ) | ||
| Total net assets acquired | $ | 2,367 |
| |
The intangible assets acquired include trademarks of $204 million with a weighted average useful life of 15 years and dealer relationships of $106 million with a weighted average useful life of 20 years, which are included in other assets in the accompanying consolidated balance sheets. The goodwill of $976 million is primarily attributable to the synergies expected to arise after the acquisition. Goodwill of approximately $107 million is expected to be deductible for tax purposes.
The transaction included the assumption by Lowe’s of unsecured debentures held by RONA of approximately C$118 million ($91 million) as of the acquisition date. The debentures matured and were settled in October 2016.
As of the acquisition date, 6.9 million preferred shares of RONA remained outstanding. The total fair value of the shares and Lowe’s corresponding noncontrolling interest was $109 million, which was determined based on the closing market price of RONA’s preferred shares on the acquisition date. During the fourth fiscal quarter of 2016, the Company acquired all of the remaining noncontrolling interest in RONA by paying RONA’s preferred shareholders approximately $127 million, which represented an $18 million premium in excess of the carrying amount of the noncontrolling interest. See Note 13 to the consolidated financial statements for information regarding the impact of this transaction to the Company’s earnings per share calculation.
Pro forma and historical financial information has not been provided as the acquisition was not material to the consolidated financial statements. In addition, net earnings attributable to the noncontrolling interest was not significant for any of the reporting periods presented.
51
Table of Contents
NOTE 3: Investment in Australian Joint Venture
In the fourth quarter of fiscal year 2015, the Company announced its decision to exit the Australian joint venture investment with Woolworths Limited (Woolworths) and recorded a $530 million impairment of its equity method investment due to a determination that there was a decrease in value that was other than temporary. The Company owns a one-third share in the joint venture, Hydrox Holdings Pty Ltd. (Hydrox), which operated Masters Home Improvement stores and Home Timber and Hardware Group’s retail stores and wholesale distribution in Australia. As a result of this decision to exit, Woolworths is required to purchase the Company’s one-third share at its fair value as of January 18, 2016. The process for the two parties agreeing on fair value is prescribed in the Joint Venture Agreement. The $530 million non-cash impairment charge recorded in fiscal 2015 was based on the Company’s estimate of the value of its portion of the overall joint venture fair value as of January 18, 2016, and the Company’s estimate of this value has not changed.
During the third quarter of fiscal year 2016, Woolworths claimed a unilateral termination of the joint venture agreement, and executed other agreements to initiate the wind down of Hydrox without the Company’s approval as required under the joint venture agreement. Due to this, Lowe’s has concluded that under applicable accounting standards, the investment should be accounted for as a cost method investment going forward. As a result of this determination, accumulated foreign currency translation adjustments of $208 million were reclassified from accumulated other comprehensive loss into the carrying value of the cost method investment. In addition, the unilateral actions of Woolworths to begin the liquidation of Hydrox, represented a triggering event requiring the Company to evaluate the cost method investment for impairment. Management determined that the requirements for determining impairment were met, and leveraged wind down cash flow projections in determining the estimated fair value of the entity as of October 28, 2016. The value was determined using an income approach based upon the expected future cash flows generated from the settlement of assets and liabilities inclusive of inventory, property, payables, lease liabilities and employee entitlements. As a result, the Company recorded a $290 million non-cash impairment charge during the third quarter of fiscal 2016 to reflect its estimated portion of the overall joint venture fair value in wind down. The Company classified this fair value measurement as Level 3. See Note 4 for additional information on the Company’s fair value measurements.
The Company continues to maintain that amounts due under the joint venture agreement are to be based on fair value as of January 18, 2016 under a going concern basis. The determination of this amount is currently in arbitration. The recorded value of the investment is not reflective of this estimated value as the current operations are no longer deemed a going concern as a result of the unilateral actions taken by Woolworths. The Company will treat its claims for additional value under the joint venture agreement, above and beyond any amounts expected to be received through the wind down process, as a contingent asset and will recognize these amounts as they are realized.
NOTE 4: Fair Value Measurements
Fair value is defined as the price that would be received to sell an asset or paid to transfer a liability in an orderly transaction between market participants at the measurement date. The authoritative guidance for fair value measurements establishes a three-level hierarchy, which encourages an entity to maximize the use of observable inputs and minimize the use of unobservable inputs when measuring fair value. The three levels of the hierarchy are defined as follows:
|
|
|
| • | Level 1 - inputs to the valuation techniques that are quoted prices in active markets for identical assets or liabilities |
|
|
|
| • | Level 2 - inputs to the valuation techniques that are other than quoted prices but are observable for the assets or liabilities, either directly or indirectly |
|
|
|
| • | Level 3 - inputs to the valuation techniques that are unobservable for the assets or liabilities |
Assets and Liabilities that are Measured at Fair Value on a Recurring Basis
The Company’s available-for-sale securities represented the only significant assets measured at fair value on a recurring basis for the fiscal years ended February 3, 2017 and January 29, 2016. The following table presents the Company’s financial assets measured at fair value on a recurring basis. The fair values of these instruments approximated amortized costs.
52
Table of Contents
|
| |||||||||||
|
|
|
|
|
|
|
|
|
|
| ||
|
|
|
| Fair Value Measurements at | ||||||||
| (In millions) | Measurement Level |
| February 3, 2017 |
|
| January 29, 2016 |
| ||||
| Available-for-sale securities: |
|
|
|
|
| ||||||
| Money market funds | Level 1 |
| $ | 81 |
|
| $ | 192 |
| ||
| Certificates of deposit | Level 1 |
| 15 |
|
| 56 |
| ||||
| Municipal obligations | Level 2 |
| 4 |
|
| 38 |
| ||||
| Municipal floating rate obligations | Level 2 |
| — |
|
| 21 |
| ||||
| Total short-term investments |
|
| $ | 100 |
|
| $ | 307 |
| ||
| Available-for-sale securities: |
|
|
|
|
| ||||||
| Municipal floating rate obligations | Level 2 |
| $ | 359 |
|
| $ | 212 |
| ||
| Municipal obligations | Level 2 |
| 5 |
|
| 5 |
| ||||
| Certificates of deposit | Level 1 |
| 2 |
|
| 5 |
| ||||
| Total long-term investments |
|
| $ | 366 |
|
| $ | 222 |
| ||
There were no transfers between Levels 1, 2 or 3 during any of the periods presented.
When available, quoted prices were used to determine fair value. When quoted prices in active markets were available, investments were classified within Level 1 of the fair value hierarchy. When quoted prices in active markets were not available, fair values were determined using pricing models, and the inputs to those pricing models were based on observable market inputs. The inputs to the pricing models were typically benchmark yields, reported trades, broker-dealer quotes, issuer spreads and benchmark securities, among others.
Assets and Liabilities that are Measured at Fair Value on a Nonrecurring Basis
For the fiscal years ended February 3, 2017, and January 29, 2016, the Company’s only significant assets or liabilities measured at fair value on a nonrecurring basis subsequent to their initial recognition were goodwill (see Note 1 to the consolidated financial statements included herein for additional information regarding this fair value measurement), certain cost and equity method investments (see Note 3 to the consolidated financial statements included herein for additional information regarding this fair value measurement), and certain long-lived assets.
Long-lived assets
The Company reviews the carrying amounts of long-lived assets whenever certain events or changes in circumstances indicate that the carrying amounts may not be recoverable. With input from retail store operations, the Company’s accounting and finance personnel that organizationally report to the chief financial officer, assess the performance of retail stores quarterly against historical patterns and projections of future profitability for evidence of possible impairment. An impairment loss is recognized when the carrying amount of the asset (disposal) group is not recoverable and exceeds its fair value. The Company estimated the fair values of assets subject to long-lived asset impairment based on the Company’s own judgments about the assumptions that market participants would use in pricing the assets and on observable market data, when available. The Company classified these fair value measurements as Level 3.
In the determination of impairment for operating locations, the Company determined the fair values of individual operating locations using an income approach, which required discounting projected future cash flows. When determining the stream of projected future cash flows associated with an individual operating location, management made assumptions, incorporating local market conditions and inputs from retail store operations, the highest and best use, and about key variables including the following unobservable inputs: sales growth rates, gross margin, controllable expenses, such as payroll and occupancy expense, and asset residual values. In order to calculate the present value of those future cash flows, the Company discounted cash flow estimates at a rate commensurate with the risk that selected market participants would assign to the cash flows. In general, the selected market participants represented a group of other retailers with a location footprint similar in size to the Company’s.
During 2016, 14 operating locations experienced a triggering event and were evaluated for recoverability. Eleven of the 14 operating locations were determined to be impaired due to a decline in recent cash flow trends and an unfavorable sales outlook, resulting in an impairment loss of $34 million. The discounted cash flow model used to estimate the fair value of the impaired operating locations assumed average annual sales growth rates ranging from 2.0% to 3.7% over the remaining life of the locations and applied a discount rate of approximately 8.0%.
53
Table of Contents
Three of the 14 operating locations that experienced a triggering event during 2016 were determined to be recoverable and, therefore, were not impaired. A 10% reduction in projected sales used to estimate future cash flows for these operating locations would not have had a significant impact to impairment losses recognized during 2016.
In the determination of impairment for excess properties held-for-use and held-for-sale, which consisted of retail outparcels and property associated with relocated or closed locations, the fair values were determined using a market approach based on estimated selling prices. The Company determined the estimated selling prices by obtaining information from property brokers or appraisers in the specific markets being evaluated or negotiated non-binding offers to purchase. The information obtained from property brokers or appraisers included comparable sales of similar assets and assumptions about demand in the market for these assets.
During 2016, the Company incurred total impairment charges of $9 million for 13 excess property locations. A 10% reduction in the estimated selling prices for these excess properties at the dates the locations were evaluated for impairment would have increased impairment losses by an insignificant amount.
The following table presents the Company’s assets measured at estimated fair value on a nonrecurring basis and the resulting impairment losses included in earnings, excluding costs to sell for excess properties held-for-sale. Because these assets subject to impairment were not measured at fair value on a recurring basis, certain fair value measurements presented in the table may reflect values at earlier measurement dates and may no longer represent the fair values at February 3, 2017 and January 29, 2016.
Fair Value Measurements - Nonrecurring Basis
|
| |||||||||||||||||||||||||||||||||
|
|
|
|
|
|
|
|
|
|
|
|
|
|
|
|
| ||||||||||||||||||
|
| February 3, 2017 |
| January 29, 2016 | ||||||||||||||||||||||||||||||
| (In millions) | Fair Value Measurements |
|
| Impairment Losses |
|
| Fair Value Measurements |
|
| Impairment Losses |
| ||||||||||||||||||||||
| Assets-held-for-use: |
|
|
|
|
|
|
| ||||||||||||||||||||||||||
| Operating locations | $ |
|
| $ | (34 | ) |
| $ |
|
| $ | (8 | ) | ||||||||||||||||||||
| Excess properties | 18 |
|
| (9 | ) |
| 4 |
|
| (2 | ) | ||||||||||||||||||||||
| Goodwill (Note 1) | — |
|
| (46 | ) |
| — |
|
| — |
| ||||||||||||||||||||||
| Other assets: |
|
|
|
|
|
|
| ||||||||||||||||||||||||||
| Cost method investments (Note 3) | 103 |
|
| (290 | ) |
| — |
|
| — |
| ||||||||||||||||||||||
| Equity method investments (Note 3) | — |
|
| — |
|
| 393 |
|
| (530 | ) | ||||||||||||||||||||||
| Total | $ | 124 |
|
| $ | (379 | ) |
| $ | 401 |
|
| $ | (540 | ) | ||||||||||||||||||
Fair Value of Financial Instruments
The Company’s financial instruments not measured at fair value on a recurring basis include cash and cash equivalents, accounts receivable, accounts payable, accrued liabilities, and long-term debt and are reflected in the financial statements at cost. With the exception of long-term debt, cost approximates fair value for these items due to their short-term nature. The fair values of the Company’s unsecured notes were estimated using quoted market prices. The fair values of the Company’s mortgage notes were estimated using discounted cash flow analyses, based on the future cash outflows associated with these arrangements and discounted using the applicable incremental borrowing rate.
Carrying amounts and the related estimated fair value of the Company’s long-term debt, excluding capitalized lease obligations, are as follows:
|
| |||||||||||||||||||||||||||
|
|
|
|
|
|
|
|
|
|
|
|
|
|
|
|
| ||||||||||||
|
| February 3, 2017 |
| January 29, 2016 | ||||||||||||||||||||||||
| (In millions) | Carrying Amount |
|
| Fair Value |
|
| Carrying Amount |
|
| Fair Value |
| ||||||||||||||||
| Unsecured notes (Level 1) | $ | 14,321 |
|
| $ | 15,305 |
|
| $ | 12,073 |
|
| $ | 13,292 |
| ||||||||||||
| Mortgage notes (Level 2) | 7 |
|
| 7 |
|
| 7 |
|
| 8 |
| ||||||||||||||||
| Long-term debt (excluding capitalized lease obligations) | $ | 14,328 |
|
| $ | 15,312 |
|
| $ | 12,080 |
|
| $ | 13,300 |
| ||||||||||||
54
Table of Contents
NOTE 5: Property and Accumulated Depreciation
Property is summarized by major class in the following table:
|
| |||||||||||||
|
|
|
|
|
|
|
|
|
|
| ||||
| (In millions) | Estimated Depreciable Lives, In Years |
| February 3, 2017 |
|
| January 29, 2016 |
| ||||||
| Cost: |
|
|
|
|
| ||||||||
| Land | N/A |
| $ | 7,329 |
|
| $ | 7,086 |
| ||||
| Buildings and building improvements | 5-40 |
| 18,147 |
|
| 17,451 |
| ||||||
| Equipment | 2-15 |
| 10,978 |
|
| 10,863 |
| ||||||
| Construction in progress | N/A |
| 464 |
|
| 513 |
| ||||||
| Total cost |
|
| 36,918 |
|
| 35,913 |
| ||||||
| Accumulated depreciation |
|
| (16,969 | ) |
| (16,336 | ) | ||||||
| Property, less accumulated depreciation |
|
| $ | 19,949 |
|
| $ | 19,577 |
| ||||
Included in net property are assets under capital lease of $696 million, less accumulated depreciation of $269 million, at February 3, 2017, and $617 million, less accumulated depreciation of $400 million, at January 29, 2016. The related amortization expense for assets under capital lease is included in depreciation expense. The Company recognized depreciation expense of $1.5 billion in 2016, 2015, and 2014.
NOTE 6: Exit Activities
When locations under operating leases are closed, the Company recognizes a liability for the fair value of future contractual obligations, including future minimum lease payments, property taxes, utilities, common area maintenance and other ongoing expenses, net of estimated sublease income and other recoverable items. During 2016, the Company closed or relocated 10 locations subject to an operating lease. In 2015, the Company closed or relocated two locations subject to operating leases. In 2014, the Company did not close or relocate any locations subject to operating leases.
Subsequent changes to the liabilities, including changes resulting from revisions to either the timing or the amount of estimated cash flows, are recognized in the period of change. Changes to the accrual for exit activities for 2016, 2015, and 2014 are summarized as follows:
|
| |||||||||||
|
|
|
|
|
|
|
|
|
|
|
|
|
| (In millions) | 2016 |
|
| 2015 |
|
| 2014 |
| |||
| Accrual for exit activities, balance at beginning of year | $ | 67 |
|
| $ | 53 |
|
| $ | 54 |
|
| Additions to the accrual - net | 47 |
|
| 34 |
|
| 14 |
| |||
| Cash payments | (48 | ) |
| (20 | ) |
| (15 | ) | |||
| Accrual for exit activities, balance at end of year | $ | 66 |
|
| $ | 67 |
|
| $ | 53 |
|
NOTE 7: Short-Term Borrowings and Lines of Credit
In November 2016, the Company entered into an amended and restated credit agreement (the Amended Facility) with a syndicate of banks to modify the Company’s credit agreement dated August 29, 2014 (the 2014 Credit Facility), which provided for borrowings up to $1.75 billion through August 2019. The Amended Facility extends the maturity date to November 2021 and continues to provide for borrowings of up to $1.75 billion. Subject to obtaining commitments from the lenders and satisfying other conditions specified in the Amended Facility, we may increase the aggregate availability by an additional $500 million. The Amended Facility supports our commercial paper program and has a $500 million letter of credit sublimit. Letters of credit issued pursuant to the facility reduce the amount available for borrowing under its terms. Borrowings made are unsecured and are priced at fixed rates based upon market conditions at the time of funding in accordance with the terms of the facility. The Amended Facility contains customary representations, warranties, and covenants for a transaction of this type. The Company was in compliance with those covenants at February 3, 2017. As of February 3, 2017, there were $510 million of outstanding borrowings under the Company’s commercial paper program with a weighted average interest rate of 1.01% and no outstanding borrowings or letters of credit under the Amended Facility. As of January 29, 2016, there were $43 million of outstanding borrowings under the Company’s commercial paper program and no outstanding borrowings or letters of credit under the 2014 Credit Facility.
55
Table of Contents
NOTE 8: Long-Term Debt
|
| |||||||||||
|
|
|
|
|
|
|
|
|
|
|
| |
| Debt Category (In millions) | Weighted-Average Interest Rate at February 3, 2017 |
|
| February 3, 2017 |
|
| January 29, 2016 |
| |||
| Secured debt: |
|
|
|
|
| ||||||
| Mortgage notes due through fiscal 2027 1 | 5.44 | % |
| $ |
|
| $ |
| |||
| Unsecured debt: |
|
|
|
|
| ||||||
| Notes due through fiscal 2021 | 2.87 | % |
| 3,567 |
|
| 3,990 |
| |||
| Notes due fiscal 2022-2026 | 3.07 | % |
| 3,783 |
|
| 2,443 |
| |||
| Notes due fiscal 2027-2031 | 6.76 | % |
| 814 |
|
| 813 |
| |||
| Notes due fiscal 2032-2036 | 5.64 | % |
| 941 |
|
| 941 |
| |||
| Notes due fiscal 2037-2041 2 | 5.94 | % |
| 1,585 |
|
| 1,585 |
| |||
| Notes due fiscal 2042-2046 | 4.26 | % |
| 3,631 |
|
| 2,301 |
| |||
| Capitalized lease obligations due through fiscal 2037 |
|
| 861 |
|
| 526 |
| ||||
| Total long-term debt |
|
| 15,189 |
|
| 12,606 |
| ||||
| Less current maturities |
|
| (795 | ) |
| (1,061 | ) | ||||
| Long-term debt, excluding current maturities |
|
| $ | 14,394 |
|
| $ | 11,545 |
| ||
|
|
| ||||||||||
| 1 | Real properties with an aggregate book value of $28 million were pledged as collateral at February 3, 2017, for secured debt. | ||||||||||
|
|
| ||||||||||
| 2 | Amount includes $100 million of notes issued in 1997 that may be put at the option of the holder on the 20th anniversary of the issue at par value. None of these notes are currently puttable. | ||||||||||
Debt maturities, exclusive of unamortized original issue discounts, unamortized debt issuance costs, and capitalized lease obligations, for the next five years and thereafter are as follows: 2017, $751 million; 2018, $251 million; 2019, $1.1 billion; 2020, $500 million; 2021, $1.0 billion; thereafter, $10.9 billion.
The Company’s unsecured notes are issued under indentures that generally have similar terms and, therefore, have been grouped by maturity date for presentation purposes in the table above. The notes contain certain restrictive covenants, none of which are expected to impact the Company’s capital resources or liquidity. The Company was in compliance with all covenants of these agreements at February 3, 2017.
Unsecured notes issued during 2014 were as follows:
|
| ||||||||||||||||||||||
|
|
|
|
|
|
|
|
|
|
|
|
|
|
|
| ||||||||
| Issue Date |
| Principal Amount (in millions) |
| Maturity Date |
| Fixed vs. Floating |
| Interest Rate |
| Discount (in millions) | ||||||||||||
| September 2014 |
| $ | 450 |
|
| September 2019 |
| Floating |
| Floating |
| $ |
| |||||||||
| September 2014 |
| $ | 450 |
|
| September 2024 |
| Fixed |
| 3.125% |
| $ |
| |||||||||
| September 2014 |
| $ | 350 |
|
| September 2044 |
| Fixed |
| 4.250% |
| $ |
| |||||||||
The floating rate notes issued in 2014 will bear interest at a floating rate, reset quarterly, equal to the three-month LIBOR plus 0.420% (1.373% as of February 3, 2017). Interest on these floating rate notes is payable quarterly in arrears in March, June, September, and December of each year until maturity. Interest on the fixed rate notes issued in 2014 is payable semiannually in arrears in March and September of each year until maturity.
56
Table of Contents
Unsecured notes issued during 2015 were as follows:
|
| ||||||||||||||||||||||
|
|
|
|
|
|
|
|
|
|
|
|
|
|
|
| ||||||||
| Issue Date |
| Principal Amount (in millions) |
| Maturity Date |
| Fixed vs. Floating |
| Interest Rate |
| Discount (in millions) | ||||||||||||
| September 2015 |
| $ | 250 |
|
| September 2018 |
| Floating |
| Floating |
| $ |
| |||||||||
| September 2015 |
| $ | 750 |
|
| September 2025 |
| Fixed |
| 3.375% |
| $ |
| |||||||||
| September 2015 |
| $ | 750 |
|
| September 2045 |
| Fixed |
| 4.375% |
| $ | 24 |
| ||||||||
The floating rate notes issued in 2015 will bear interest at a floating rate, reset quarterly, equal to the three-month LIBOR plus 0.600% (1.559% as of February 3, 2017). Interest on these floating rate notes is payable quarterly in arrears in March, June, September, and December of each year until maturity. Interest on the fixed rate notes issued in 2015 is payable semiannually in arrears in March and September of each year until maturity.
Unsecured notes issued during 2016 were as follows:
|
| ||||||||||||||
|
|
|
|
|
|
|
|
|
|
|
|
|
|
|
|
| Issue Date |
| Principal Amount (in millions) |
| Maturity Date |
| Fixed vs. Floating |
| Interest Rate |
| Discount (in millions) | ||||
| April 2016 |
| $ | 250 |
|
| April 2019 |
| Floating |
| Floating |
| $ |
| |
| April 2016 |
| $ | 350 |
|
| April 2019 |
| Fixed |
| 1.150% |
| $ |
| |
| April 2016 |
| $ | 1,350 |
|
| April 2026 |
| Fixed |
| 2.500% |
| $ | 12 |
|
| April 2016 |
| $ | 1,350 |
|
| April 2046 |
| Fixed |
| 3.700% |
| $ | 19 |
|
The floating rate notes issued in 2016 will bear interest at a floating rate, reset quarterly, equal to the three-month LIBOR plus 0.240% (1.262% as of February 3, 2017). Interest on these floating rate notes is payable quarterly in arrears in April, July, October, and January of each year until maturity. Interest on the fixed rate notes issued in 2016 is payable semiannually in arrears in April and October of each year until maturity.
The discounts associated with these issuances, which include the underwriting and issuance discounts, are recorded in long-term debt and are being amortized over the respective terms of the notes using the effective interest method.
The indentures governing the fixed rate notes issued in 2016, 2015, and 2014, contain a provision that allows the Company to redeem the notes at any time, in whole or in part, at specified redemption prices plus accrued interest to the date of redemption. We do not have the right to redeem the floating rate notes issued in 2016, 2015, and 2014, prior to maturity. The indentures also contain a provision that allows the holders of the notes to require the Company to repurchase all or any part of their notes if a change of control triggering event (as defined in the indentures) occurs. If elected under the change of control provisions, the repurchase of the notes will occur at a purchase price of 101% of the principal amount, plus accrued and unpaid interest on such notes to the date of purchase, if any. The indentures governing the notes do not limit the aggregate principal amount of debt securities that the Company may issue and do not require the Company to maintain specified financial ratios or levels of net worth or liquidity. However, the indenture includes various restrictive covenants, none of which is expected to impact the Company’s liquidity or capital resources.
NOTE 9: Shareholders’ Equity
Authorized shares of preferred stock were 5.0 million ($5 par value) at February 3, 2017, and January 29, 2016, none of which have been issued. The Board of Directors may issue the preferred stock (without action by shareholders) in one or more series, having such voting rights, dividend and liquidation preferences, and such conversion and other rights as may be designated by the Board of Directors at the time of issuance.
Authorized shares of common stock were 5.6 billion ($.50 par value) at February 3, 2017, and January 29, 2016.
The Company has a share repurchase program that is executed through purchases made from time to time either in the open market or through private off-market transactions. Shares purchased under the repurchase program are retired and returned to authorized and unissued status. On March 20, 2015, the Company’s Board of Directors authorized a $5.0 billion share repurchase under the program with no expiration, which was announced on the same day. On January 27, 2017, the Company’s Board of Directors authorized an additional $5.0 billion share repurchase under the program with no expiration, which was announced on the same day. As of February 3, 2017, the Company had $5.1 billion remaining under the program.
57
Table of Contents
During the year ended February 3, 2017, the Company entered into Accelerated Share Repurchase (ASR) agreements with third-party financial institutions to repurchase a total of 19.1 million shares of the Company’s common stock for $1.4 billion. At inception, the Company paid the financial institutions using cash on hand and took initial delivery of shares. Under the terms of the ASR agreements, upon settlement, the Company would either receive additional shares from the financial institution or be required to deliver additional shares or cash to the financial institution. The Company controlled its election to either deliver additional shares or cash to the financial institution and was subject to provisions which limited the number of shares the Company would be required to deliver.
The final number of shares received upon settlement of each ASR agreement was determined with reference to the volume-weighted average price of the Company’s common stock over the term of the ASR agreement. The initial repurchase of shares under these agreements resulted in an immediate reduction of the outstanding shares used to calculate the weighted-average common shares outstanding for basic and diluted earnings per share.
These ASR agreements were accounted for as treasury stock transactions and forward stock purchase contracts. The par value of the shares received was recorded as a reduction to common stock with the remainder recorded as a reduction to capital in excess of par value and retained earnings. The forward stock purchase contracts were considered indexed to the Company’s own stock and were classified as equity instruments.
During the year ended February 3, 2017, the Company also repurchased shares of its common stock through the open market totaling 27.6 million shares for a cost of $2.1 billion.
The Company also withholds shares from employees to satisfy either the exercise price of stock options exercised or the statutory withholding tax liability resulting from the vesting of restricted stock awards and performance share units.
Shares repurchased for 2016 and 2015 were as follows:
|
| |||||||||||||||||||||||
|
|
|
|
|
|
|
|
|
|
|
|
|
|
| ||||||||||
|
| 2016 |
| 2015 | ||||||||||||||||||||
| (In millions) | Shares |
|
| Cost1 |
|
| Shares |
|
| Cost1 |
| ||||||||||||
| Share repurchase program | 46.7 |
|
| $ | 3,500 |
|
| 53.6 |
|
| $ | 3,811 |
| ||||||||||
| Shares withheld from employees | 1.0 |
|
| 77 |
|
| 0.9 |
|
| 67 |
| ||||||||||||
| Total share repurchases | 47.7 |
|
| $ | 3,577 |
|
| 54.5 |
|
| $ | 3,878 |
| ||||||||||
|
|
| ||||||||||||||||||||||
| 1 | Reductions of $3.3 billion and $3.6 billion were recorded to retained earnings, after capital in excess of par value was depleted, for 2016 and 2015, respectively. | ||||||||||||||||||||||
NOTE 10: Accounting for Share-Based Payments
Overview of Share-Based Payment Plans
The Company has a number of active and inactive equity incentive plans (the Incentive Plans) under which the Company has been authorized to grant share-based awards to key employees and non-employee directors. The Company also has an employee stock purchase plan (the ESPP) that allows employees to purchase Company shares at a discount through payroll deductions. All of these plans contain a nondiscretionary anti-dilution provision that is designed to equalize the value of an award as a result of any stock dividend, stock split, recapitalization, or any other similar equity restructuring.
A total of 199.0 million shares have been previously authorized for grant to key employees and non-employee directors under all of the Company’s Incentive Plans, but only 80.0 million of those shares were authorized for grants of share-based awards under the Company’s currently active Incentive Plans. In addition, a total of 70.0 million shares have been previously authorized for purchases by employees participating in the ESPP.
At February 3, 2017, there were 34.4 million shares remaining available for grants under the currently active Incentive Plans and 23.0 million shares remaining available for purchases under the ESPP.
The Company recognized share-based payment expense within SG&A expense in the consolidated statements of earnings of $90 million, $117 million, and $119 million in 2016, 2015 and 2014 respectively. The total associated income tax benefit recognized was $29 million, $38 million and $39 million in 2016, 2015 and 2014, respectively.
58
Table of Contents
Total unrecognized share-based payment expense for all share-based payment plans was $159 million at February 3, 2017, of which $88 million will be recognized in 2017, $51 million in 2018 and $20 million thereafter. This results in these amounts being recognized over a weighted-average period of 2.0 years.
For all share-based payment awards, the expense recognized has been adjusted for estimated forfeitures where the requisite service is not expected to be provided. Estimated forfeiture rates are developed based on the Company’s analysis of historical forfeiture data for homogeneous employee groups.
General terms and methods of valuation for the Company’s share-based awards are as follows:
Stock Options
Stock options have terms of seven or 10 years, with one-third of each grant vesting each year for three years, and are assigned an exercise price equal to the closing market price of a share of the Company’s common stock on the date of grant. Options are expensed on a straight-line basis over the grant vesting period, which is considered to be the requisite service period.
The fair value of each option grant is estimated on the date of grant using the Black-Scholes option-pricing model. When determining expected volatility, the Company considers the historical volatility of the Company’s stock price, as well as implied volatility. The risk-free interest rate is based on the U.S. Treasury yield curve in effect at the time of grant, based on the options’ expected term. The expected term of the options is based on the Company’s evaluation of option holders’ exercise patterns and represents the period of time that options are expected to remain unexercised. The Company uses historical data to estimate the timing and amount of forfeitures. The weighted average assumptions used in the Black-Scholes option-pricing model and weighted-average grant date fair value for options granted in 2016, 2015, and 2014 are as follows:
|
| |||||||||||
|
|
|
|
|
|
|
|
|
|
|
|
|
|
| 2016 |
|
| 2015 |
|
| 2014 |
| |||
| Weighted-average assumptions used: |
|
|
|
|
| ||||||
| Expected volatility | 24.0 | % |
| 31.3 | % |
| 34.2 | % | |||
| Dividend yield | 1.66 | % |
| 1.69 | % |
| 1.73 | % | |||
| Risk-free interest rate | 1.42 | % |
| 1.99 | % |
| 2.26 | % | |||
| Expected term, in years | 6.44 |
|
| 7.00 |
|
| 7.00 |
| |||
|
|
|
|
|
|
| ||||||
| Weighted-average grant date fair value | $ | 15.00 |
|
| $ | 20.27 |
|
| $ | 17.00 |
|
The total intrinsic value of options exercised, representing the difference between the exercise price and the market price on the date of exercise, was approximately $73 million, $68 million and $62 million in 2016, 2015 and 2014, respectively.
Transactions related to stock options for the year ended February 3, 2017 are summarized as follows:
|
| |||||||||||||||||||
|
|
|
|
|
|
|
|
|
|
|
|
|
| |||||||
|
| Shares (In thousands) |
|
| Weighted-Average Exercise Price Per Share |
|
| Weighted-Average Remaining Term (In years) |
| Aggregate Intrinsic Value (In thousands) |
| |||||||||
| Outstanding at January 29, 2016 | 5,431 |
|
| $ | 42.18 |
|
|
|
|
| |||||||||
| Granted | 822 |
|
| 71.47 |
|
|
|
|
| ||||||||||
| Canceled, forfeited or expired | (306 | ) |
| 64.52 |
|
|
|
|
| ||||||||||
| Exercised | (1,708 | ) |
| 33.26 |
|
|
|
|
| ||||||||||
| Outstanding at February 3, 2017 | 4,239 |
|
| $ | 49.84 |
|
| 6.34 |
| $ | 99,479 |
| |||||||
| Vested and expected to vest at February 3, 2017 1 | 4,166 |
|
| $ | 49.50 |
|
| 6.29 |
| $ | 99,190 |
| |||||||
| Exercisable at February 3, 2017 | 2,693 |
|
| $ | 40.35 |
|
| 4.92 |
| $ | 88,714 |
| |||||||
|
|
| ||||||||||||||||||
| 1 | Includes outstanding vested options as well as outstanding nonvested options after a forfeiture rate is applied. | ||||||||||||||||||
59
Table of Contents
Restricted Stock Awards
Restricted stock awards are valued at the market price of a share of the Company’s common stock on the date of grant. In general, these awards vest at the end of a three year period from the date of grant and are expensed on a straight-line basis over that period, which is considered to be the requisite service period. The Company uses historical data to estimate the timing and amount of forfeitures. The weighted-average grant-date fair value per share of restricted stock awards granted was $71.35, $69.44 and $53.13 in 2016, 2015, and 2014, respectively. The total fair value of restricted stock awards vesting was approximately $151 million, $144 million and $114 million in 2016, 2015 and 2014, respectively.
Transactions related to restricted stock awards for the year ended February 3, 2017 are summarized as follows:
|
| |||||||
|
|
|
|
|
|
|
| |
|
| Shares (In thousands) |
|
| Weighted-Average Grant-Date Fair Value Per Share |
| ||
| Nonvested at January 29, 2016 | 4,211 |
|
| $ | 51.06 |
| |
| Granted | 935 |
|
| 71.35 |
| ||
| Vested | (2,142 | ) |
| 42.18 |
| ||
| Canceled or forfeited | (323 | ) |
| 59.47 |
| ||
| Nonvested at February 3, 2017 | 2,681 |
|
| $ | 64.22 |
| |
Deferred Stock Units
Deferred stock units are valued at the market price of a share of the Company’s common stock on the date of grant. For non-employee Directors, these awards vest immediately and are expensed on the grant date. During 2016, 2015 and 2014, each non-employee Director was awarded a number of deferred stock units determined by dividing the annual award amount by the fair market value of a share of the Company’s common stock on the award date and rounding up to the next 100 units. The annual award amount used to determine the number of deferred stock units granted to each Director was $150,000 for 2016, 2015, and 2014. During 2016, 19,000 deferred stock units were granted and immediately vested for non-employee Directors. The weighted-average grant-date fair value per share of deferred stock units granted was $80.35, $69.98 and $47.08 in 2016, 2015 and 2014, respectively. The total fair value of deferred stock units vested was $1.5 million in 2016, 2015, and 2014. During 2016, 0.1 million of fully vested deferred stock units were released as a result of termination of service. At February 3, 2017, there were 0.4 million deferred stock units outstanding, all of which were vested.
Performance Share Units
The Company has issued two types of performance share units - those classified as equity awards and those classified as liability awards. Expense is recognized on a straight-line basis over the requisite service period, based on the probability of achieving the performance condition, with changes in expectations recognized as an adjustment to earnings in the period of the change. Compensation cost is not recognized for performance share units that do not vest because service or performance conditions are not satisfied and any previously recognized compensation cost is reversed. Performance share units do not have dividend rights. The Company uses historical data to estimate the timing and amount of forfeitures.
Awards Classified as Equity
The Company’s performance share units classified as equity contain performance and service conditions that must be satisfied for an employee to earn the right to benefit from the award. The performance condition is primarily based on the achievement of the Company’s target return on non-cash average assets (RONCAA). These awards are valued at the market price of a share of the Company’s common stock on the date of grant less the present value of dividends expected during the requisite service period.
In fiscal 2016, the Company began issuing performance share units that contain a market condition modifier, in addition to having a performance and service condition. The performance condition for these awards continues to be based primarily on the achievement of the Company’s RONCAA targets. The market condition is based on the Company’s total shareholder return (TSR) compared to the median TSR of companies listed in the S&P 500 Index over a three year performance period. The Company used a Monte-Carlo simulation to determine the grant date fair value for these awards, which takes into consideration the possible outcomes pertaining to the TSR market condition. The following weighted-average assumptions were used in the Monte Carlo simulations for these awards granted in 2016: expected volatility of 21.4%, dividend yield of 1.53%, risk-free interest rate of 0.88%, and an expected term of 2.82 years.
60
Table of Contents
In general, 0% to 200% of the Company’s performance share units vest at the end of a three year service period from the date of grant based upon achievement of the performance condition, or a combination of the performance and market conditions, specified in the performance share unit agreement.
The weighted-average grant-date fair value per unit of performance share units classified as equity awards granted was $77.58, $71.52 and $47.05 in 2016, 2015 and 2014, respectively. The total fair value of performance share units vesting was approximately $24 million and $25 million in 2016 and 2015, respectively. No performance share units vested in 2014.
Transactions related to performance share units classified as equity awards for the year ended February 3, 2017 are summarized as follows:
|
| ||||||||
|
|
|
|
|
|
|
| ||
|
| Units (In thousands) 1 |
|
| Weighted-Average Grant-Date Fair Value Per Unit |
| |||
| Nonvested at January 29, 2016 | 792 |
|
| $ | 50.93 |
| ||
| Granted | 339 |
|
| 77.58 |
| |||
| Vested | (256 | ) |
| 36.52 |
| |||
| Canceled or forfeited | (152 | ) |
| 66.33 |
| |||
| Nonvested at February 3, 2017 | 723 |
|
| $ | 65.30 |
| ||
|
|
| |||||||
| ¹ | The number of units presented is based on achieving the targeted performance goals as defined in the performance share unit agreements. As of February 3, 2017, the maximum number of nonvested units that could vest under the provisions of the agreements was 1.2 million for the RONCAA awards. | |||||||
Awards Classified as Liabilities
Performance share units classified as liability awards are based on targeted Company improvement in brand differentiation, which is not considered a market, performance, or service related condition, are measured at fair value at each reporting date. No performance share units classified as liability awards were granted in 2016, 2015, or 2014. The total fair value of performance share units vesting was approximately $14 million in 2016. No performance share units vested in 2015 or 2014. No performance share units were classified as liability awards at February 3, 2017.
Transactions related to performance share units classified as liability awards for the year ended February 3, 2017 are summarized as follows:
|
| ||||||||
|
|
|
|
|
|
|
| ||
|
| Units (In thousands) 1 |
|
| Weighted-Average Grant-Date Fair Value Per Unit |
| |||
| Nonvested at January 29, 2016 | 127 |
|
| $ | 36.47 |
| ||
| Vested | (126 | ) |
| 36.47 |
| |||
| Canceled or forfeited | (1 | ) |
| 36.47 |
| |||
| Nonvested at February 3, 2017 | — |
|
| $ | — |
| ||
|
|
| |||||||
| ¹ | The number of units presented is based on achieving the targeted performance goals as defined in the performance share unit agreements. For the year ended February 3, 2017, the actual number of units that vested under the provisions of the agreements was 0.2 million units for the brand differentiation awards. | |||||||
Restricted Stock Units
Restricted stock units do not have dividend rights and are valued at the market price of a share of the Company’s common stock on the date of grant less the present value of dividends expected during the requisite service period. In general, these awards vest at the end of a three year period from the date of grant and are expensed on a straight-line basis over that period, which is considered to be the requisite service period. The Company uses historical data to estimate the timing and amount of forfeitures. The weighted-average grant-date fair value per share of restricted stock units granted was $67.26, $66.24 and $50.48 in 2016, 2015 and 2014, respectively. The total fair value of restricted stock units vesting was approximately $7.7 million, $3.5 million, and $1.6 million in 2016, 2015 and 2014, respectively.
61
Table of Contents
Transactions related to restricted stock units for the year ended February 3, 2017 are summarized as follows:
|
| ||||||
|
|
|
|
|
|
|
|
|
| Shares (In thousands) |
|
| Weighted-Average Grant-Date Fair Value Per Share |
| |
| Nonvested at January 29, 2016 | 314 |
|
| $ | 52.52 |
|
| Granted | 178 |
|
| 67.26 |
| |
| Vested | (107 | ) |
| 41.80 |
| |
| Canceled or forfeited | (62 | ) |
| 59.68 |
| |
| Nonvested at February 3, 2017 | 323 |
|
| $ | 62.85 |
|
ESPP
The purchase price of the shares under the ESPP equals 85% of the closing price on the date of purchase. The Company’s share-based payment expense per share is equal to 15% of the closing price on the date of purchase. The ESPP is considered a liability award and is measured at fair value at each reporting date, and the share-based payment expense is recognized over the six-month offering period. During 2016, the Company issued 1.3 million shares of common stock and recognized $15 million of share-based payment expense pursuant to the plan.
NOTE 11: Employee Retirement Plans
The Company maintains a defined contribution retirement plan for eligible employees (the 401(k) Plan). Eligible employees may participate in the 401(k) Plan six months after their original date of service. Eligible employees hired or rehired prior to November 1, 2012, were automatically enrolled in the 401(k) Plan at a contribution rate of 1% of their pre-tax annual compensation unless they elected otherwise. Eligible employees hired or rehired November 1, 2012, or later must make an active election to participate in the 401(k) Plan. The Company makes contributions to the 401(k) Plan each payroll period, based upon a matching formula applied to employee deferrals (the Company Match). Participants are eligible to receive the Company Match pursuant to the terms of the 401(k) Plan. The Company Match varies based on how much the employee elects to defer up to a maximum of 4.25% of eligible compensation. The Company Match is invested identically to employee contributions and is immediately vested.
The Company maintains a Benefit Restoration Plan to supplement benefits provided under the 401(k) Plan to participants whose benefits are restricted as a result of certain provisions of the Internal Revenue Code of 1986. This plan provides for employee salary deferrals and employer contributions in the form of a Company Match.
The Company maintains a non-qualified deferred compensation program called the Lowe’s Cash Deferral Plan. This plan is designed to permit certain employees to defer receipt of portions of their compensation, thereby delaying taxation on the deferral amount and on subsequent earnings until the balance is distributed. This plan does not provide for Company contributions.
The Company recognized expense associated with employee retirement plans of $180 million, $155 million and $154 million in 2016, 2015 and 2014, respectively.
NOTE 12: Income Taxes
The following is a reconciliation of the federal statutory tax rate to the effective tax rate:
|
| ||||||||
|
|
|
|
|
|
|
|
|
|
|
| 2016 |
|
| 2015 |
|
| 2014 |
|
| Statutory federal income tax rate | 35.0 | % |
| 35.0 | % |
| 35.0 | % |
| State income taxes, net of federal tax benefit | 3.6 |
|
| 3.6 |
|
| 3.3 |
|
| Valuation allowance - impairment | 2.0 |
|
| 4.2 |
|
| — |
|
| Other, net | (0.1 | ) |
| (0.4 | ) |
| (1.4 | ) |
| Effective tax rate | 40.5 | % |
| 42.4 | % |
| 36.9 | % |
62
Table of Contents
The components of the income tax provision are as follows:
|
| ||||||||||||||||
|
|
|
|
|
|
|
|
|
|
|
|
| |||||
| (In millions) | 2016 |
|
| 2015 |
|
| 2014 |
| ||||||||
| Current: |
|
|
|
|
| |||||||||||
| Federal | $ | 1,824 |
|
| $ | 1,688 |
|
| $ | 1,475 |
| |||||
| State | 275 |
|
| 248 |
|
| 221 |
| ||||||||
| Total current 1 | 2,099 |
|
| 1,936 |
|
| 1,696 |
| ||||||||
| Deferred: |
|
|
|
|
| |||||||||||
| Federal | 6 |
|
| (59 | ) |
| (112 | ) | ||||||||
| State | 3 |
|
| (4 | ) |
| (6 | ) | ||||||||
| Total deferred 1 | 9 |
|
| (63 | ) |
| (118 | ) | ||||||||
| Total income tax provision | $ | 2,108 |
|
| $ | 1,873 |
|
| $ | 1,578 |
| |||||
|
|
| |||||||||||||||
| 1 | Amounts applicable to foreign income taxes were insignificant for all periods presented. | |||||||||||||||
The tax effects of cumulative temporary differences that gave rise to the deferred tax assets and liabilities were as follows:
|
| |||||||||||
|
|
|
|
|
|
|
|
| ||||
| (In millions) | February 3, 2017 |
|
| January 29, 2016 |
| ||||||
| Deferred tax assets: |
|
|
| ||||||||
| Self-insurance | $ | 352 |
|
| $ | 369 |
| ||||
| Share-based payment expense | 69 |
|
| 83 |
| ||||||
| Deferred rent | 78 |
|
| 91 |
| ||||||
| Impairment of investment | 381 |
|
| 270 |
| ||||||
| Foreign currency translation | — |
|
| 107 |
| ||||||
| Net operating losses | 174 |
|
| 159 |
| ||||||
| Other, net | 175 |
|
| 156 |
| ||||||
| Total deferred tax assets | 1,229 |
|
| 1,235 |
| ||||||
| Valuation allowance | (578 | ) |
| (447 | ) | ||||||
| Net deferred tax assets | 651 |
|
| 788 |
| ||||||
|
|
|
|
| ||||||||
| Deferred tax liabilities: |
|
|
| ||||||||
| Property | (417 | ) |
| (507 | ) | ||||||
| Other, net | (34 | ) |
| (40 | ) | ||||||
| Total deferred tax liabilities | (451 | ) |
| (547 | ) | ||||||
|
|
|
|
| ||||||||
| Net deferred tax asset | $ | 200 |
|
| $ | 241 |
| ||||
As of February 3, 2017, the Company reported a deferred tax asset of $381 million related to its intention to exit from the Company’s joint venture investment in Australia. The Company established a full valuation allowance against the deferred tax asset related to these losses generated from impairments and equity method losses. These losses are collectively considered capital losses, having a five year carryforward period, once realized, and can only be used to offset capital gain income. No present or future capital gains have been identified through which this deferred tax asset can be realized.
In December 2016, the U.S. Treasury Department and the U.S. Internal Revenue Service issued final and temporary regulations under Internal Revenue Code Section 987 (the Regulations). The Regulations provide guidance on the taxation of foreign currency gains and losses arising from qualified business units that operate in a currency other than the currency of their owner. As a result of the newly enacted guidance, net deferred tax assets were reduced by $33 million as of February 3, 2017.
The Company operates as a branch in various foreign jurisdictions and cumulatively has incurred net operating losses of $640 million and $580 million as of February 3, 2017, and January 29, 2016, respectively. These net operating losses are subject to expiration in 2017 through 2036. Deferred tax assets have been established for these foreign net operating losses in the accompanying consolidated balance sheets. Given the uncertainty regarding the realization of the foreign net deferred tax
63
Table of Contents
assets, the Company recorded cumulative valuation allowances of $197 million and $177 million as of February 3, 2017, and January 29, 2016, respectively.
The Company has not provided for deferred income taxes on accumulated but undistributed earnings of the Company’s foreign operations of approximately $163 million and $153 million as of February 3, 2017, and January 29, 2016, respectively, due to its intention to permanently reinvest these earnings outside the U.S. It is not practicable to determine the income tax liability that would be payable on these earnings. The Company will provide for deferred or current income taxes on such earnings in the period it determines it is necessary to remit those earnings.
A reconciliation of the beginning and ending balances of unrecognized tax benefits is as follows:
|
| ||||||||||||||||||
|
|
|
|
|
|
|
|
|
|
|
|
| |||||||
| (In millions) | 2016 |
|
| 2015 |
|
| 2014 |
| ||||||||||
| Unrecognized tax benefits, beginning of year | $ |
|
| $ |
|
| $ | 62 |
| |||||||||
| Additions for tax positions of prior years | 3 |
|
| — |
|
| 2 |
| ||||||||||
| Reductions for tax positions of prior years | — |
|
| (2 | ) |
| (57 | ) | ||||||||||
| Settlements | — |
|
| (2 | ) |
| — |
| ||||||||||
| Unrecognized tax benefits, end of year | $ |
|
| $ |
|
| $ |
| ||||||||||
The amounts of unrecognized tax benefits that, if recognized, would favorably impact the effective tax rate were $5 million and $2 million as of February 3, 2017, and January 29, 2016, respectively.
The Company recognized $2 million of interest expense related to uncertain tax positions during 2016. The Company recognized $1 million of interest income related to uncertain tax positions during 2015 and 2014. As of February 3, 2017 and January 29, 2016, the Company had accrued interest related to uncertain tax positions of $3 million and $1 million, respectively. Penalties recognized related to uncertain tax positions were insignificant for 2016, 2015, and 2014. Accrued penalties were also insignificant as of February 3, 2017 and January 29, 2016.
The Company is subject to examination by various foreign and domestic taxing authorities. It is reasonably possible that the Company will resolve $3 million in state related audit items within the next 12 months. There are ongoing U.S. state audits covering tax years 2008 to 2015. An audit of the Company’s Canadian operations by the Canada Revenue Agency for fiscal years 2011 and 2012 was started during 2016. The Company remains subject to income tax examinations for international income taxes for fiscal years 2007 through 2015. The Company believes appropriate provisions for all outstanding issues have been made for all jurisdictions and all open years.
Note 13: Earnings Per Share
The Company calculates basic and diluted earnings per common share using the two-class method. Under the two-class method, net earnings are allocated to each class of common stock and participating security as if all of the net earnings for the period had been distributed. The Company’s participating securities consist of share-based payment awards that contain a nonforfeitable right to receive dividends and, therefore, are considered to participate in undistributed earnings with common shareholders.
64
Table of Contents
Basic earnings per common share excludes dilution and is calculated by dividing net earnings allocable to common shares by the weighted-average number of common shares outstanding for the period. Diluted earnings per common share is calculated by dividing net earnings allocable to common shares by the weighted-average number of common shares as of the balance sheet date, as adjusted for the potential dilutive effect of non-participating share-based awards. The following table reconciles earnings per common share for 2016, 2015 and 2014:
|
| |||||||||||
|
|
|
|
|
|
|
|
|
|
|
|
|
| (In millions, except per share data) | 2016 |
|
| 2015 |
|
| 2014 |
| |||
| Basic earnings per common share: |
|
|
|
|
| ||||||
| Net earnings attributable to Lowe's Companies, Inc. | $ | 3,091 |
|
| $ | 2,546 |
|
| $ | 2,698 |
|
| Less: Net earnings allocable to participating securities | (11 | ) |
| (12 | ) |
| (16 | ) | |||
| Less: Premium paid to acquire noncontrolling interest | (18 | ) |
| — |
|
| — |
| |||
| Net earnings allocable to common shares, basic | $ | 3,062 |
|
| $ | 2,534 |
|
| $ | 2,682 |
|
| Weighted-average common shares outstanding | 880 |
|
| 927 |
|
| 988 |
| |||
| Basic earnings per common share | $ | 3.48 |
|
| $ | 2.73 |
|
| $ | 2.71 |
|
| Diluted earnings per common share: |
|
|
|
|
| ||||||
| Net earnings attributable to Lowe's Companies, Inc. | $ | 3,091 |
|
| $ | 2,546 |
|
| $ | 2,698 |
|
| Less: Net earnings allocable to participating securities | (11 | ) |
| (12 | ) |
| (16 | ) | |||
| Less: Premium paid to acquire noncontrolling interest | (18 | ) |
| — |
|
| — |
| |||
| Net earnings allocable to common shares, diluted | $ | 3,062 |
|
| $ | 2,534 |
|
| $ | 2,682 |
|
| Weighted-average common shares outstanding | 880 |
|
| 927 |
|
| 988 |
| |||
| Dilutive effect of non-participating share-based awards | 1 |
|
| 2 |
|
| 2 |
| |||
| Weighted-average common shares, as adjusted | 881 |
|
| 929 |
|
| 990 |
| |||
| Diluted earnings per common share | $ | 3.47 |
|
| $ | 2.73 |
|
| $ | 2.71 |
|
As discussed in Note 2 to the consolidated financial statements, the Company paid RONA’s preferred shareholders a premium to acquire the remaining noncontrolling interest in RONA during the fourth quarter of fiscal 2016. The premium paid was accounted for as a capital transaction and as such, no loss was recognized in the Company’s consolidated financial statements. However, the premium paid represents a return on investment to RONA’s preferred shareholders and is not available to common shareholders. Therefore, the premium paid to acquire the remaining noncontrolling interest is reflected in the table above as a deduction from net earnings to compute net earnings allocable to common shares.
Stock options to purchase 1.0 million, 0.3 million and 0.6 million shares of common stock for 2016, 2015 and 2014, respectively, were excluded from the computation of diluted earnings per common share because their effect would have been anti-dilutive.
NOTE 14: Leases
The Company leases facilities and land for certain facilities under agreements with original terms generally of 20 years. The leases generally contain provisions for four to six renewal options of five years each. Some lease agreements also provide for contingent rentals based on sales performance in excess of specified minimums or on changes in the consumer price index. Contingent rentals were not significant for any of the periods presented. The Company subleases certain properties that are not used in its operations. Sublease income was not significant for any of the periods presented.
65
Table of Contents
The future minimum rental payments required under operating leases and capitalized lease obligations having initial or remaining non-cancelable lease terms in excess of one year are summarized as follows:
|
| |||||||||||||||||||
|
|
|
|
|
|
|
|
|
|
|
|
| ||||||||
| (In millions) Fiscal Year | Operating Leases |
|
| Capitalized Lease Obligations |
|
| Total |
| |||||||||||
| 2017 | $ | 617 |
|
| $ | 87 |
|
| $ | 704 |
| ||||||||
| 2018 | 590 |
|
| 102 |
|
| 692 |
| |||||||||||
| 2019 | 550 |
|
| 158 |
|
| 708 |
| |||||||||||
| 2020 | 508 |
|
| 81 |
|
| 589 |
| |||||||||||
| 2021 | 466 |
|
| 84 |
|
| 550 |
| |||||||||||
| Later years | 3,122 |
|
| 942 |
|
| 4,064 |
| |||||||||||
| Total minimum lease payments | $ | 5,853 |
|
| $ | 1,454 |
|
| $ | 7,307 |
| ||||||||
| Less amount representing interest |
|
| (593 | ) |
|
| |||||||||||||
| Present value of minimum lease payments |
|
| 861 |
|
|
| |||||||||||||
| Less current maturities |
|
| (46 | ) |
|
| |||||||||||||
| Present value of minimum lease payments, less current maturities |
|
| $ | 815 |
|
|
| ||||||||||||
Rental expenses under operating leases were $549 million, $473 million and $445 million in 2016, 2015 and 2014, respectively, and were recognized within SG&A expense. Excluded from these amounts are rental expenses associated with closed locations which were recognized as exit costs in the period of closure.
NOTE 15: Commitments and Contingencies
The Company is, from time to time, party to various legal proceedings considered to be in the normal course of business, none of which, individually or in the aggregate, are expected to be material to the Company’s financial statements. In evaluating liabilities associated with its various legal proceedings, the Company has accrued for probable liabilities associated with these matters. The amounts accrued were not material to the Company’s consolidated financial statements in any of the years presented. Reasonably possible losses for any of the individual legal proceedings which have not been accrued were not material to the Company’s consolidated financial statements.
As of February 3, 2017, the Company had non-cancelable commitments of $1.4 billion related to certain marketing and information technology programs, and purchases of merchandise inventory. Payments under these commitments are scheduled to be made as follows: 2017, $876 million; 2018, $255 million; 2019, $138 million; 2020, $94 million; 2021, $45 million; thereafter, $1 million.
At February 3, 2017, the Company held standby and documentary letters of credit issued under banking arrangements which totaled $67 million. The majority of the Company’s letters of credit were issued for insurance contracts.
NOTE 16: Related Parties
A member of the Company’s Board of Directors also serves on the Board of Directors of a vendor that provides branded consumer packaged goods to the Company. The Company purchased products from this vendor in the amount of $124 million in 2016, $153 million in 2015, and $151 million in 2014. Amounts payable to this vendor were insignificant at February 3, 2017 and January 29, 2016.
A member of the Company’s Board of Directors also serves on the Board of Directors of a vendor that provides certain services to the Company related to health and welfare benefit plans. The Company made payments to this vendor in the amount of $59 million in 2016, $58 million in 2015, and $56 million in 2014. Amounts payable to this vendor were insignificant at February 3, 2017 and January 29, 2016.
A brother-in-law of the Company’s former Chief Customer Officer was a senior officer and shareholder of a vendor that provides millwork and other building products to the Company. This was no longer considered a related party relationship in 2015. The Company purchased products from this vendor in the amount of $80 million in 2014.
66
Table of Contents
NOTE 17: Other Information
Net interest expense is comprised of the following:
|
| |||||||||||
|
|
|
|
|
|
|
|
|
|
|
|
|
| (In millions) | 2016 |
|
| 2015 |
|
| 2014 |
| |||
| Long-term debt | $ | 583 |
|
| $ | 505 |
|
| $ | 470 |
|
| Capitalized lease obligations | 53 |
|
| 42 |
|
| 42 |
| |||
| Interest income | (12 | ) |
| (4 | ) |
| (6 | ) | |||
| Interest capitalized | (4 | ) |
| (3 | ) |
| (2 | ) | |||
| Interest on tax uncertainties | 2 |
|
| (1 | ) |
| (1 | ) | |||
| Other | 23 |
|
| 13 |
|
| 13 |
| |||
| Interest - net | $ | 645 |
|
| $ | 552 |
|
| $ | 516 |
|
Supplemental disclosures of cash flow information:
|
| |||||||||||
|
|
|
|
|
|
|
|
|
|
|
|
|
| (In millions) | 2016 |
|
| 2015 |
|
| 2014 |
| |||
| Cash paid for interest, net of amount capitalized | $ | 619 |
|
| $ | 535 |
|
| $ | 504 |
|
| Cash paid for income taxes, net | $ | 2,217 |
|
| $ | 2,055 |
|
| $ | 1,534 |
|
| Non-cash investing and financing activities: |
|
|
|
|
| ||||||
| Non-cash property acquisitions, including assets acquired under capital lease | $ | 86 |
|
| $ | 102 |
|
| $ | 44 |
|
| Cash dividends declared but not paid | $ | 304 |
|
| $ | 255 |
|
| $ | 222 |
|
Sales by product category:
|
| |||||||||||||||||||||||||
|
|
|
|
|
|
|
|
|
|
|
|
|
|
|
|
|
|
|
|
|
| |||||
|
| 2016 |
| 2015 1 |
| 2014 1 | ||||||||||||||||||||
| (Dollars in millions) | Total Sales |
|
| % |
|
| Total Sales |
|
| % |
|
| Total Sales |
|
| % |
| ||||||||
| Lumber & Building Materials | $ | 8,399 |
|
| 13 | % |
| $ | 6,891 |
|
| 12 | % |
| $ | 6,667 |
|
| 12 | % | |||||
| Tools & Hardware | 7,220 |
|
| 11 |
|
| 6,500 |
|
| 11 |
|
| 6,188 |
|
| 11 |
| ||||||||
| Appliances | 7,037 |
|
| 11 |
|
| 6,477 |
|
| 11 |
|
| 5,710 |
|
| 10 |
| ||||||||
| Fashion Fixtures | 6,307 |
|
| 10 |
|
| 5,809 |
|
| 10 |
|
| 5,596 |
|
| 10 |
| ||||||||
| Rough Plumbing & Electrical | 5,744 |
|
| 9 |
|
| 5,211 |
|
| 9 |
|
| 4,988 |
|
| 9 |
| ||||||||
| Seasonal Living | 4,253 |
|
| 7 |
|
| 3,952 |
|
| 7 |
|
| 3,735 |
|
| 7 |
| ||||||||
| Lawn & Garden | 4,192 |
|
| 6 |
|
| 3,878 |
|
| 6 |
|
| 3,770 |
|
| 7 |
| ||||||||
| Paint | 4,053 |
|
| 6 |
|
| 3,712 |
|
| 6 |
|
| 3,616 |
|
| 6 |
| ||||||||
| Millwork | 3,729 |
|
| 6 |
|
| 3,504 |
|
| 6 |
|
| 3,360 |
|
| 6 |
| ||||||||
| Flooring | 3,662 |
|
| 6 |
|
| 3,333 |
|
| 6 |
|
| 3,213 |
|
| 6 |
| ||||||||
| Kitchens | 3,524 |
|
| 5 |
|
| 3,271 |
|
| 5 |
|
| 3,163 |
|
| 5 |
| ||||||||
| Outdoor Power Equipment | 3,493 |
|
| 5 |
|
| 3,378 |
|
| 6 |
|
| 3,193 |
|
| 6 |
| ||||||||
| Home Fashions | 2,611 |
|
| 4 |
|
| 2,480 |
|
| 4 |
|
| 2,425 |
|
| 4 |
| ||||||||
| Other | 793 |
|
| 1 |
|
| 678 |
|
| 1 |
|
| 599 |
|
| 1 |
| ||||||||
| Totals | $ | 65,017 |
|
| 100 | % |
| $ | 59,074 |
|
| 100 | % |
| $ | 56,223 |
|
| 100 | % | |||||
|
|
| ||||||||||||||||||||||||
| 1 | Certain prior period amounts have been reclassified to conform to current product category classifications. | ||||||||||||||||||||||||
NOTE 18: Derivative Instruments
In February 2016, the Company entered into an option to purchase 3.2 billion Canadian dollars in order to manage the foreign currency exchange rate risk on the consideration to be paid for the RONA acquisition. This option contract was not accounted for as a hedging instrument, and gains and losses resulting from changes in fair value and settlement were included in selling, general and administrative expense in the accompanying consolidated statements of current and retained earnings. The cash flows related to this option were included within investing activities in the accompanying consolidated statements of cash flows.
67
Table of Contents
The premium paid for the foreign currency exchange option contract was $103 million. The option contract was settled during the second quarter of fiscal year 2016 for $179 million, resulting in a total realized gain of $76 million for the year ended February 3, 2017.
The Company’s other derivative instruments, and related activity, were not material in any of the periods presented.
68
Table of Contents
SUPPLEMENTARY DATA
Selected Quarterly Data (UNAUDITED)
The following table summarizes the quarterly consolidated results of operations for 2016 and 2015:
|
| |||||||||||||||||||||||||||||||
|
|
|
|
|
|
|
|
|
|
|
|
|
|
|
|
|
| |||||||||||||||
|
| 2016 |
| |||||||||||||||||||||||||||||
| (In millions, except per share data) | First |
|
| Second |
|
| Third |
|
| Fourth 1 |
|
| |||||||||||||||||||
| Net sales | $ | 15,234 |
|
| $ | 18,260 |
|
| $ | 15,739 |
|
| $ | 15,784 |
|
| |||||||||||||||
| Gross margin | 5,337 |
|
| 6,288 |
|
| 5,407 |
|
| 5,432 |
|
| |||||||||||||||||||
| Net earnings | 884 |
|
| 1,167 |
|
| 379 |
|
| 663 |
|
| |||||||||||||||||||
| Basic earnings per common share | 0.98 |
|
| 1.32 |
|
| 0.43 |
|
| 0.74 |
|
| |||||||||||||||||||
| Diluted earnings per common share | $ | 0.98 |
|
| $ | 1.31 |
|
| $ | 0.43 |
|
| $ | 0.74 |
|
| |||||||||||||||
|
|
|
|
|
|
|
|
|
| |||||||||||||||||||||||
|
| 2015 |
| |||||||||||||||||||||||||||||
| (In millions, except per share data) | First |
|
| Second |
|
| Third |
|
| Fourth |
|
| |||||||||||||||||||
| Net sales | $ | 14,129 |
|
| $ | 17,348 |
|
| $ | 14,360 |
|
| $ | 13,236 |
|
| |||||||||||||||
| Gross margin | 5,012 |
|
| 5,981 |
|
| 4,990 |
|
| 4,588 |
|
| |||||||||||||||||||
| Net earnings | 673 |
|
| 1,126 |
|
| 736 |
|
| 11 |
| 2 | |||||||||||||||||||
| Basic earnings per common share | 0.70 |
|
| 1.20 |
|
| 0.80 |
|
| 0.01 |
|
| |||||||||||||||||||
| Diluted earnings per common share | $ | 0.70 |
|
| $ | 1.20 |
|
| $ | 0.80 |
|
| $ | 0.01 |
|
| |||||||||||||||
|
|
| ||||||||||||||||||||||||||||||
| 1 | The fourth quarter of fiscal 2016 contained an additional week. | ||||||||||||||||||||||||||||||
|
|
| ||||||||||||||||||||||||||||||
| 2 | During the fourth quarter, the Company decided to exit its Australian joint venture investment with Woolworths and recorded a $530 million impairment of its equity method investment due to the determination that there was a decrease in value that was other than temporary. | ||||||||||||||||||||||||||||||
Item 9 - Changes in and Disagreements with Accountants on Accounting and Financial Disclosure
None.
Item 9A - Controls and Procedures
The Company’s management, with the participation of the Chief Executive Officer and Chief Financial Officer, has evaluated the effectiveness of the Company’s “disclosure controls and procedures”, (as such term is defined in Rule 13a-15(e) promulgated under the Securities Exchange Act of 1934, as amended, (the Exchange Act)). Based upon their evaluation, the Chief Executive Officer and Chief Financial Officer concluded that, as of the end of the period covered by this Annual Report, the Company’s disclosure controls and procedures were effective for the purpose of ensuring that the information required to be disclosed in the reports that the Company files or submits under the Exchange Act with the Securities and Exchange Commission (the SEC) (1) is recorded, processed, summarized and reported within the time periods specified in the SEC’s rules and forms, and (2) is accumulated and communicated to the Company’s management, including its principal executive and principal financial officers, as appropriate to allow timely decisions regarding required disclosure.
Management’s report on internal control over financial reporting (as such term is defined in Rule 13a-15(f) under the Exchange Act) and the report of Deloitte & Touche LLP, the Company’s independent registered public accounting firm, are included in Item 8 of this Annual Report.
In addition, no change in the Company’s internal control over financial reporting occurred during the fiscal fourth quarter ended February 3, 2017 that has materially affected, or is reasonably likely to materially affect, the Company’s internal control over financial reporting.
Item 9B - Other Information
None.
69
Table of Contents
Part III
Item 10 - Directors, Executive Officers and Corporate Governance
The information required by this item with respect to our executive officers appears in Part I of this Annual Report under the heading, “Executive Officers and Certain Significant Employees of the Registrant”. The other information required by this item is furnished by incorporation by reference to the information under the headings “Proposal 1: Election of Directors”, “Information About the Board of Directors and Committees of the Board”, “Section 16(a) Beneficial Ownership Reporting Compliance”, and “Additional Information - Shareholder Proposals for the 2018 Annual Meeting” in the definitive Proxy Statement for the 2017 annual meeting of shareholders, which will be filed with the SEC within 120 days after the fiscal year ended February 3, 2017 (the Proxy Statement).
We have adopted a written code of business conduct and ethics, which is intended to qualify as a “code of ethics” within the meaning of Item 406 of Regulation S-K of the Exchange Act, which we refer to as the Lowe’s Code of Business Conduct and Ethics (the Code). The Code applies to all employees of the Company, including our principal executive officer, principal financial officer, principal accounting officer or persons performing similar functions. The Code is designed to ensure that the Company’s business is conducted in a legal and ethical manner. The Code covers all areas of professional conduct, including compliance with laws and regulations, conflicts of interest, fair dealing among customers and suppliers, corporate opportunity, confidential information, insider trading, employee relations, and accounting complaints. The full text of the Code can be found on our website at www.Lowes.com, under the “About Lowe’s”, “Investor Relations”, and “Governance - Code of Business Conduct and Ethics” headings. You can also obtain a copy of the complete Code by contacting Investor Relations at 1-800-813-7613.
We will disclose information pertaining to amendments or waivers to provisions of the Code that apply to our principal executive officer, principal financial officer, principal accounting officer or persons performing similar functions and that relate to any element of the Code enumerated in the SEC rules and regulations by posting this information on our website at www.Lowes.com. The information on our website is not a part of this Annual Report and is not incorporated by reference in this report or any of our other filings with the SEC.
Item 11 - Executive Compensation
The information required by this item is furnished by incorporation by reference to the information under the headings “Information About the Board of Directors and Committees of the Board – Compensation of Directors”, “Compensation Discussion and Analysis”, and “Compensation Committee Report” in the Proxy Statement.
Item 12 - Security Ownership of Certain Beneficial Owners and Management and Related Stockholder Matters
The information required by this item is furnished by incorporation by reference to the information under the headings “Security Ownership of Certain Beneficial Owners and Management” and “Equity Compensation Plan Information” in the Proxy Statement.
Item 13 - Certain Relationships and Related Transactions, and Director Independence
The information required by this item is furnished by incorporation by reference to the information under the headings “Information About the Board of Directors and Committees of the Board – Director Independence”, “Related Person Transactions”, and “Appendix A: Categorical Standards for Determination of Director Independence” in the Proxy Statement.
Item 14 - Principal Accountant Fees and Services
The information required by this item is furnished by incorporation by reference to the information under the heading “Audit Matters – Fees Paid to the Independent Registered Public Accounting Firm” in the Proxy Statement.
70
Table of Contents
Part IV
Item 15 – Exhibits and Financial Statement Schedules
a) 1.Financial Statements
See the following items and page numbers appearing in Item 8 of this Annual Report:
|
| ||
|
|
|
|
|
|
| Page No. |
|
|
|
|
|
| Reports of Independent Registered Public Accounting Firm | 37 |
|
|
|
|
|
| Consolidated Statements of Earnings for each of the three fiscal years in the period ended February 3, 2017 | 39 |
|
|
|
|
|
| Consolidated Statements of Comprehensive Income for each of the three fiscal years in the period ended February 3, 2017 | 39 |
|
|
|
|
|
| Consolidated Balance Sheets at February 3, 2017 and January 29, 2016 | 40 |
|
|
|
|
|
| Consolidated Statements of Shareholders’ Equity for each of the three fiscal years in the period ended February 3, 2017 | 41 |
|
|
|
|
|
| Consolidated Statements of Cash Flows for each of the three fiscal years in the period ended February 3, 2017 | 42 |
|
|
|
|
|
| Notes to Consolidated Financial Statements for each of the three fiscal years in the period ended February 3, 2017 | 43 |
71
Table of Contents
2. Financial Statement Schedule
SCHEDULE II - VALUATION AND QUALIFYING ACCOUNTS AND RESERVES
|
| |||||||||||||||||||||||||||||||||
|
|
|
|
|
|
|
|
|
|
|
|
|
|
|
|
|
|
|
|
| ||||||||||||||
| (In millions) | Balance at beginning of period |
|
| Charges to costs and expenses |
|
|
|
| Deductions |
|
|
|
| Balance at end of period |
| ||||||||||||||||||
|
|
|
|
|
|
|
|
|
|
|
|
| ||||||||||||||||||||||
| February 3, 2017: |
|
|
|
|
|
|
|
|
|
|
| ||||||||||||||||||||||
| Reserve for loss on obsolete inventory | $ | 46 |
|
| $ | 13 |
|
| 1 |
| $ | — |
|
|
|
| $ | 59 |
| ||||||||||||||
| Reserve for inventory shrinkage | 171 |
|
| 397 |
|
|
|
| (379 | ) |
| 2 |
| 189 |
| ||||||||||||||||||
| Reserve for sales returns | 66 |
|
| 5 |
|
| 3 |
| — |
|
|
|
| 71 |
| ||||||||||||||||||
| Deferred tax valuation allowance | 447 |
|
| 131 |
|
| 4 |
| — |
|
|
|
| 578 |
| ||||||||||||||||||
| Self-insurance liabilities | 883 |
|
| 1,418 |
|
|
|
| (1,470 | ) |
| 5 |
| 831 |
| ||||||||||||||||||
| Reserve for exit activities | 67 |
|
| 47 |
|
|
|
| (48 | ) |
| 6 |
| 66 |
| ||||||||||||||||||
|
|
|
|
|
|
|
|
|
|
|
|
| ||||||||||||||||||||||
| January 29, 2016: |
|
|
|
|
|
|
|
|
|
|
| ||||||||||||||||||||||
| Reserve for loss on obsolete inventory | $ | 52 |
|
| $ | — |
|
|
|
| $ | (6 | ) |
| 1 |
| $ | 46 |
| ||||||||||||||
| Reserve for inventory shrinkage | 162 |
|
| 345 |
|
|
|
| (336 | ) |
| 2 |
| 171 |
| ||||||||||||||||||
| Reserve for sales returns | 65 |
|
| 1 |
|
| 3 |
| — |
|
|
|
| 66 |
| ||||||||||||||||||
| Deferred tax valuation allowance | 170 |
|
| 277 |
|
| 4 |
| — |
|
|
|
| 447 |
| ||||||||||||||||||
| Self-insurance liabilities | 905 |
|
| 1,357 |
|
|
|
| (1,379 | ) |
| 5 |
| 883 |
| ||||||||||||||||||
| Reserve for exit activities | 53 |
|
| 34 |
|
|
|
| (20 | ) |
| 6 |
| 67 |
| ||||||||||||||||||
|
|
|
|
|
|
|
|
|
|
|
|
| ||||||||||||||||||||||
| January 30, 2015: |
|
|
|
|
|
|
|
|
|
|
| ||||||||||||||||||||||
| Reserve for loss on obsolete inventory | $ | 68 |
|
| $ | — |
|
|
|
| $ | (16 | ) |
| 1 |
| $ | 52 |
| ||||||||||||||
| Reserve for inventory shrinkage | 158 |
|
| 326 |
|
|
|
| (322 | ) |
| 2 |
| 162 |
| ||||||||||||||||||
| Reserve for sales returns | 58 |
|
| 7 |
|
| 3 |
| — |
|
|
|
| 65 |
| ||||||||||||||||||
| Deferred tax valuation allowance | 164 |
|
| 6 |
|
| 4 |
| — |
|
|
|
| 170 |
| ||||||||||||||||||
| Self-insurance liabilities | 904 |
|
| 1,323 |
|
|
|
| (1,322 | ) |
| 5 |
| 905 |
| ||||||||||||||||||
| Reserve for exit activities | 54 |
|
| 14 |
|
|
|
| (15 | ) |
| 6 |
| 53 |
| ||||||||||||||||||
|
|
|
|
|
|
|
|
|
|
|
|
| ||||||||||||||||||||||
|
|
| ||||||||||||||||||||||||||||||||
| 1 | Represents the net increase/(decrease) in the required reserve based on the Company’s evaluation of obsolete inventory. | ||||||||||||||||||||||||||||||||
|
|
| ||||||||||||||||||||||||||||||||
| 2 | Represents the actual inventory shrinkage experienced at the time of physical inventories. | ||||||||||||||||||||||||||||||||
|
|
| ||||||||||||||||||||||||||||||||
| 3 | Represents the net increase in the required reserve based on the Company’s evaluation of anticipated merchandise returns. | ||||||||||||||||||||||||||||||||
|
|
| ||||||||||||||||||||||||||||||||
| 4 | Represents an increase in the required reserve based on the Company’s evaluation of deferred tax assets. | ||||||||||||||||||||||||||||||||
|
|
| ||||||||||||||||||||||||||||||||
| 5 | Represents claim payments for self-insured claims. | ||||||||||||||||||||||||||||||||
|
|
| ||||||||||||||||||||||||||||||||
| 6 | Represents lease payments, net of sublease income. | ||||||||||||||||||||||||||||||||
72
Table of Contents
3. Exhibits
|
|
| ||||||||||||
|
|
|
|
|
|
|
|
|
|
|
|
| ||
| Exhibit Number |
|
|
| Incorporated by Reference |
| ||||||||
|
| Exhibit Description |
| Form |
| File No. |
| Exhibit |
| Filing Date |
| |||
| 2.1 |
| Arrangement Agreement, dated as of February 2, 2016, among Lowe’s Companies, Inc., Lowe’s Companies Canada, ULC and RONA inc. (1) |
| 10-K |
| 001-07898 |
| 2.1 |
| March 29, 2016 |
| ||
|
|
|
|
|
|
|
|
|
|
|
|
| ||
| 3.1 |
| Restated Charter of Lowe’s Companies, Inc. |
| 10-Q |
| 001-07898 |
| 3.1 |
| September 1, 2009 |
| ||
|
|
|
|
|
|
|
|
|
|
|
|
| ||
| 3.2 |
| Bylaws of Lowe’s Companies, Inc., as amended and restated May 27, 2016. |
| 8-K |
| 001-07898 |
| 3.1 |
| May 31, 2016 |
| ||
|
|
|
|
|
|
|
|
|
|
|
|
| ||
| 4.1 |
| Indenture, dated as of April 15, 1992, between Lowe’s Companies, Inc. and U.S. Bank National Association, as successor trustee. |
| S-3 |
| 033-47269 |
| 4.1 |
| April 16, 1992 |
| ||
|
|
|
|
|
|
|
|
|
|
|
|
| ||
| 4.2 |
| Amended and Restated Indenture, dated as of December 1, 1995, between Lowe’s Companies, Inc. and U.S. Bank National Association, as successor trustee. |
| 8-K |
| 001-07898 |
| 4.1 |
| December 15, 1995 |
| ||
|
|
|
|
|
|
|
|
|
|
|
|
| ||
| 4.3 |
| Form of Lowe’s Companies, Inc.’s 6 7/8% Debentures due February 15, 2028. |
| 8-K |
| 001-07898 |
| 4.2 |
| February 20, 1998 |
| ||
|
|
|
|
|
|
|
|
|
|
|
|
| ||
| 4.4 |
| First Supplemental Indenture, dated as of February 23, 1999, to the Amended and Restated Indenture, dated as of December 1, 1995, between Lowe’s Companies, Inc. and U.S. Bank National Association, as successor trustee. |
| 10-K |
| 001-07898 |
| 10.13 |
| April 19, 1999 |
| ||
|
|
|
|
|
|
|
|
|
|
|
|
| ||
| 4.5 |
| Form of Lowe’s Companies, Inc.’s 6 1/2% Debentures due March 15, 2029. |
| 10-K |
| 001-07898 |
| 10.19 |
| April 19, 1999 |
| ||
|
|
|
|
|
|
|
|
|
|
|
|
| ||
| 4.6 |
| Third Supplemental Indenture, dated as of October 6, 2005, to the Amended and Restated Indenture, dated as of December 1, 1995, between Lowe’s Companies, Inc. and U.S. Bank National Association, as successor trustee, including as an exhibit thereto a form of Lowe’s Companies, Inc.’s 5.5% Notes maturing in October 2035. |
| 10-K |
| 001-07898 |
| 4.5 |
| April 3, 2007 |
| ||
|
|
|
|
|
|
|
|
|
|
|
|
| ||
| 4.7 |
| Fourth Supplemental Indenture, dated as of October 10, 2006, to the Amended and Restated Indenture, dated as of December 1, 1995, between Lowe’s Companies, Inc. and U.S. Bank National Association, as successor trustee, including as an exhibit thereto a form of Lowe’s Companies, Inc.’s 5.80% Notes maturing in October 2036. |
| S-3 (POSASR) |
| 333-137750 |
| 4.5 |
| October 10, 2006 |
| ||
|
|
|
|
|
|
|
|
|
|
|
|
| ||
73
Table of Contents
|
|
| ||||||||||||
|
|
|
|
|
|
|
|
|
|
|
|
| ||
| Exhibit Number |
|
|
| Incorporated by Reference |
| ||||||||
|
| Exhibit Description |
| Form |
| File No. |
| Exhibit |
| Filing Date |
| |||
| 4.8 |
| Fifth Supplemental Indenture, dated as of September 11, 2007, to the Amended and Restated Indenture, dated as of December 1, 1995, between Lowe’s Companies, Inc. and U.S. Bank National Association, as successor trustee, including as exhibits thereto a form of Lowe’s Companies, Inc.’s 6.10% Notes maturing in September 2017 and a form of Lowe’s Companies, Inc.’s 6.65% Notes maturing in September 2037. |
| 8-K |
| 001-07898 |
| 4.1 |
| September 11, 2007 |
| ||
|
|
|
|
|
|
|
|
|
|
|
|
| ||
| 4.9 |
| Sixth Supplemental Indenture, dated as of April 15, 2010, to the Amended and Restated Indenture, dated as of December 1, 1995, between Lowe’s Companies, Inc. and U.S. Bank National Association, as successor trustee, including as exhibits thereto a form of Lowe’s Companies, Inc.’s 4.625% Notes maturing in April 2020 and a form of Lowe’s Companies, Inc.’s 5.800% Notes maturing in April 2040. |
| 8-K |
| 001-07898 |
| 4.1 |
| April 15, 2010 |
| ||
|
|
|
|
|
|
|
|
|
|
|
|
| ||
| 4.10 |
| Seventh Supplemental Indenture, dated as of November 22, 2010, to the Amended and Restated Indenture, dated as of December 1, 1995, between Lowe’s Companies, Inc. and U.S. Bank National Association, as successor trustee, including as an exhibit thereto a form of Lowe’s Companies, Inc.’s 3.750% Notes maturing in April 2021. |
| 8-K |
| 001-07898 |
| 4.1 |
| November 22, 2010 |
| ||
|
|
|
|
|
|
|
|
|
|
|
|
| ||
| 4.11 |
| Eighth Supplemental Indenture, dated as of November 23, 2011, to the Amended and Restated Indenture, dated as of December 1, 1995, between Lowe’s Companies, Inc. and U.S. Bank National Association, as successor trustee, including as exhibits thereto a form of Lowe’s Companies, Inc.’s 3.800% Notes maturing in November 2021 and a form of Lowe’s Companies, Inc.’s 5.125% Notes maturing in November 2041. |
| 8-K |
| 001-07898 |
| 4.1 |
| November 23, 2011 |
| ||
|
|
|
|
|
|
|
|
|
|
|
|
| ||
| 4.12 |
| Ninth Supplemental Indenture, dated as of April 23, 2012, to the Amended and Restated Indenture, dated as of December 1, 1995, between Lowe’s Companies, Inc. and U.S. Bank National Association, as successor trustee, including as exhibits thereto a form of Lowe’s Companies, Inc.’s 1.625% Notes maturing in April 2017, a form of Lowe’s Companies, Inc.’s 3.120% Notes maturing in April 2022 and a form of Lowe’s Companies, Inc.’s 4.650% Notes maturing in April 2042. |
| 8-K |
| 001-07898 |
| 4.1 |
| April 23, 2012 |
| ||
|
|
|
|
|
|
|
|
|
|
|
|
| ||
74
Table of Contents
|
|
| ||||||||||||
|
|
|
|
|
|
|
|
|
|
|
|
| ||
| Exhibit Number |
|
|
| Incorporated by Reference |
| ||||||||
|
| Exhibit Description |
| Form |
| File No. |
| Exhibit |
| Filing Date |
| |||
| 4.13 |
| Tenth Supplemental Indenture, dated as of September 11, 2013, to the Amended and Restated Indenture, dated as of December 1, 1995, between Lowe’s Companies, Inc. and U.S. Bank National Association, as successor trustee, including as exhibits thereto a form of Lowe’s Companies, Inc.’s 3.875% Notes maturing in September 2023 and a form of Lowe’s Companies, Inc.’s 5.000% Notes maturing in September 2043. |
| 8-K |
| 001-07898 |
| 4.1 |
| September 11, 2013 |
| ||
|
|
|
|
|
|
|
|
|
|
|
|
| ||
| 4.14 |
| Eleventh Supplemental Indenture, dated as of September 10, 2014, to the Amended and Restated Indenture, dated as of December 1, 1995, between Lowe’s Companies, Inc. and U.S. Bank National Association, as successor trustee, including as exhibits thereto a form of Lowe’s Companies, Inc.’s Floating Rate Notes maturing in September 2019, a form of Lowe’s Companies, Inc.’s 3.125% Notes maturing in September 2024 and a form of Lowe’s Companies, Inc.’s 4.250% Notes maturing in September 2044. |
| 8-K |
| 001-07898 |
| 4.1 |
| September 10, 2014 |
| ||
|
|
|
|
|
|
|
|
|
|
|
|
| ||
| 4.15 |
| Twelfth Supplemental Indenture, dated as of September 16, 2015, to the Amended and Restated Indenture, dated as of December 1, 1995, between Lowe’s Companies, Inc. and U.S. Bank National Association, as successor trustee, including as exhibits thereto a form of Lowe’s Companies, Inc.’s Floating Rate Notes maturing in September 2018, a form of Lowe’s Companies, Inc.’s 3.375% Notes maturing in September 2025 and a form of Lowe’s Companies, Inc.’s 4.375% Notes maturing in September 2045. |
| 8-K |
| 001-07898 |
| 4.1 |
| September 16, 2015 |
| ||
|
|
|
|
|
|
|
|
|
|
|
|
| ||
| 4.16 |
| Thirteenth Supplemental Indenture, dated as of April 20, 2016, to the Amended and Restated Indenture, dated as of December 1, 1995, between Lowe’s Companies, Inc. and U.S. Bank National Association, as trustee, including as exhibits thereto a form of Lowe’s Companies, Inc.’s Floating Rate Notes maturing in April 2019, a form of Lowe’s Companies, Inc.’s 1.15% Notes maturing in April 2019, a form of Lowe’s Companies, Inc.’s 2.50% Notes maturing in April 2026 and a form of Lowe’s Companies, Inc.’s 3.70% Notes maturing in April 2046. |
| 8-K |
| 001-07898 |
| 4.1 |
| April 20, 2016 |
| ||
|
|
|
|
|
|
|
|
|
|
|
|
| ||
75
Table of Contents
|
|
| ||||||||||||
|
|
|
|
|
|
|
|
|
|
|
|
| ||
| Exhibit Number |
|
|
| Incorporated by Reference |
| ||||||||
|
| Exhibit Description |
| Form |
| File No. |
| Exhibit |
| Filing Date |
| |||
| 4.17 |
| Amended and Restated Credit Agreement, dated as of November 23, 2016, by and among Lowe’s Companies, Inc., Bank of America, N.A., as administrative agent, swing line lender and a letter of credit issuer, Wells Fargo Bank, National Association, as syndication agent and a letter of credit issuer, Goldman Sachs Bank USA, JPMorgan Chase Bank, N.A., SunTrust Bank and U.S. Bank National Association, as co-documentation agents, and the other lenders party thereto. |
| 8-K |
| 001-07898 |
| 10.1 |
| November 28, 2016 |
| ||
|
|
|
|
|
|
|
|
|
|
|
|
| ||
| 10.1 |
| Lowe’s Companies, Inc. Directors’ Deferred Compensation Plan, effective July 1, 1994.* |
| 10-Q |
| 001-07898 |
| 10.1 |
| December 2, 2008 |
| ||
|
|
|
|
|
|
|
|
|
|
|
|
| ||
| 10.2 |
| Amendment No. 1 to the Lowe’s Companies, Inc. Directors’ Deferred Compensation Plan, effective January 31, 2009.* |
| 10-K |
| 001-07898 |
| 10.21 |
| March 30, 2010 |
| ||
|
|
|
|
|
|
|
|
|
|
|
|
| ||
| 10.3 |
| Lowe’s Companies Employee Stock Purchase Plan – Stock Options for Everyone, as amended and restated effective June 1, 2012.* |
| DEF 14A |
| 001-07898 |
| Appendix B |
| April 13, 2012 |
| ||
|
|
|
|
|
|
|
|
|
|
|
|
| ||
| 10.4 |
| Lowe’s Companies, Inc. 1997 Incentive Plan.* |
| S-8 |
| 333-34631 |
| 4.2 |
| August 29, 1997 |
| ||
|
|
|
|
|
|
|
|
|
|
|
|
| ||
| 10.5 |
| Amendments to the Lowe’s Companies, Inc. 1997 Incentive Plan, dated January 25, 1998.* |
| 10-K |
| 001-07898 |
| 10.16 |
| April 19, 1999 |
| ||
|
|
|
|
|
|
|
|
|
|
|
|
| ||
| 10.6 |
| Amendments to the Lowe’s Companies, Inc. 1997 Incentive Plan, dated September 17, 1998 (also encompassing as Exhibit I thereto the Lowe’s Companies, Inc. Deferred Compensation Program).* |
| 10-K |
| 001-07898 |
| 10.17 |
| April 19, 1999 |
| ||
|
|
|
|
|
|
|
|
|
|
|
|
| ||
| 10.7 |
| Amendment No. 1 to the Lowe’s Companies, Inc. Deferred Compensation Program, effective as of January 1, 2005.* |
| 10-K |
| 001-07898 |
| 10.25 |
| March 29, 2011 |
| ||
|
|
|
|
|
|
|
|
|
|
|
|
| ||
| 10.8 |
| Amendment No. 2 to the Lowe’s Companies, Inc. Deferred Compensation Program, effective as of December 31, 2008.* |
| 10-K |
| 001-07898 |
| 10.22 |
| March 31, 2009 |
| ||
|
|
|
|
|
|
|
|
|
|
|
|
| ||
| 10.9 |
| Lowe’s Companies Benefit Restoration Plan, as amended and restated as of January 1, 2008.* |
| 10-Q |
| 001-07898 |
| 10.2 |
| December 12, 2007 |
| ||
|
|
|
|
|
|
|
|
|
|
|
|
| ||
| 10.10 |
| Amendment No. 1 to the Lowe’s Companies Benefit Restoration Plan.* |
| 10-K |
| 001-07898 |
| 10.10 |
| March 29, 2011 |
| ||
|
|
|
|
|
|
|
|
|
|
|
|
| ||
76
Table of Contents
|
|
| ||||||||||||
|
|
|
|
|
|
|
|
|
|
|
|
| ||
| Exhibit Number |
|
|
| Incorporated by Reference |
| ||||||||
|
| Exhibit Description |
| Form |
| File No. |
| Exhibit |
| Filing Date |
| |||
| 10.11 |
| Amendment No. 2 to the Lowe’s Companies Benefit Restoration Plan.* |
| 10-K |
| 001-07898 |
| 10.11 |
| March 29, 2011 |
| ||
|
|
|
|
|
|
|
|
|
|
|
|
| ||
| 10.12 |
| Amendment No. 3 to the Lowe’s Companies Benefit Restoration Plan.* |
| 10-Q |
| 001-07898 |
| 10.1 |
| December 1, 2011 |
| ||
|
|
|
|
|
|
|
|
|
|
|
|
| ||
| 10.13 |
| Amendment No. 4 to the Lowe’s Companies Benefit Restoration Plan.* |
| 10-Q |
| 001-07898 |
| 10.1 |
| September 4, 2012 |
| ||
|
|
|
|
|
|
|
|
|
|
|
|
| ||
| 10.14 |
| Amendment No. 5 to the Lowe’s Companies Benefit Restoration Plan.* |
| 10-Q |
| 001-07898 |
| 10.1 |
| December 3, 2013 |
| ||
|
|
|
|
|
|
|
|
|
|
|
|
| ||
| 10.15 |
| Amendment No. 6 to the Lowe’s Companies Benefit Restoration Plan.* |
| 10-K |
| 001-07898 |
| 10.1 |
| March 31, 2015 |
| ||
|
|
|
|
|
|
|
|
|
|
|
|
| ||
| 10.16 |
| Amendment No. 7 to the Lowe’s Companies Benefit Restoration Plan.*‡ |
|
|
|
|
|
|
|
|
| ||
|
|
|
|
|
|
|
|
|
|
|
|
| ||
| 10.17 |
| Form of Lowe’s Companies, Inc. Management Continuity Agreement for Tier I Senior Officers used for agreements entered into prior to June 1, 2012.* |
| 10-Q |
| 001-07898 |
| 10.1 |
| September 3, 2008 |
| ||
|
|
|
|
|
|
|
|
|
|
|
|
| ||
| 10.18 |
| Form of Lowe’s Companies, Inc. Management Continuity Agreement for Tier I Senior Officers used for agreements entered into on or after June 1, 2012.* |
| 10-Q |
| 001-07898 |
| 10.2 |
| September 4, 2012 |
| ||
|
|
|
|
|
|
|
|
|
|
|
|
| ||
| 10.19 |
| Form of Lowe’s Companies, Inc. Management Continuity Agreement for Tier II Senior Officers.* |
| 10-Q |
| 001-07898 |
| 10.2 |
| September 3, 2008 |
| ||
|
|
|
|
|
|
|
|
|
|
|
|
| ||
| 10.20 |
| Lowe’s Companies Cash Deferral Plan.* |
| 10-Q |
| 001-07898 |
| 10.1 |
| June 4, 2004 |
| ||
|
|
|
|
|
|
|
|
|
|
|
|
| ||
| 10.21 |
| Amendment No. 1 to the Lowe’s Companies Cash Deferral Plan.* |
| 10-Q |
| 001-07898 |
| 10.1 |
| December 12, 2007 |
| ||
|
|
|
|
|
|
|
|
|
|
|
|
| ||
| 10.22 |
| Amendment No. 2 to the Lowe’s Companies Cash Deferral Plan.* |
| 10-Q |
| 001-07898 |
| 10.2 |
| December 1, 2010 |
| ||
|
|
|
|
|
|
|
|
|
|
|
|
| ||
| 10.23 |
| Lowe’s Companies, Inc. Amended and Restated Directors’ Stock Option and Deferred Stock Unit Plan.* |
| 8-K |
| 001-07898 |
| 10.1 |
| June 3, 2005 |
| ||
|
|
|
|
|
|
|
|
|
|
|
|
| ||
| 10.24 |
| Form of Lowe’s Companies, Inc. Deferred Stock Unit Agreement for Directors.* |
| 8-K |
| 001-07898 |
| 10.2 |
| June 3, 2005 |
| ||
|
|
|
|
|
|
|
|
|
|
|
|
| ||
| 10.25 |
| Form of Lowe’s Companies, Inc. Restricted Stock Award Agreement.* |
| 10-Q |
| 001-07898 |
| 10.1 |
| September 1, 2005 |
| ||
|
|
|
|
|
|
|
|
|
|
|
|
| ||
| 10.26 |
| Form of Lowe’s Companies, Inc. Performance Share Unit Award Agreement.* |
| 10-Q |
| 001-07898 |
| 10.1 |
| May 31, 2011 |
| ||
|
|
|
|
|
|
|
|
|
|
|
|
| ||
77
Table of Contents
|
|
| ||||||||||||
|
|
|
|
|
|
|
|
|
|
|
|
| ||
| Exhibit Number |
|
|
| Incorporated by Reference |
| ||||||||
|
| Exhibit Description |
| Form |
| File No. |
| Exhibit |
| Filing Date |
| |||
| 10.27 |
| Form of Lowe’s Companies, Inc. Restricted Stock Award Agreement.*‡ |
|
|
|
|
|
|
|
|
| ||
|
|
|
|
|
|
|
|
|
|
|
|
| ||
| 10.28 |
| Lowe’s Companies, Inc. 2006 Long Term Incentive Plan, as amended and restated effective as of February 4, 2017.*‡ |
|
|
|
|
|
|
|
|
| ||
|
|
|
|
|
|
|
|
|
|
|
|
| ||
| 10.29 |
| Lowe’s Companies, Inc. 2016 Annual Incentive Plan, effective as of February 1, 2016.* |
| DEF 14A |
| 001-07898 |
| Appendix C |
| April 11, 2016 |
| ||
|
|
|
|
|
|
|
|
|
|
|
|
| ||
| 10.30 |
| Form of Lowe’s Companies, Inc. 2006 Long Term Incentive Plan Non-Qualified Stock Option Agreement.* |
| 10-K |
| 001-07898 |
| 10.24 |
| March 29, 2011 |
| ||
|
|
|
|
|
|
|
|
|
|
|
|
| ||
| 12.1 |
| Statement re Computation of Ratio of Earnings to Fixed Charges.‡ |
|
|
|
|
|
|
|
|
| ||
|
|
|
|
|
|
|
|
|
|
|
|
| ||
| 21.1 |
| List of Subsidiaries.‡ |
|
|
|
|
|
|
|
|
| ||
|
|
|
|
|
|
|
|
|
|
|
|
| ||
| 23.1 |
| Consent of Deloitte & Touche LLP.‡ |
|
|
|
|
|
|
|
|
| ||
|
|
|
|
|
|
|
|
|
|
|
|
| ||
| 31.1 |
| Certification of Principal Executive Officer Pursuant to Rule 13a-14(a)/15d-14(a), as Adopted Pursuant to Section 302 of the Sarbanes-Oxley Act of 2002.‡ |
|
|
|
|
|
|
|
|
| ||
|
|
|
|
|
|
|
|
|
|
|
|
| ||
| 31.2 |
| Certification of Principal Financial Officer Pursuant to Rule 13a-14(a)/15d-14(a), as Adopted Pursuant to Section 302 of the Sarbanes-Oxley Act of 2002.‡ |
|
|
|
|
|
|
|
|
| ||
|
|
|
|
|
|
|
|
|
|
|
|
| ||
| 32.1 |
| Certification of Principal Executive Officer Pursuant to 18 U.S.C. Section 1350, as Adopted Pursuant to Section 906 of the Sarbanes-Oxley Act of 2002.† |
|
|
|
|
|
|
|
|
| ||
|
|
|
|
|
|
|
|
|
|
|
|
| ||
| 32.2 |
| Certification of Principal Financial Officer Pursuant to 18 U.S.C. Section 1350, as Adopted Pursuant to Section 906 of the Sarbanes-Oxley Act of 2002.† |
|
|
|
|
|
|
|
|
| ||
|
|
|
|
|
|
|
|
|
|
|
|
| ||
| 99.1 |
| Amendment No. 5 to the Lowe’s 401(k) Plan, effective as of June 1, 2016 (filed to include this amendment as an exhibit to the Registration Statement on Form S-8, Registration No. 033-29772).‡ |
|
|
|
|
|
|
|
|
| ||
|
|
|
|
|
|
|
|
|
|
|
|
| ||
| 99.2 |
| Amendment No. 6 to the Lowe’s 401(k) Plan, effective as of January 1, 2016 (filed to include this amendment as an exhibit to the Registration Statement on Form S-8, Registration No. 033-29772).‡ |
|
|
|
|
|
|
|
|
| ||
|
|
|
|
|
|
|
|
|
|
|
|
| ||
| 101.INS |
| XBRL Instance Document.‡ |
|
|
|
|
|
|
|
|
| ||
|
|
|
|
|
|
|
|
|
|
|
|
| ||
78
Table of Contents
|
|
| |||||||||||||
|
|
|
|
|
|
|
|
|
|
|
|
| |||
| Exhibit Number |
|
|
| Incorporated by Reference |
| |||||||||
|
| Exhibit Description |
| Form |
| File No. |
| Exhibit |
| Filing Date |
| ||||
| 101.SCH |
| XBRL Taxonomy Extension Schema Document.‡ |
|
|
|
|
|
|
|
|
| |||
|
|
|
|
|
|
|
|
|
|
|
|
| |||
| 101.CAL |
| XBRL Taxonomy Extension Calculation Linkbase Document.‡ |
|
|
|
|
|
|
|
|
| |||
|
|
|
|
|
|
|
|
|
|
|
|
| |||
| 101.DEF |
| XBRL Taxonomy Extension Definition Linkbase Document.‡ |
|
|
|
|
|
|
|
|
| |||
|
|
|
|
|
|
|
|
|
|
|
|
| |||
| 101.LAB |
| XBRL Taxonomy Extension Label Linkbase Document.‡ |
|
|
|
|
|
|
|
|
| |||
|
|
|
|
|
|
|
|
|
|
|
|
| |||
| 101.PRE |
| XBRL Taxonomy Extension Presentation Linkbase Document.‡ |
|
|
|
|
|
|
|
|
| |||
|
|
|
|
|
|
|
|
|
|
|
|
| |||
|
|
|
|
|
|
|
|
|
|
|
|
| |||
| (1) |
| Schedules have been omitted pursuant to Item 601 (b)(2) of Regulation S-K. Lowe’s Companies, Inc. agrees to furnish supplementally to the Securities and Exchange Commission a copy of any omitted schedule upon request. |
| |||||||||||
| * |
| Indicates a management contract or compensatory plan or arrangement. |
| |||||||||||
| ‡ |
| Filed herewith. |
|
|
|
|
|
|
|
|
| |||
| † |
| Furnished herewith. |
|
|
|
|
|
|
|
|
| |||
Item 16 – Form 10-K Summary
None.
79
Table of Contents
SIGNATURES
Pursuant to the requirements of Section 13 or 15(d) of the Securities Exchange Act of 1934, the registrant has duly caused this report to be signed on its behalf by the undersigned, thereunto duly authorized.
|
| ||
|
|
|
|
|
|
| LOWE’S COMPANIES, INC. |
|
|
| (Registrant) |
|
|
|
|
| April 3, 2017 |
| By: /s/ Robert A. Niblock |
| Date |
| Robert A. Niblock Chairman of the Board, President and Chief Executive Officer |
|
|
|
|
| April 3, 2017 |
| By: /s/ Marshall A. Croom |
| Date |
| Marshall A. Croom Chief Financial Officer |
|
|
|
|
| April 3, 2017 |
| By: /s/ Matthew V. Hollifield |
| Date |
| Matthew V. Hollifield Senior Vice President and Chief Accounting Officer |
80
Table of Contents
Pursuant to the requirements of the Securities Exchange Act of 1934, this report has been signed below by the following persons on behalf of the registrant and in the capacities and on the dates indicated. Each of the directors of the registrant whose signature appears below hereby appoints Marshall A. Croom, Matthew V. Hollifield and Ross W. McCanless, and each of them severally, as his or her attorney-in-fact to sign in his or her name and behalf, in any and all capacities stated below, and to file with the Securities and Exchange Commission any and all amendments to this report, making such changes in this report as appropriate, and generally to do all such things in their behalf in their capacities as directors and/or officers to enable the registrant to comply with the provisions of the Securities Exchange Act of 1934, and all requirements of the Securities and Exchange Commission.
|
| ||
|
|
|
|
| /s/ Robert A. Niblock | Chairman of the Board, President, Chief Executive Officer and Director | April 3, 2017 |
| Robert A. Niblock |
| Date |
|
|
|
|
| /s/ Raul Alvarez | Director | April 3, 2017 |
| Raul Alvarez |
| Date |
|
|
|
|
| /s/ Angela F. Braly | Director | April 3, 2017 |
| Angela F. Braly |
| Date |
|
|
|
|
| /s/ Sandra B. Cochran | Director | April 3, 2017 |
| Sandra B. Cochran |
| Date |
|
|
|
|
| /s/ Laurie Z. Douglas | Director | April 3, 2017 |
| Laurie Z. Douglas |
| Date |
|
|
|
|
| /s/ Richard W. Dreiling | Director | April 3, 2017 |
| Richard W. Dreiling |
| Date |
|
|
|
|
| /s/ Robert L. Johnson | Director | April 3, 2017 |
| Robert L. Johnson |
| Date |
|
|
|
|
| /s/ Marshall O. Larsen | Director | April 3, 2017 |
| Marshall O. Larsen |
| Date |
|
|
|
|
| /s/ James H. Morgan | Director | April 3, 2017 |
| James H. Morgan |
| Date |
|
|
|
|
| /s/ Bertram L. Scott | Director | April 3, 2017 |
| Bertram L. Scott |
| Date |
|
|
|
|
| /s/ Eric C. Wiseman | Director | April 3, 2017 |
| Eric C. Wiseman |
| Date |
81
Exhibit 10.16
AMENDMENT NUMBER SEVEN
TO THE LOWE’S COMPANIES
BENEFIT RESTORATION PLAN
THIS AMENDMENT NUMBER SEVEN to the Lowe’s Companies Benefit Restoration Plan, as amended and restated effective January 1, 2008 (the “Plan”), is hereby adopted by Lowe’s Companies, Inc. (the “Company”).
W I T N E S S E T H:
WHEREAS, the Company currently maintains the Plan; and
WHEREAS, under Section 15 of the Plan, the Company may amend the Plan in whole or in part at any time;
WHEREAS, the Company desires to amend the Plan to simplify the participant experience and reflect more clearly the Plan’s operations;
NOW THEREFORE, the Plan is hereby amended effective as of September 1,2016 unless otherwise indicated as follows:
1. The first sentence of Section 9(a) shall be revised to read as follows:
Within 90 days following a Participant’s “separation from service” (within the meaning of Code Section 409A and the regulations thereunder), the Participant shall receive (or begin to receive) payment of the balance of his Account (including any deemed appreciation and depreciation through the date of distribution).
2. Except as expressly or by necessary implication amended hereby, the Plan shall continue in full force and effect.
IN WITNESS HEREOF, this Amendment Number Seven has been executed on the date shown below, but effective as of the date specified herein.
|
| ||
|
|
|
|
|
| LOWE’S COMPANIES, INC. | |
|
|
|
|
|
| By: | /s/ Matthew B. Eurey |
|
|
| Matthew B. Eurey Vice President – Total Rewards |
|
|
|
|
|
| Date: | December 16, 2016 |
Exhibit 10.27
R E S T R I C T E D S T O C K A W A R D A G R E E M E N T
Non-transferable
G R A N T T O
|
|
|
|
|
|
(“Grantee”)
by Lowe’s Companies, Inc. (the “Company”) of
|
|
|
|
|
|
shares of its common stock, $0.50 par value (the “Shares”)
pursuant to and subject to the provisions of the Lowe’s Companies, Inc. 2006 Long Term Incentive Plan, as amended and restated (the “ Plan ”), and to the terms and conditions set forth on the following pages (the “ Terms and Conditions ”).
Except as otherwise provided in Section 2 of the Terms and Conditions, the Shares shall vest and no longer be subject to forfeiture as to the following percentage of the Shares awarded hereunder, on the following date:
|
| ||
|
|
|
|
| Percentage of Shares |
| Date of Vesting |
|
|
|
|
| 100% |
| Third Anniversary of Date of Grant |
Notwithstanding the vesting of the Shares on the Date of Vesting set forth above or as otherwise provided in Section 2 of the Terms and Conditions, the Shares shall be Non-transferable Shares until the expiration of the transfer restrictions set forth in Section 3 of the Terms and Conditions.
IN WITNESS WHEREOF, Lowe’s Companies, Inc., acting by and through its duly authorized officer, has caused this Agreement to be executed as of the Date of Grant.
|
| ||
|
|
|
|
|
| LOWE’S COMPANIES, INC. | |
|
|
|
|
|
| By: |
|
|
|
|
|
|
|
|
|
|
| Date of Grant: |
|
|
|
|
|
|
| Accepted by Grantee: |
|
1
TERMS AND CONDITIONS
|
|
| ||
| 1. | Grant of Shares. The Company hereby grants to Grantee, subject to the restrictions and the other terms and conditions set forth in the Plan, and in this Restricted Stock Award Agreement (this “ Agreement ”), the Shares indicated on Page 1. Capitalized terms used herein and not otherwise defined shall have the meanings assigned to such terms in the Plan. | ||
|
|
| ||
| 2. | Vesting of Shares. As of the Date of Grant, the Shares shall be “Unvested Shares” and fully forfeitable. The Unvested Shares shall become “ Vested Shares ” as of the earliest to occur of the following (the period prior to such vesting being referred to herein as the “ Vesting Period ”): | ||
|
|
| ||
| (a) | As of the Date of Vesting specified on Page 1; | ||
|
|
| ||
| (b) | On the date of termination of Grantee’s employment with the Company and its Affiliates by reason of Grantee’s death, Disability or Retirement; or | ||
|
|
| ||
| (c) | On the date of termination of Grantee’s employment with the Company and its Affiliates by the Company without Cause or by Grantee’s resignation for Good Reason, in either case within twelve (12) months after the occurrence of a Change in Control. | ||
If Grantee’s employment with the Company and its Affiliates terminates for any reason prior to the Unvested Shares becoming Vested Shares in accordance with this Section 2, Grantee shall forfeit all of Grantee’s right, title and interest in and to the Unvested Shares as of the date of Grantee’s termination of employment, and such Unvested Shares shall revert to the Company immediately following the event of forfeiture.
The definition of “Retirement” for purposes of this Agreement shall have the following meaning and not the meaning assigned to such term in the Plan: The voluntary termination of employment with the approval of the Board at least six (6) months after the Date of Grant and on or after the date Grantee has attained age fifty-five (55) and Grantee’s age plus years of service equal or exceed seventy (70); provided that, Grantee has given the Board at least ten (10) days advance notice of such Retirement.
|
|
|
| 3. | Share Transfer Restrictions. “Non-transferable Shares” means those Shares that are subject to the transfer restrictions imposed under this Section 3 which restrictions have not expired or terminated. Non-transferable Shares may not be sold, transferred, exchanged, assigned, pledged, hypothecated or otherwise encumbered. |
The restrictions imposed under this Section shall apply to all shares of the Company’s common stock or other securities issued with respect to Non-transferable Shares hereunder in connection with any merger, reorganization, consolidation, recapitalization, stock dividend or other change in corporate structure affecting the common stock of the Company.
The transfer restrictions imposed under this Section 3 will expire as to all of the Shares indicated on Page 1 on the earliest to occur of the following (the period prior to such expiration being referred to herein as the “ Non-transferable Period ”):
|
|
| ||
| (a) | On the Date of Vesting specified on Page 1; | ||
|
|
| ||
| (b) | On the date of termination of Grantee’s employment with the Company and its Affiliates by reason of Grantee’s death or Disability; or | ||
|
|
| ||
| (c) | On the date of termination of Grantee’s employment with the Company and its Affiliates by the Company without Cause or by Grantee’s resignation for Good Reason, in either case within twelve (12) months after the occurrence of a Change in Control. | ||
|
|
| ||
| 4. | Delivery of Shares. The Shares will be registered in the name of Grantee as of the Date of Grant and will be held by the Company during the Non-transferable Period in certificated or uncertificated form. If a certificate for Non-transferable Shares is issued during the Non-transferable Period, such certificate shall be registered in the name of Grantee and shall bear a legend in substantially the following form (in addition to any legend required under applicable state securities laws): | ||
2
“This certificate and the shares of stock represented hereby are subject to the terms and conditions (including forfeiture and restrictions against transfer) contained in a Restricted Stock Award Agreement between the registered owner of the shares represented hereby and Lowe’s Companies, Inc. Release from such terms and conditions shall be made only in accordance with the provisions of such Agreement, copies of which are on file in the offices of Lowe’s Companies, Inc.”
Stock certificates for the Shares, without the above legend, shall be delivered to Grantee or Grantee’s designee upon request of Grantee after the expiration of the Non-transferable Period, but delivery may be postponed for such period as may be required for the Company with reasonable diligence to comply if deemed advisable by the Company, with registration requirements under the Securities Act of 1933, listing requirements under the rules of any stock exchange, and requirements under any other law or regulation applicable to the issuance or transfer of the Shares.
|
|
|
| 5. | Voting and Dividend Rights. Grantee, as beneficial owner of the Shares, shall have full voting and dividend rights with respect to the Shares during and after the Vesting Period and Non-transferable Period. If Grantee forfeits any rights Grantee may have under this Agreement, Grantee shall no longer have any rights as a shareholder with respect to the Shares or any interest therein and Grantee shall no longer be entitled to receive dividends on such Shares. In the event that for any reason Grantee shall have received dividends upon such Shares after such forfeiture, Grantee shall repay to the Company an amount equal to such dividends. |
|
|
|
| 6. | Competing Activity. If Grantee engages in any Competing Activity during Grantee’s employment with the Company or an Affiliate or within one year after the termination of Grantee’s employment with the Company and its Affiliates for any reason, (i) Grantee shall forfeit all of Grantee’s right, title and interest in and to any Unvested Shares or Non-transferable Shares as of the time of the Grantee’s engaging in such Competing Activity and such Shares shall revert to the Company immediately following such event of forfeiture, and (ii) Grantee shall remit, upon demand by the Company, the “Repayment Amount” (as defined in the following sentence), with respect to any Shares that were delivered to Grantee during the six (6) month period prior to the date Grantee engaged in the Competing Activity. |
The “Repayment Amount” is the aggregate Fair Market Value of the Shares at the time of delivery to Grantee. The Repayment Amount shall be payable in cash (which shall include a certified check or bank check), by the tender of shares of Common Stock or by a combination of cash and Common Stock; provided that, regardless of the Fair Market Value of such shares at the time of tender, the tender of the shares shall satisfy the obligation to pay the Repayment Amount for the same number of shares of Common Stock delivered to the Company.
For purposes of this Agreement, Grantee will be deemed to be engaged in a “Competing Activity” if Grantee, directly or indirectly, owns, manages, operates, controls, is employed by, or participates in as a 5% or greater shareholder, partner, member or joint venturer, in a Competing Enterprise, or engages in, as an independent contractor or otherwise, a Competing Enterprise for himself or on behalf of another person or entity. A “Competing Enterprise “is any business engaged in any market which is a part of the Home Environment Business as described below (i) with total annual sales or revenues of at least five hundred million dollars ($500 million USD) and (ii) with retail locations or distribution facilities in a US State or the District of Columbia or which engages in providing goods and/or services within the Home Environment Business to customers in the United States through electronic means (internet, mobile application, etc.), including but not limited to the following entities: The Home Depot, Inc.; Sears Holdings, Inc.; Menard, Inc.; Amazon.com; Best Buy, Inc.; J.C. Penney Co.; Ace Hardware Corp.; Tractor Supply Co.; Lumber Liquidators Holdings, Inc.; Wayfair.com; Jet.com; and, True Value Company.
The Company and its affiliated entities comprise an international, omni-channel provider of goods and services for building, expanding, enhancing, customizing, maintaining, innovating, connecting, and outfitting consumers’ living spaces (“Home Environment Business”). The Company operates retail locations and support facilities and offers products and services to consumers in all 50 states and the District of Columbia. The Company’s Home Environment Business requires a complex sourcing and supply network, multi-channel distribution and delivery systems, innovative information technology resources, and a robust infrastructure support organization. Grantee recognizes and acknowledges that the
3
Company has a legitimate business interest in maintaining its competitive position in a dynamic industry and that restricting Grantee for a reasonable period from performing work for, providing services to, or owning more than a 5% interest in an enterprise which engages in business activities which are in competition with the Company is appropriate. Grantee further acknowledges that the Company’s business would likely be damaged by Grantee’s engaging in competitive work activity during the non-competition period detailed above. Grantee agrees that in Grantee’s position with the Company, Grantee was provided access to or helped develop business information proprietary to the Company and that Grantee would inevitably disclose or otherwise utilize such information if Grantee were to work for, provide services to, or own a substantial interest in a Competing Activity during the non-competition period.
Nothing contained in this Section 6 shall be interpreted as or deemed to constitute a waiver of, or diminish or be in lieu of, any other rights that the Company or an Affiliate may possess as a result of Grantee’s misconduct or direct or indirect involvement with a business competing with the business of the Company or an Affiliate.
|
|
|
| 7. | No Right of Continued Employment. Nothing in this Agreement shall interfere with or limit in any way the right of the Company or any Affiliate to terminate Grantee’s employment at any time, nor confer upon Grantee any right to continue in the employ of the Company or any Affiliate. |
8. Payment of Taxes.
|
|
|
| (a) | Upon issuance of the Shares hereunder, Grantee may make an election to be taxed upon such award under Section 83(b) of the Code. To effect such election, Grantee may file an appropriate election with Internal Revenue Service within thirty (30) days after award of the Shares and otherwise in accordance with applicable Treasury Regulations. |
|
|
|
| (b) | At the end of the Vesting Period, the Company will automatically withhold a number of Shares having a fair market value equal to an amount up to the maximum statutory rate to satisfy federal, state, local and foreign taxes (including Grantee's FICA obligation), unless Grantee notifies the Company thirty (30) days prior to the expiration and termination of the Vesting Period that he or she will satisfy his or her tax withholding obligations in cash. |
|
|
|
| (c) | In the event Grantee chooses to satisfy Grantee’s tax withholding obligations in cash and complies with the above notification requirement, Grantee will, no later than the date as of which any amount related to the Shares first becomes includable in Grantee’s gross taxable income for federal income tax purposes, pay to the Company, or make other arrangements satisfactory to the Committee regarding payment of, any federal, state and local taxes of any kind (including Grantee’s FICA obligation) required by law to be withheld with respect to such amount. |
The obligations of the Company under this Agreement will be conditional on such payment or arrangements, and the Company, and, where applicable, its Affiliates will, to the extent permitted by law, have the right to deduct any such taxes from any payment of any kind otherwise due to Grantee.
|
|
|
| 9. | Amendment. The Committee may amend or terminate this Agreement without the consent of Grantee; provided, however, that such amendment or termination shall not, without Grantee’s consent, reduce or diminish the value of this award determined as if it had been fully vested (i.e., as if all restrictions on the Shares hereunder had expired) on the date of such amendment or termination. |
|
|
|
| 10. | Plan Controls. The terms contained in the Plan, including without limitation the antidilution adjustment provisions, are incorporated into and made a part of this Agreement, and this Agreement shall be governed by and construed in accordance with the Plan. In the event of any actual or alleged conflict between the provisions of the Plan and the provisions of this Agreement, the provisions of the Plan shall be controlling and determinative. |
|
|
|
| 11. | Successors. This Agreement shall be binding upon any successor of the Company, in accordance with the terms of this Agreement and the Plan. |
4
|
|
|
| 12. | Severability. If any one or more of the provisions contained in this Agreement are invalid, illegal or unenforceable, the other provisions of this Agreement will be construed and enforced as if the invalid, illegal or unenforceable provision had never been included. |
|
|
|
| 13. | Notice. Notices and communications under this Agreement must be in writing and either personally delivered or sent by registered or certified United States mail, return receipt requested, postage prepaid. Notices to the Company must be addressed to: |
Lowe’s Companies, Inc.
1000 Lowe’s Boulevard
Mooresville, NC 28117
Attn: Director, Corporate and International Compensation
or any other address designated by the Company in a written notice to Grantee. Notices to Grantee will be directed to the address of Grantee then currently on file with the Company, or at any other address given by Grantee in a written notice to the Company.
5
Exhibit 10.28
LOWE’S COMPANIES, INC.
2006 LONG TERM INCENTIVE PLAN
As Amended and Restated Effective February 4, 2017
TABLE OF CONTENTS
|
| ||||||
|
|
|
|
|
| ||
| Article I INTRODUCTION AND PURPOSE | 1 |
| ||||
|
|
| |||||
| Article II DEFINITIONS | 1 |
| ||||
|
|
| |||||
| Article III ADMINISTRATION | 5 |
| ||||
|
|
|
|
| |||
|
| Section 3.1 | Committee Authority | 5 |
| ||
|
| Section 3.2 | Delegation of Authority | 6 |
| ||
|
| Section 3.3 | Indemnification | 6 |
| ||
|
|
|
|
| |||
| Article IV ELIGIBILITY | 6 |
| ||||
|
|
| |||||
| Article V STOCK SUBJECT TO PLAN; AWARD LIMITATIONS | 7 |
| ||||
|
|
|
|
| |||
|
| Section 5.1 | Sources of Shares Issued | 7 |
| ||
|
| Section 5.2 | Aggregate Limit | 7 |
| ||
|
| Section 5.3 | Awards Made and Plan Terms in Effect Prior to the Effective Date | 7 |
| ||
|
| Section 5.4 | Share Counting | 7 |
| ||
|
| Section 5.5 | Award Limitations—Employees | 7 |
| ||
|
| Section 5.6 | Award Limitations—Nonemployee Directors | 8 |
| ||
|
|
|
|
| |||
| Article VI OPTIONS | 8 |
| ||||
|
|
|
|
| |||
|
| Section 6.1 | Award | 8 |
| ||
|
| Section 6.2 | Option Price | 8 |
| ||
|
| Section 6.3 | Maximum Option Period | 8 |
| ||
|
| Section 6.4 | Ten Percent Shareholders | 8 |
| ||
|
| Section 6.5 | Limit for Incentive Stock Options | 8 |
| ||
|
| Section 6.6 | Exercise | 8 |
| ||
|
| Section 6.7 | Payment | 9 |
| ||
|
| Section 6.8 | Disposition of Stock | 9 |
| ||
|
|
|
|
| |||
| Article VII SARS | 9 |
| ||||
|
|
|
|
| |||
|
| Section 7.1 | Award | 9 |
| ||
|
| Section 7.2 | Initial Value | 9 |
| ||
|
| Section 7.3 | Maximum SAR Period | 9 |
| ||
|
| Section 7.4 | Exercise | 9 |
| ||
|
| Section 7.5 | Settlement | 10 |
| ||
|
|
|
|
| |||
| Article VIII STOCK AWARDS | 10 |
| ||||
|
|
|
|
| |||
|
| Section 8.1 | Award | 10 |
| ||
|
| Section 8.2 | Vesting | 10 |
| ||
|
| Section 8.3 | Performance Objectives | 10 |
| ||
|
| Section 8.4 | Shareholder Rights | 10 |
| ||
|
|
|
|
| |||
| Article IX PERFORMANCE SHARE AWARDS | 11 |
| ||||
|
|
|
|
| |||
|
| Section 9.1 | Award | 11 |
| ||
|
| Section 9.2 | Earning the Award | 11 |
| ||
|
| Section 9.3 | Payment | 12 |
| ||
|
| ||||||
|
|
|
|
|
| ||
| Article X PROVISIONS APPLICABLE TO AWARDS GENERALLY | 12 |
| ||||
|
|
|
|
| |||
|
| Section 10.1 | Recoupment of Awards | 12 |
| ||
|
| Section 10.2 | Limits on Transfer | 12 |
| ||
|
| Section 10.3 | Share Certificates | 12 |
| ||
|
| Section 10.4 | Acceleration upon a Change in Control | 12 |
| ||
|
| Section 10.5 | Acceleration for Other Reasons | 12 |
| ||
|
| Section 10.6 | Effect of Acceleration | 13 |
| ||
|
| Section 10.7 | Termination of Employment | 13 |
| ||
|
| Section 10.8 | Form of Payment for Awards | 13 |
| ||
|
|
|
|
| |||
| Article XI ADJUSTMENT UPON CHANGE IN COMMON STOCK | 13 |
| ||||
|
|
| |||||
| Article XII COMPLIANCE WITH LAW AND APPROVAL OF REGULATORY BODIES | 14 |
| ||||
|
|
| |||||
| Article XIII GENERAL PROVISIONS | 14 |
| ||||
|
|
|
|
| |||
|
| Section 13.1 | Effect on Employment and Service | 14 |
| ||
|
| Section 13.2 | Unfunded Plan | 14 |
| ||
|
| Section 13.3 | Rules of Construction | 15 |
| ||
|
| Section 13.4 | No Rights to Awards | 15 |
| ||
|
| Section 13.5 | No Shareholder Rights | 15 |
| ||
|
| Section 13.6 | Withholding | 15 |
| ||
|
| Section 13.7 | Foreign Employees | 15 |
| ||
|
| Section 13.8 | Severability | 15 |
| ||
|
| Section 13.9 | Compliance with Code Section 409A | 15 |
| ||
|
| Section 13.10 | Governing Law | 16 |
| ||
|
|
|
|
| |||
| Article XIV AMENDMENT, MODIFICATION, AND TERMINATION | 16 |
| ||||
|
|
|
|
| |||
|
| Section 14.1 | Amendment, Modification, and Termination | 16 |
| ||
|
| Section 14.2 | Awards Previously Granted | 16 |
| ||
|
| Section 14.3 | Compliance with Code Section 409A | 16 |
| ||
|
|
|
|
| |||
| Article XV PRE-2008 MANDATORY DEFERRAL OF STOCK AWARDS | 17 |
| ||||
|
|
|
|
| |||
|
| Section 15.1 | Deferred Stock Benefits | 17 |
| ||
|
| Section 15.2 | Dividends | 17 |
| ||
|
| Section 15.3 | Distributions | 17 |
| ||
|
| Section 15.4 | Beneficiaries | 17 |
| ||
|
| Section 15.5 | Termination of Mandatory Deferrals | 18 |
| ||
|
|
|
|
| |||
| Article XVI DURATION OF PLAN | 18 |
| ||||
ii
LOWE’S COMPANIES, INC.
2006 LONG TERM INCENTIVE PLAN
As Amended and Restated Effective February 4, 2017
Article I
INTRODUCTION AND PURPOSE
Lowe’s Companies, Inc. maintains the Lowe’s Companies, Inc. 2006 Incentive Plan under which the Company may make equity awards to non-employee directors and employees who contribute significantly to the profits or growth of the Company. Effective as of February 4, 2017, the Plan is amended and restated as set forth in this instrument to include certain design changes consistent with changes in applicable law and regulations and the general economic and business environment since the Plan was last amended and restated in 2014.
Article II
DEFINITIONS
Section 2.1 Administrator means the Committee and any delegate of the Committee that is appointed in accordance with Section 3.2.
Section 2.2 Agreement means an agreement (including any amendment or supplement thereto) between the Company and a Participant specifying the terms and conditions of a Stock Award, an award of Performance Shares, an Option or a SAR granted to such Participant. An Agreement may be in electronic form, may be limited to a notation on the books and records of the Company and, with the approval of the Administrator, need not be signed by a representative of the Company or a Participant
Section 2.3 Board means the Board of Directors of the Company.
Section 2.4 Cause as a reason for a Participant’s termination of employment as an employee shall have the meaning assigned such term in the employment agreement, if any, between such Participant and the Company or a Subsidiary; provided , however , that if there is no such employment agreement in which such term is defined, “Cause” shall mean (i) the Participant’s willful and continued failure to perform his or her duties with the Company or a Subsidiary (other than any such failure resulting from incapacity due to physical or mental illness, and specifically excluding any failure by the Participant, after reasonable efforts, to meet performance expectations), after a written demand for performance is delivered to the Participant by his or her supervisor which specifically identifies the manner in which the Company or a Subsidiary believes that the Participant has not substantially performed his or her duties and the Participant’s failure to cure such failure, if curable, within 10 days after such written demand is delivered to the Participant or (ii) the willful engaging by the Participant in illegal conduct or gross misconduct which is materially and demonstrably injurious to the Company. For purposes of this provision, no act or failure to act, on the part of the Participant, shall be considered “willful” unless it is done, or omitted to be done, by the Participant in bad faith or without reasonable belief that his or her action or omission was in the best interests of the Company.
Section 2.5 Change in Control means the occurrence of any one of the following events:
(i) individuals who constitute the Board as of the Effective Date (the “Incumbent Directors ”) cease for any reason to constitute at least a majority of the Board, provided that any
1
person becoming a director after the Effective Date and whose election or nomination for election was approved by a vote of at least a majority of the Incumbent Directors then on the Board (either by a specific vote or by approval of the proxy statement of the Company in which such person is named as a nominee for director, without written objection to such nomination) shall be an Incumbent Director; provided , however , that no individual initially elected or nominated as a director of the Company as a result of an actual or threatened election contest (as described in Rule 14a-11 under the Exchange Act (“ Election Contest ”) or other actual or threatened solicitation of proxies or consents by or on behalf of any “person” (as such term is defined in Section 3(a)(9) of the Exchange Act and as used in Section 13(d)(3) and 14(d)(2) of the Exchange Act) other than the Board (“ Proxy Contest ”), including by reason of any agreement intended to avoid or settle any Election Contest or Proxy Contest, shall be deemed an Incumbent Director;
(ii) any person becomes a “beneficial owner” (as defined in Rule 13d-3 under the Exchange Act), directly or indirectly, of securities of the Company representing 25% or more of the combined voting power of the Company’s then outstanding securities eligible to vote for the election of the Board (the “ Company Voting Securities ”); provided , however , that the event described in this paragraph (ii) shall not be deemed to be a Change in Control of the Company by virtue of any of the following acquisitions: (A) an acquisition directly by or from the Company or any Subsidiary; (B) an acquisition by any employee benefit plan (or related trust) sponsored or maintained by the Company or any Subsidiary, (C) an acquisition by an underwriter temporarily holding securities pursuant to an offering of such securities, or (D) an acquisition pursuant to a Non-Qualifying Transaction (as defined in subsection (iii)); or
(iii) the consummation of a reorganization, merger, consolidation, statutory share exchange or similar form of corporate transaction involving the Company that requires the approval of the Company’s shareholders, whether for such transaction or the issuance of securities in the transaction (a “ Reorganization ”), or the sale or other disposition of all or substantially all of the Company’s assets to an entity that is not a Subsidiary of the Company (a “ Sale ”), unless immediately following such Reorganization or Sale: (A) more than 60% of the total voting power of (x) the corporation resulting from such Reorganization or the corporation which has acquired all or substantially all of the assets of the Company (in either case, the “ Surviving Corporation ”), or (y) if applicable, the ultimate parent corporation that directly or indirectly has beneficial ownership of 100% of the voting securities eligible to elect directors of the Surviving Corporation (the “ Parent Corporation ”), is represented by the Company Voting Securities that were outstanding immediately prior to such Reorganization or Sale (or, if applicable, is represented by shares into which such Company Voting Securities were converted pursuant to such Reorganization or Sale), and such voting power among the holders thereof is in substantially the same proportion as the voting power of such Company Voting Securities among the holders thereof immediately prior to the Reorganization or Sale, (B) no person (other than (x) the Company, (y) any employee benefit plan (or related trust) sponsored or maintained by the Surviving Corporation or the Parent Corporation, or (z) a person who immediately prior to the Reorganization or Sale was the beneficial owner of 25% or more of the outstanding Company Voting Securities) is the beneficial owner, directly or indirectly, of 25% or more of the total voting power of the outstanding voting securities eligible to elect directors of the Parent Corporation (or, if there is no Parent Corporation, the Surviving Corporation), and (C) at least a majority of the members of the board of directors of the Parent Corporation (or, if there is no Parent Corporation, the Surviving Corporation) following the consummation of the Reorganization or Sale were Incumbent Directors at the time of the Board’s approval of the execution of the initial agreement providing for such Reorganization or Sale (any Reorganization or Sale which satisfies all of the criteria specified in (A), (B) and (C) above shall be deemed to be a “ Non-Qualifying Transaction ”).
2
Section 2.6 Code means the Internal Revenue Code of 1986, and any amendments thereto.
Section 2.7 Committee means:
(i) the Compensation Committee of the Board, with respect to awards under the Plan to Participants who are not Nonemployee Directors and the administration of such awards; and
(ii) the Executive Committee of the Board, with respect to awards under the Plan to Nonemployee Directors and the administration of such awards.
Notwithstanding the foregoing, at the discretion of the Board from time to time, the Plan may be administered by the Board. During any time that the Board is acting as administrator of the Plan, it shall have all the powers of the Committee hereunder, and any reference herein to the Committee (other than in this Section) shall include the Board. The members of the Committee shall be appointed by, and may be changed at any time and from time to time in the discretion of, the Board.
Section 2.8 Common Stock means the common stock of the Company.
Section 2.9 Company means Lowe’s Companies, Inc., a North Carolina corporation.
Section 2.10 Corresponding SAR means a SAR that is granted in relation to a particular Option and that can be exercised only upon the surrender to the Company, unexercised, of that portion of the Option to which the SAR relates.
Section 2.11 Covered Employee means a Participant who is, or is determined by the Administrator to be likely to become, a “covered employee” within the meaning of Section 162(m) of the Code (or any successor provision).
Section 2.12 Deferred Stock Account means that bookkeeping record established for each Participant who earns a Deferred Stock Benefit. A Deferred Stock Account is established only for purposes of measuring a Deferred Stock Benefit and not to segregate assets or to identify assets that may or must be used to satisfy a Deferred Stock Benefit. A Deferred Stock Account will be credited with the Deferred Stock Benefits attributable to forfeited Stock Awards and awards of Performance Shares in accordance with Article XV.
Section 2.13 Deferred Stock Benefit means the deferred benefit earned by a Participant in accordance with Section 15.1 that results in payments governed by Section 15.3.
Section 2.14 Disability of a Participant means a mental or physical disability that qualifies as a disability under (i) the Social Security Act as evidenced by the issuance of a determination by the Social Security Administration while the Participant is employed that the Participant is disabled or (ii) the long-term disability plan sponsored by the Company or a Subsidiary in which the Participant participates as evidenced by the issuance of a determination by the claims administrator for such plan while the Participant is employed that the Participant is disabled. Notwithstanding the foregoing, with respect to a Participant who is a Nonemployee Director and with respect to an Incentive Stock Option, Disability shall mean “permanent and total disability” as defined in Section 22(e)(3) of the Code.
Section 2.15 Effective Date of the amended and restated Plan set forth in this instrument means February 4, 2017.
3
Section 2.16 Exchange Act means the Securities Exchange Act of 1934, as amended and as in effect on the date of this Agreement.
Section 2.17 Fair Market Value means, on any given date, the closing price of a share of Common Stock as reported on the New York Stock Exchange composite tape on such date, or if the Common Stock was not traded on the New York Stock Exchange on such day, then on the next preceding day that the Common Stock was traded on such exchange, all as reported by such source as the Administrator may select.
Section 2.18 Fiscal Year means the Company’s fiscal year.
Section 2.19 Good Reason for a Participant’s termination of employment with the Company or a Subsidiary following a Change in Control shall have the meaning assigned such term in the employment agreement, if any, between such Participant and the Company or a Subsidiary; provided , however , if there is no such employment agreement in which such term is defined, “Good Reason” shall mean any of the following acts by the Company or a Subsidiary without the consent of the Participant (in each case, other than an isolated, insubstantial and inadvertent action not taken in bad faith and which is remedied by the Company or a Subsidiary within 10 days after receipt of notice thereof given by the Participant): (i) diminution of the Participant’s position, authority, title, reporting requirements, duties, or responsibilities as in effect on the date immediately prior to the Change in Control, (ii) a reduction by the Company or a Subsidiary in the Participant’s base salary as in effect on the date immediately prior to the Change in Control, or (iii) the Company’s requiring the Participant, without his or her consent, to be based at any office or location more than 35 miles from the office or location at which the Participant was based on the date immediately prior to the Change in Control, or to travel on Company business to a substantially greater extent than required immediately prior to the Change in Control.
Section 2.20 Initial Value means, with respect to a SAR, the value the Administrator assigns to the SAR on the date SAR is granted.
Section 2.21 Incentive Stock Option means an Option that is intended to meet the requirements of Section 422 of the Code or any successor provision thereto. An Incentive Stock Option may not be granted to a Nonemployee Director.
Section 2.22 Nonemployee Director means a member of the Board who is not an employee of the Company or a Subsidiary.
Section 2.23 Non-Qualified Stock Option means an Option that is not an Incentive Stock Option.
Section 2.24 Option means a stock option that entitles the holder to purchase from the Company a stated number of shares of Common Stock at the price set forth in an Agreement. An Option may be either an Incentive Stock Option or a Non-Qualified Stock Option.
Section 2.25 Participant means (i) an employee of the Company or a Subsidiary who satisfies the requirements of Article IV and who is selected by the Administrator to receive a Stock Award, an award of Performance Shares, an Option or a SAR or a combination thereof, or who is entitled to a Deferred Stock Benefit or (ii) a Nonemployee Director who receives an award under the Plan.
Section 2.26 Performance Shares means an award, in the amount determined by the Administrator and specified in an Agreement, stated with reference to a specified number of shares of Common Stock, that in accordance with the terms of an Agreement entitles the holder to receive a payment for each specified share equal to the Fair Market Value of Common Stock on the date of payment.
4
Section 2.27 Plan means the Lowe’s Companies, Inc. 2006 Long Term Incentive Plan, as set forth herein and as amended from time to time.
Section 2.28 Retirement of a Participant who is not a Nonemployee Director shall have the meaning assigned such term in the Agreement, provided , however , if such term is not defined in the Agreement, Retirement means the Participant’s voluntary termination of employment on or after the later of (i) 90 days after the Participant has provided written notice to the Company’s Secretary of his or her decision to retire, or (ii) the Participant’s attainment of age 60. The term “Retirement” shall in no event include a termination of the Participant’s employment by the Company or a Subsidiary for Cause. Retirement of a Nonemployee Director means the Nonemployee Director’s voluntary termination of service as a member of the Board on or after the latest of (i) 90 days after the Nonemployee Director has provided written notice to the Company’s Secretary of the Nonemployee Director’s decision to retire, (ii) the Nonemployee Director’s attainment of age 60, and (iii) with respect to a particular award under the Plan, the date that is six months after the award date on which such award was granted. Notwithstanding the foregoing, the Administrator shall have the discretionary power and authority to adopt an alternative definition of Retirement for purposes of any award made under the Plan so long as such alternative definition is set forth in the Agreement for such award.
Section 2.29 SAR means a stock appreciation right that in accordance with the terms of an Agreement entitles the holder to receive, with respect to each share of Common Stock encompassed by the exercise of such SAR, the excess of the Fair Market Value on the date of exercise over the Initial Value. References to “SARs” include both Corresponding SARs and SARs granted independently of Options, unless the context requires otherwise.
Section 2.30 Stock Award means Common Stock or units representing Common Stock awarded to a Participant under Article VIII.
Section 2.31 Subsidiary means a corporation, company or other entity in which the Company has a direct or indirect ownership or other equity interest, provided , however , with respect to an Incentive Stock Option, Subsidiary shall have the meaning set forth in Section 424(f) of the Code.
Article III
ADMINISTRATION
Section 3.1 Committee Authority. The Plan shall be administered by the Administrator. The Administrator shall have the sole authority to grant Stock Awards, Performance Shares, Options and SARs upon such terms (not inconsistent with the provisions of the Plan) as the Administrator may consider appropriate. Such terms may include conditions (in addition to those contained in the Plan) on the exercisability of all or any part of an Option or SAR or on the transferability or forfeitability of a Stock Award or an award of Performance Shares. Notwithstanding any such conditions, pursuant to Article X, the Administrator may, in its discretion, accelerate the time at which any Option or SAR may be exercised, or the time at which a Stock Award may become transferable or nonforfeitable or the time at which an award of Performance Shares may be settled. The Administrator shall have complete authority to interpret all provisions of the Plan; to prescribe the form of Agreements and documents used in connection with the Plan; to adopt, amend, and rescind rules and regulations pertaining to the administration of the Plan; and to make all other determinations necessary or advisable for the administration of the Plan. The express grant in the Plan of any specific power to the Administrator or the Committee shall not be construed as limiting any power or authority of the Administrator or the Committee. Any decision made, or action taken, by the Administrator or the Committee in connection with the administration of the Plan shall be final and conclusive. N
5
either the Administrator nor any member of the Committee shall be liable for any act done in good faith with respect to the Plan or any Agreement, Option, SAR, Stock Award or award of Performance Shares. All expenses of administering the Plan shall be borne by the Company.
Section 3.2 Delegation of Authority. The Committee, in its discretion, may delegate to a special committee consisting of one or more directors who are also officers of the Company or the Executive Committee of the Board, all or part of the Committee’s authority and duties with respect to grants and awards to individuals who at the time of grant are not, and are not anticipated to become, either (i) Covered Employees or (ii) persons subject to the reporting and other provisions of Section 16 of the Exchange Act. The Committee may revoke or amend the terms of a delegation at any time but such action shall not invalidate any prior actions of the Committee’s delegate or delegates that were consistent with the terms of the Plan.
Section 3.3 Indemnification. No member of the Board, the Committee, the Administrator or any employee of the Company or a Subsidiary (each such person, an “ Indemnified Person ”) shall be liable for any action taken or omitted to be taken or any determination made in good faith with respect to the Plan or any award hereunder. Each Indemnified Person shall be indemnified and held harmless by the Company against and from (a) any loss, cost, liability or expense (including attorneys’ fees) that may be imposed upon or incurred by such Indemnified Person in connection with or resulting from any action, suit or proceeding to which such Indemnified Person may be a party or in which such Indemnified Person may be involved by reason of any action taken or omitted to be taken under the Plan or any Award Agreement and (b) any and all amounts paid by such Indemnified Person, with the Company’s approval, in settlement thereof, or paid by such Indemnified Person in satisfaction of any judgment in any such action, suit or proceeding against such Indemnified Person, provided that the Company shall have the right, at its own expense, to assume and defend any such action, suit or proceeding, and, once the Company gives notice of its intent to assume the defense, the Company shall have sole control over such defense with counsel of the Company’s choice. The foregoing right of indemnification shall not be available to an Indemnified Person to the extent that a court of competent jurisdiction in a final judgment or other final adjudication, in either case not subject to further appeal, determines that the acts or omissions of such Indemnified Person giving rise to the indemnification claim resulted from such Indemnified Person’s bad faith, fraud or willful criminal act or omission or that such right of indemnification is otherwise prohibited by law or by the Company’s Articles of Incorporation or Bylaws. The foregoing right of indemnification shall not be exclusive of any other rights of indemnification to which Indemnified Persons may be entitled under the Company’s Articles of Incorporation or Bylaws, as a matter of law, or otherwise, or any other power that the Company may have to indemnify such Indemnified Persons or hold them harmless.
Article IV
ELIGIBILITY
Any Nonemployee Director and any employee of the Company or a Subsidiary (including a corporation that becomes a Subsidiary after the adoption of the Plan) who the Administrator, in its sole discretion, determines has contributed significantly or can be expected to contribute significantly to the profits or growth of the Company or a Subsidiary shall be eligible to participate in the Plan.
6
Article V
STOCK SUBJECT TO PLAN; AWARD LIMITATIONS
Section 5.1 Sources of Shares Issued. Share of Common Stock issued under the Plan may be original issue shares or shares purchased in the open market or otherwise, all as determined by the Chief Financial Officer of the Company (or his or her designee), unless otherwise determined by the Administrator.
Section 5.2 Aggregate Limit. Subject to adjustment as provided in Article XI, the total number of shares of Common Stock that shall be available for issuance under the Plan pursuant to Awards made on and after March 21, 2014 is 40,000,000.
Section 5.3 Awards Made and Plan Terms in Effect Prior to the Effective Date. Any awards made under the Plan before the Effective Date shall remain in full force and effect.
Section 5.4 Share Counting. The Administrator may adopt reasonable counting procedures to ensure appropriate counting, avoid double counting and make adjustments in the number of shares of Common Stock available under Section 5.2 if the number of shares of Common Stock actually delivered to a Participant differs from the number of shares of Common Stock previously counted in connection with an award to the Participant, subject, however, to the following:
(i) Common Stock subject to an award (whether granted under the Plan before or after the Effective Date) that is canceled, expired, forfeited, settled in cash or is otherwise terminated without a delivery of Common Stock to the Participant will again be available for award under the Plan.
(ii) Common Stock that is withheld in payment of the exercise price of an Option or in payment of withholding taxes relating to an award shall be deemed to constitute Common Stock delivered to the Participant and shall not be available for awards under the Plan.
(iii) Upon the exercise of an Option or if a SAR is settled with Common Stock, the total number of shares of Common Stock subject to the Option or SAR (as the case may be) shall be deemed delivered to the Participant (regardless of the number of shares of Common Stock actually paid to the Participant) and shall not be available for awards under the Plan.
(iv) Shares of Common Stock issued in settlement of a Deferred Stock Benefit, and the shares of Common Stock subject to the Option, Stock Award or Performance Share award (or portion thereof) with respect to which such Deferred Stock Benefit was earned or elected, shall be counted toward the limitation in Section 5.2 only once (even in the case of shares subject to a Stock Award that are cancelled in connection with the Deferred Stock Benefit); provided , however , that shares of Common Stock issued in settlement of a Deferred Stock Benefit that constitute earnings on deferred or forfeited shares of Common Stock shall be counted separately toward such limitation.
Section 5.5 Award Limitations-Employees. Notwithstanding any other provision of the Plan to the contrary, in no event shall any Participant who is an employee of the Company or a Subsidiary receive in any Fiscal Year, subject to adjustment as provided in Article XI:
(i) an award of Options with respect to more than 2,000,000 shares of Common Stock; provided, however , that in connection with the Participant’s commencement as an employee, the Participant may be granted Options with respect to up to an additional 1,000,000 shares of Common Stock, which shall not count against the foregoing Fiscal Year limit;
7
(ii) an award of SARs with respect to more than 1,500,000 shares of Common Stock; provided, however , that in connection with the Participant’s commencement as an employee, the Participant may be granted SARs with respect to up to an additional 1,000,000 shares of Common Stock, which shall not count against the foregoing Fiscal Year limit;
(iii) a Stock Award that will become vested or transferable based on performance objectives described in Section 8.3 with respect to more than 600,000 shares of Common Stock; or
(iv) Performance Shares with respect to more than 600,000 shares of Common Stock.
Section 5.6 Award Limitations-Nonemployee Directors. Notwithstanding any other provision of the Plan to the contrary, in no event shall the grant date value of awards granted under the Plan during any Fiscal Year to any Participant who is a Nonemployee Director exceed $500,000.
Article VI
OPTIONS
Section 6.1 Award. The Administrator will designate each Participant to whom an Option is to be granted and will specify the terms of the Option, including the vesting schedule, whether the Option is an Incentive Stock Option or a Non-Qualified Stock Option, and the number of shares of Common Stock covered by such awards.
Section 6.2 Option Price. The price per share for Common Stock purchased on the exercise of an Option shall be determined by the Administrator on the date of grant, but shall not be less than the Fair Market Value on the date the Option is granted.
Section 6.3 Maximum Option Period. The maximum period in which an Option may be exercised shall be determined by the Administrator on the date of grant, except that no Option shall be exercisable after the expiration of ten years from the date such Option was granted. The terms of any Option may provide that it is exercisable for a period less than such maximum period.
Section 6.4 Ten Percent Shareholders. Notwithstanding Sections 6.2 and 6.3, no Incentive Stock Option shall be granted to any individual who, at the date of grant, owns stock possessing more than 10% of the total combined voting power of all classes of stock of the Company or any Subsidiary unless the exercise price per share of such Option is at least 110% of the Fair Market Value per share of Common Stock at the date of grant and the Option expires no later than five years after the date of grant.
Section 6.5 Limit for Incentive Stock Options. The aggregate Fair Market Value (determined as of the time the Option is granted) of all shares of Common Stock with respect to which Incentive Stock Options are first exercisable by a Participant in any calendar year may not exceed $100,000.
Section 6.6 Exercise. Subject to the other provisions of the Plan and the applicable Agreement, an Option may be exercised in whole at any time or in part from time to time at such times and in compliance with such requirements as the Administrator shall determine. An Option granted under the Plan may be exercised with respect to any number of whole shares less than the full number for which the Option could be exercised. A partial exercise of an Option shall not affect the right to exercise the Option from time to time in accordance with the Plan and the applicable Agreement with respect to the remaining shares subject to the Option. The exercise of an Option shall result in the termination of any Corresponding SAR to the extent of the number of shares with respect to which the Option is exercised.
8
Section 6.7 Payment. Unless otherwise provided by the Agreement, payment of the Option price shall be made in cash or a cash equivalent acceptable to the Administrator (including “cashless exercise” arrangements). If the Agreement provides, payment of all or part of the Option price may be made by surrendering shares of Common Stock to the Company (by attestation of ownership or actual delivery of one or more certificates). If Common Stock is used to pay all or part of the Option price, the sum of the cash and cash equivalent and the Fair Market Value (determined as of the day preceding the date of exercise) of the shares surrendered must not be less than the Option price of the shares for which the Option is being exercised.
Section 6.8 Disposition of Stock. A Participant shall notify the Company of any sale or other disposition of Common Stock acquired pursuant to an Option that was an Incentive Stock Option if such sale or disposition occurs (i) within two years of the grant of an Option or (ii) within one year of the issuance of the Common Stock to the Participant. Such notice shall be in writing and directed to the Secretary of the Company.
Article VII
SARS
Section 7.1 Award. The Administrator will designate each Participant to whom SARs are to be granted and will specify the number of shares covered by such awards; provided , however , no Participant may be granted Corresponding SARs (under all incentive plans of the Company and its affiliates) that are related to Incentive Stock Options which are first exercisable in any calendar year for stock having an aggregate Fair Market Value (determined as of the date the related Option is granted) that exceeds $100,000.
Section 7.2 Initial Value. The Initial Value of an SAR shall be determined by the Administrator on the date of grant, but shall not be less than the Fair Market Value on the date the SAR is granted.
Section 7.3 Maximum SAR Period. The term of each SAR shall be determined by the Administrator on the date of grant, except that no Corresponding SAR shall have a term of more than ten years from the date such related Option was granted (or, if Section 6.4 applies, five years from such date of grant).
Section 7.4 Exercise. Subject to the other provisions of the Plan and the applicable Agreement, a SAR may be exercised in whole at any time or in part from time to time at such times and in compliance with such requirements as the Administrator shall determine; provided , however , that a Corresponding SAR may be exercised only to the extent that the related Option is exercisable and only when the Fair Market Value exceeds the option price of the related Option. A SAR granted under the Plan may be exercised with respect to any number of whole shares less than the full number for which the SAR could be exercised. A partial exercise of a SAR shall not affect the right to exercise the SAR from time to time in accordance with the Plan and the applicable Agreement with respect to the remaining shares subject to the SAR. The exercise of a Corresponding SAR shall result in the termination of the related Option to the extent of the number of shares with respect to which the SAR is exercised.
9
Section 7.5 Settlement. At the Administrator’s discretion, the amount payable as a result of the exercise of a SAR may be settled in cash, Common Stock, or a combination of cash and Common Stock. No fractional share will be deliverable upon the exercise of a SAR but a cash payment will be made in lieu thereof.
Article VIII
STOCK AWARDS
Section 8.1 Award. The Administrator will designate each Participant to whom a Stock Award is to be made and will specify the number of shares of Common Stock covered by such awards. Stock Awards may be shares of Common Stock or units representing shares of Common Stock.
Section 8.2 Vesting. A Participant’s rights in a Stock Award shall be forfeitable or otherwise restricted for such period of time, if any, or subject to such conditions as may be set forth in the Agreement. The period of restriction of a Stock Award granted to a Participant who is not an Outside Director shall be at least three years; provided , however , that the minimum period of restriction for such Participant shall be at least one year in the case of a Stock Award that will become transferable and nonforfeitable on account of the satisfaction of performance objectives prescribed by the Administrator.
Section 8.3 Performance Objectives. In accordance with Section 8.2, the Administrator may prescribe that Stock Awards will become vested or transferable or both based on performance objectives. Performance objectives may be described in terms of Company-wide objectives or objectives that are related to the performance of the individual Participant or of a Subsidiary, division, department, region or function within the Company or a Subsidiary. Performance objectives may be made relative to the performance of other corporations. Performance objectives applicable to any award to a Covered Employee shall be based on specified levels of or change in one or more of the following criteria: (i) the Company’s net income or pre-tax earnings, (ii) the Company’s net income or pre-tax earnings in relation to non-cash beginning assets (beginning assets less beginning cash and short-term investments), (iii) the achievement by the Company, a Subsidiary or an operating unit of stated objectives with respect to profitability, return on equity, earnings per share, total earnings, return on capital or return on assets, (iv) the Fair Market Value of Common Stock, (v) revenues, (vi) total stockholder return, (vii) operating earnings or margin, (viii) economic profit or value created, (ix) strategic business criteria consisting of one or more objectives based on meeting specified goals relating to market share or penetration, geographic business expansion, cost targets, customer or employee satisfaction, human resources management, diversity, employee health, employee safety, productivity, supervision of litigation or information technology or acquisitions or divestitures of subsidiaries, affiliates or joint ventures, (x) inventory, inventory turns or inventory shrinkage, (xi) receivables turnover, (xii) stocking and other labor hours, (xiii) markdowns or (xiv) any combination of the foregoing. If the Administrator determines that a change in the business, operations, corporate structure or capital structure of the Company, or the manner in which it conducts its business, or other events or circumstances (including those events and circumstances described in Article XI) render the performance objectives unsuitable, the Administrator may in its discretion modify such performance objectives or the related minimum acceptable level of achievement, in whole or in part, as the Administrator deems appropriate and equitable, except in the case of a Covered Employee to the extent that such action would result in the loss of the otherwise available exemption of the award under Section 162(m) of the Code. No payments will be made with respect to Stock Awards subject to performance objectives unless, and then only to the extent that, the Administrator certifies that stated performance objectives have been achieved.
Section 8.4 Shareholder Rights. Prior to their forfeiture in accordance with the terms of the applicable Agreement, a Participant will have all rights of a shareholder with respect to a Stock Award c
10
onsisting of shares of Common Stock, including the right to receive dividends and vote the shares, unless such rights are limited by the terms of the applicable Agreement; provided , however , that during such period (i) a Participant may not sell, transfer, pledge, exchange, hypothecate, or otherwise dispose of shares of Common Stock granted pursuant to or represented by a Stock Award, (ii) the Company shall retain custody of the shares of Common Stock granted pursuant to or represented by a Stock Award, and (iii) the Participant will deliver to the Company a stock power, endorsed in blank, with respect to each Stock Award. The limitations set forth in the preceding sentence shall not apply after the shares of Common Stock granted under or represented by the Stock Award are transferable and are no longer forfeitable.
Article IX
PERFORMANCE SHARE AWARDS
Section 9.1 Award. The Administrator will designate each Participant to whom an award of Performance Shares is to be made and will specify the number of shares of Common Stock covered by such awards.
Section 9.2 Earning the Award. The Administrator, on the date of the grant of an award, shall prescribe that the Performance Shares, or portion thereof, will be earned, and the Participant will be entitled to receive payment pursuant to the award of Performance Shares, only upon the satisfaction of performance objectives and such other criteria as may be prescribed by the Administrator during a performance measurement period of at least one year. Performance objectives may be described in terms of Company-wide objectives or objectives that are related to the performance of the individual Participant or of a Subsidiary, division, department, region or function within the Company or a Subsidiary. Performance objectives may be made relative to the performance of other corporations. Performance objectives applicable to any award of Performance Shares to a Covered Employee shall be based on specified levels of or change in one or more of the following criteria: (i) the Company’s net income or pre-tax earnings, (ii) the Company’s net income or pre-tax earnings in relation to non-cash beginning assets (beginning assets less beginning cash and short-term investments), (iii) the achievement by the Company, a Subsidiary or an operating unit of stated objectives with respect to profitability, return on equity, earnings per share, total earnings, return on capital or return on assets, (iv) the Fair Market Value of Common Stock, (v) revenues, (vi) total stockholder return, (vii) operating earnings or margin, (viii) economic profit or value created, (ix) strategic business criteria consisting of one or more objectives based on meeting specified goals relating to market share or penetration, geographic business expansion, cost targets, customer or employee satisfaction, human resources management, diversity, employee health, employee safety, productivity, supervision of litigation or information technology or acquisitions or divestitures of subsidiaries, affiliates or joint ventures, (x) inventory, inventory turns or inventory shrinkage, (xi) receivables turnover, (xii) stocking and other labor hours, (xiii) markdowns or (xiv) any combination of the foregoing. If the Administrator determines that a change in the business, operations, corporate structure or capital structure of the Company, or the manner in which it conducts its business, or other events or circumstances (including those events and circumstances described in Article XI) render the performance objectives unsuitable, the Administrator may in its discretion modify such performance objectives or the related minimum acceptable level of achievement, in whole or in part, as the Administrator deems appropriate and equitable, except in the case of a Covered Employee to the extent that such action would result in the loss of the otherwise available exemption of the award under Section 162(m) of the Code. No payments will be made with respect to Performance Shares unless, and then only to the extent that, the Administrator certifies that stated performance objectives have been achieved.
11
Section 9.3 Payment. In the discretion of the Administrator, the amount payable when an award of Performance Shares is earned may be settled in cash, by the issuance of Common Stock or a combination of cash and Common Stock. A fractional share shall not be deliverable when an award of Performance Shares is earned, but a cash payment will be made in lieu thereof. The Administrator may, at or after the date of award of Performance Shares, provide for the payment of contingent dividends or dividend equivalents to the holder thereof either in cash or in additional shares of Common Stock, provided such dividends or dividend equivalents shall be paid to the Participant only if the Performance Shares with respect to which such dividends or dividend equivalents are payable are earned by the Participant.
Article X
PROVISIONS APPLICABLE TO AWARDS GENERALLY
Section 10.1 Recoupment of Awards. The Administrator may require in any Agreement that any current or former Participant reimburse the Company for all or any portion of any award, terminate any outstanding, unexercised, unexpired or unpaid award, rescind any exercise, payment or delivery pursuant to an award or recapture any shares of Common Stock (whether restricted or unrestricted) or proceeds from the Participant’s sale of shares of Common Stock issued pursuant to an award made under the Plan to the extent required by any recoupment or clawback policy adopted by the Administrator in its discretion or to comply with the requirements of any applicable laws.
Section 10.2 Limits on Transfer. No right or interest of a Participant in any unexercised or restricted award issued under the Plan may be pledged, encumbered, or hypothecated to or in favor of any party other than the Company or a Subsidiary, or shall be subject to any lien, obligation, or liability of such Participant to any other party other than the Company or a Subsidiary. No unexercised or restricted award shall be assignable or transferable by a Participant other than by will or the laws of descent and distribution.
Section 10.3 Share Certificates. All certificates for Common Stock or other securities of the Company delivered under the Plan pursuant to any award or the exercise thereof shall be subject to such stop transfer orders and other restrictions as the Administrator may deem advisable under the Plan, the applicable Award Agreement or the rules, regulations and other requirements of the Securities and Exchange Commission, the New York Stock Exchange or any other stock exchange or quotation system upon which such Common Stock or other securities are then listed or reported and any applicable federal or state laws, and the Administrator may cause a legend or legends to be put on any such certificates to make appropriate reference to such restrictions. Notwithstanding any other provision of this Plan to the contrary, the Company may elect to satisfy any requirement under this Plan for the delivery of stock certificates through the use of book-entry.
Section 10.4 Acceleration upon a Change in Control. Except as otherwise provided in the Agreement, upon termination of an employee Participant’s employment by the Company without Cause, or by an employee Participant for Good Reason, within a period of one year following the occurrence of a Change in Control, all outstanding Options and SARs held by such Participant shall become fully exercisable and all restrictions and performance conditions on outstanding Stock Awards and awards of Performance Shares held by such Participant shall lapse. To the extent that this provision causes Incentive Stock Options to exceed the $100,000 limitation set forth in Section 6.5, the excess Options shall be deemed to be Non-Qualified Stock Options.
Section 10.5 Acceleration for Other Reasons. The Committee may in its sole discretion at any time determine that all or a portion of a Participant’s Options or SARs shall become fully or partially exercisable, or that all or a part of the restrictions and performance conditions on all or a portion of any o
12
utstanding Stock Awards and Performance Shares shall lapse, in either case, as of such date as the Committee may, in its sole discretion, declare. The Committee may discriminate among Participants and among awards granted to a Participant in exercising its discretion pursuant to this Section 10.5. To the extent that this provision causes Incentive Stock Options to exceed the $100,000 limitation set forth in Section 6.5, the excess Options shall be deemed to be Non-Qualified Stock Options.
Section 10.6 Effect of Acceleration. If an award is accelerated under the Plan, the Committee may, in its sole discretion, provide (i) that the award will expire after a designated period of time after such acceleration to the extent not then exercised, (ii) that the award will be settled in cash rather than Common Stock, (iii) that the award will be assumed by another party to the transaction giving rise to the acceleration or otherwise be equitably converted in connection with such transaction, or (iv) any combination of the foregoing. The Committee’s determination need not be uniform and may be different for different Participants whether or not such Participants are similarly situated.
Section 10.7 Termination of Employment. Whether military, government or other service or other leave of absence shall constitute a termination of employment shall be determined in each case by the Committee at its discretion, and any determination by the Committee shall be final and conclusive. A termination of employment shall not occur (i) in a circumstance in which a Participant transfers from the Company to one of its Parents or Subsidiaries, transfers from a Subsidiary to the Company, or transfers from one Subsidiary to another Subsidiary, or (ii) in the discretion of the Committee as specified at or prior to such occurrence, in the case of a spin-off, sale or disposition of the Participant’s employer from the Company or any Subsidiary. To the extent that this provision causes Incentive Stock Options to extend beyond three months from the date a Participant is deemed to be an employee of the Company or a Subsidiary for purposes of Section 424(f) of the Code, the Options held by such Participant shall be deemed to be Non-Qualified Stock Options.
Section 10.8 Form of Payment for Awards. Subject to the terms of the Plan and any applicable law or Agreement, payments or transfers to be made by the Company or a Subsidiary on the grant or exercise of an award may be made in such form as the Committee determines at or after the time of grant, including without limitation, cash, Common Stock, other awards, or other property, or any combination, and may be made in a single payment or transfer, in installments, or on a deferred basis.
Article XI
ADJUSTMENT UPON CHANGE IN COMMON STOCK
In the event of a corporate transaction involving the Company (including, without limitation, any stock dividend, stock split, extraordinary cash dividend, recapitalization, reorganization, merger, consolidation, split-up, spin-off, combination or exchange of shares), the limitations under Sections 5.2 and 5.5 shall be adjusted proportionately, and the Committee shall adjust Options, SARs, Performance Shares, Stock Awards and Deferred Stock Benefits to preserve the benefits or potential benefits of such awards. Action by the Committee may include: (i) adjustment of the number and kind of shares which may be delivered under the Plan; (ii) adjustment of the number and kind of shares subject to outstanding awards; (iii) adjustment of the exercise price of outstanding awards; and (iv) any other adjustments that the Committee determines to be equitable. Without limiting the foregoing, in the event a stock dividend or stock split is declared upon the Common Stock, the authorization limits under Sections 5.2 and 5.5 shall be increased proportionately, and the shares of Common Stock then subject to each Option, SAR, Performance Share, Stock Award and Deferred Stock Benefit shall be increased proportionately without any change in the aggregate purchase price therefor.
13
The issuance by the Company of shares of stock of any class, or securities convertible into shares of stock of any class, for cash or property, or for labor or services, either upon direct sale or upon the exercise of rights or warrants to subscribe therefor, or upon conversion of shares or obligations of the Company convertible into such shares or other securities, shall not affect, and no adjustment by reason thereof shall be made with respect to, the maximum number of shares that may be granted or distributed under the Plan; the per individual limitations on the number of shares for which Options, SARs, Performance Shares and Stock Awards may be granted; or the terms of outstanding Stock Awards, Options, Performance Shares or SARs or undistributed Deferred Stock Benefits.
The Committee may make Stock Awards and may grant Options, SARs, and Performance Shares in substitution for similar awards held by an individual who becomes an employee of the Company or a Subsidiary in connection with a transaction described in the first paragraph of this Article XI. Notwithstanding any provision of the Plan (other than the limitation of Section 5.2), the terms of such substituted awards shall be as the Committee, in its discretion, determines is appropriate.
Article XII
COMPLIANCE WITH LAW AND
APPROVAL OF REGULATORY BODIES
No Option or SAR shall be exercisable, no Common Stock shall be issued, no shares of Common Stock shall be delivered, and no payment shall be made under the Plan except in compliance with all applicable federal and state laws and regulations (including, without limitation, withholding tax requirements), any listing agreement to which the Company is a party, and the rules of all domestic stock exchanges on which the Company’s shares may be listed. The Company shall have the right to rely on an opinion of its counsel as to such compliance. Any share certificate issued to evidence Common Stock when a Stock Award is granted, a Performance Share is settled or for which an Option or SAR is exercised may bear such legends and statements as the Administrator may deem advisable to assure compliance with federal and state laws and regulations. No Option or SAR shall be exercisable, no Stock Award or Performance Share shall be granted, no Common Stock shall be issued, no certificate for shares shall be delivered, and no payment shall be made under the Plan until the Company has obtained such consent or approval as the Administrator may deem advisable from regulatory bodies having jurisdiction over such matters.
Article XIII
GENERAL PROVISIONS
Section 13.1 Effect on Employment and Service. Neither the adoption of the Plan, its operation, nor any documents describing or referring to the Plan (or any part thereof), shall confer upon any individual any right to continue in the employ or service of the Company or a Subsidiary or in any way affect any right and power of the Company or a Subsidiary to terminate the employment or service of any individual at any time with or without assigning a reason therefor.
Section 13.2 Unfunded Plan. The Plan, insofar as it provides for grants, shall be unfunded, and the Company shall not be required to segregate any assets that may at any time be represented by grants under the Plan. Any liability of the Company to any person with respect to any grant under the Plan shall be based solely upon any contractual obligations that may be created pursuant to the Plan. No such obligation of the Company shall be deemed to be secured by any pledge of, or other encumbrance on, any property of the Company.
14
Section 13.3 Rules of Construction. Headings are given to the articles and sections of the Plan solely as a convenience to facilitate reference. The reference to any statute, regulation, or other provision of law shall be construed to refer to any amendment to or successor of such provision of law.
Section 13.4 No Rights to Awards. No Participant or any eligible participant shall have any claim to be granted any award under the Plan, and neither the Company nor the Committee is obligated to treat Participants or eligible participants uniformly.
Section 13.5 No Shareholder Rights. Subject to Section 8.4, no award gives the Participant any of the rights of a shareholder of the Company unless and until shares of Common Stock are in fact issued to such person in connection with such award.
Section 13.6 Withholding. The Company or any Subsidiary shall have the authority and the right to deduct or withhold, or require a Participant to remit to the Company, an amount up to the maximum statutory rate to satisfy federal, state, local and foreign taxes (including the Participant’s FICA obligation) with respect to any taxable event arising as a result of the Plan. With respect to withholding required upon any taxable event under the Plan, the Committee may, at the time the award is granted or thereafter, require or permit that any such withholding be satisfied, in whole or in part, by withholding from the award shares of Common Stock having a Fair Market Value on the date of withholding equal to an amount up to the maximum statutory rate, all in accordance with such procedures as the Administrator establishes.
Section 13.7 Foreign Employees. In order to facilitate the making of any award under the Plan, the Administrator may provide for such special terms for awards to Participants who are foreign nationals or who are employed by the Company or any Subsidiary outside of the United States of America as the Administrator may consider necessary or appropriate to accommodate differences in local law, tax policy or custom. Moreover, the Administrator may approve such supplements to or amendments, restatements or alternative versions of the Plan as it may consider necessary or appropriate for such purposes, without thereby affecting the terms of the Plan as in effect for any other purpose, and the Corporate Secretary or other appropriate officer of the Company may certify any such document as having been approved and adopted in the same manner as the Plan. No such special terms, supplements, amendments or restatements, however, shall include any provisions that are inconsistent with the terms of the Plan as then in effect unless the Plan could have been amended to eliminate such inconsistency without further approval by the shareholders of the Company.
Section 13.8 Severability. If any provision of the Plan or any award is or becomes or is deemed to be invalid, illegal or unenforceable in any jurisdiction or as to any person or award, or would disqualify the Plan or any award under any law deemed applicable by the Administrator, such provision shall be construed or deemed amended to conform to the applicable laws, or if it cannot be construed or deemed amended without, in the determination of the Administrator, materially altering the intent of the Plan or the award, such provision shall be construed or deemed stricken as to such jurisdiction, person or award and the remainder of the Plan and any such award shall remain in full force and effect.
Section 13.9 Compliance with Code Section 409A. The Plan is intended to comply with Section 409A of the Code. Notwithstanding any provision of the Plan to the contrary, the Plan shall be interpreted, operated and administered consistent with this intent. For each award intended to comply with the short-term deferral exception provided for under Section 409A of the Code, the related Award Agreement shall provide that such award shall be paid out by the later of (a) the 15th day of the third month following the Participant’s first taxable year in which the award is no longer subject to a substantial risk of forfeiture or (b) the 15th day of the third month following the end of the Company’s first taxable year in which the award is no longer subject to a substantial risk of forfeiture. To the extent that the Administrator determines that a
15
Participant would be subject to the additional 20% tax imposed on certain deferred compensation arrangements pursuant to Section 409A of the Code as a result of any provision of any award, to the extent permitted by Section 409A of the Code, such provision shall be deemed amended to the minimum extent necessary to avoid application of such additional tax. The Committee shall determine the nature and scope of such amendment. To the extent required by Section 409A of the Code, any payment under the Plan made in connection with the separation from service of a “specified employee” (within the meaning of Section 409A of the Code) of an award that is deferred compensation that is subject to Section 409A of the Code shall not be made earlier than six (6) months after the date of such separation from service.
Section 13.10 Governing Law. To the extent not governed by federal law, the Plan and all Agreements shall be construed in accordance with and governed by the laws of the State of North Carolina.
Article XIV
AMENDMENT, MODIFICATION, AND TERMINATION
Section 14.1 Amendment, Modification, and Termination. The Committee may, at any time and from time to time, amend, modify or terminate the Plan without shareholder approval; provided , however , that the Committee may condition any amendment or modification on the approval of shareholders of the Company if such approval is necessary or deemed advisable with respect to tax, securities or other applicable laws, policies or regulations.
Section 14.2 Awards Previously Granted. At any time and from time to time, the Committee may amend, modify or terminate any outstanding award without approval of the Participant; provided , however :
(i) subject to the terms of the applicable Agreement, such amendment, modification or termination shall not, without the Participant’s consent, reduce or diminish the value of such award determined as if the award had been exercised, vested, cashed in or otherwise settled on the date of such amendment or termination;
(ii) the original term of an Option or SAR may not be extended; and
(iii) without the further approval of the shareholders of the Company, (A) no amendment or modification of an Option or SAR shall reduce the Option exercise price or the Initial Value of the SAR, (B) no Option or SAR shall be cancelled in exchange for cash, other awards or Options or SARs having a lower Option exercise price or SAR Initial Value and (C) no amendment or modification may increase the dollar limitation in Section 5.6. For avoidance of doubt, clauses (A) and (B) of this Section 14.2(iii) are intended to prohibit the repricing of “underwater” Options and SARs, except as otherwise expressly permitted by the anti-dilution provision in Article XI.
Section 14.3 Compliance with Code Section 409A. The Plan is intended to comply with Section 409A of the Code. Notwithstanding any provision of the Plan to the contrary, the Plan shall be interpreted, operated and administered consistent with this intent. For each award intended to comply with the short-term deferral exception provided for under Section 409A of the Code, the related Agreement shall provide that such award shall be paid out by the later of (a) the 15th day of the third month following the Participant’s first taxable year in which the award is no longer subject to a substantial risk of forfeiture or (b) the 15th day of the third month following the end of the Company’s first taxable year in which the award is no longer subject to a substantial risk of forfeiture. To the extent the Administrator determines that a Participant would be subject to the additional 20% tax imposed on certain deferred compensation arrangements pursuant to S
16
ection 409A of the Code as a result of any provision of any award, to the extent permitted by Section 409A of the Code, such provision shall be deemed amended to the minimum extent necessary to avoid application of such additional tax. The Administrator shall determine the nature and scope of such amendment. To the extent required by Section 409A of the Code, any payment under the Plan made in connection with the separation from service of a “specified employee” (within the meaning of Section 409A of the Code) of an award that is deferred compensation that is subject to Section 409A of the Code shall not be made earlier than six (6) months after the date of such separation from service.
Article XV
PRE-2008 MANDATORY DEFERRAL OF STOCK AWARDS
Section 15.1 Deferred Stock Benefits. A Deferred Stock Benefit was earned by a Participant who was an employee of the Company or a Subsidiary and whose applicable employee remuneration, as defined in Code Section 162(m)(4), exceeded the limit in Code Section 162(m)(1) prior to January 1, 2009. Such Deferred Stock Benefit consists of a credit equal to the portion of a Stock Award or an award of Performance Shares that, pursuant to procedures established by the Administrator, was forfeited because its vesting or transferability, or its settlement, prior to January 1, 2009 would have caused the limit in Code Section 162(m)(1) to be exceeded. Deferred Stock Benefits were credited to a Deferred Stock Account and are credited with earnings as described in Section 15.2. Deferred Stock Benefits may not be assigned by a Participant.
Section 15.2 Dividends. A Deferred Stock Account shall be credited with any dividends that would have been paid on the whole shares of Common Stock credited to the Deferred Stock Account. A Deferred Stock Account shall be credited with the number of whole and fractional shares of Common Stock that a Participant could have purchased with such dividends based on the Fair Market Value on the day before such dividends are credited to the account. The Deferred Stock Account shall be credited as of the day that dividends are paid on the Common Stock.
Section 15.3 Distributions. Deferred Stock Benefits will be paid to a Participant who is an employee of the Company or a Subsidiary in a single sum no later than the last day of the Company’s Fiscal Year in which the distribution would not result in the Participant’s applicable employee remuneration, as defined in Code Section 162(m)(4), to exceed the limit in Code Section 162(m)(1). A Deferred Stock Benefit shall be distributed in shares of Common Stock, and cash in lieu of fractional shares, equal to the number of whole and fractional shares of Common Stock credited to the Participant’s Deferred Stock Account on the last day of the month preceding the month of distribution.
Section 15.4 Beneficiaries. A Participant may designate one or more beneficiaries, on a form acceptable to the Administrator or its designee, to receive the Participant’s Deferred Stock Benefits in the event of the Participant’s death. If there is no valid designation by the Participant, or if the designated beneficiary fails to survive the Participant or otherwise fails to take the benefit, the Participant’s beneficiary is the first of the following who survives the Participant: a Participant’s spouse (the person legally married to the Participant at the time of the Participant’s death), the Participant’s children in equal shares, and the Participant’s estate.
17
Section 15.5 Termination of Mandatory Deferrals. Notwithstanding any contrary provision of the Plan, no Participant shall earn a Deferred Stock Benefit under the Plan with respect to any Stock Award or award of Performance Shares outstanding or awarded on and after January 1, 2009.
Article XVI
DURATION OF PLAN
No Stock Award, Performance Share award, Option or SAR may be granted under the Plan after March 20, 2024. Stock Awards, Performance Shares awards, Options and SARs granted before that date shall remain valid in accordance with their terms. The Plan shall remain in effect with respect to Deferred Stock Benefits until all Deferred Stock Accounts have been distributed in full, unless sooner terminated in accordance with Article XIV.
18
Exhibit 12.1
Lowe’s Companies, Inc.
Statement Re Computation of Ratio of Earnings to Fixed Charges
In Millions, Except Ratio Data
|
| |||||||||||||||||||||||||||||||||||||
|
|
|
|
|
|
|
|
|
|
|
|
|
|
|
|
|
|
|
|
| ||||||||||||||||||
|
| Fiscal Years Ended On | ||||||||||||||||||||||||||||||||||||
|
| February 1, 2013 |
|
| January 31, 2014 |
|
| January 30, 2015 |
|
| January 29, 2016 4 |
|
| February 3, 2017 |
| |||||||||||||||||||||||
| Earnings: |
|
|
|
|
|
|
|
|
| ||||||||||||||||||||||||||||
| Earnings Before Income Taxes | $ | 3,137 |
|
| $ | 3,673 |
|
| $ | 4,276 |
|
| $ | 4,419 |
|
| $ | 5,201 |
| ||||||||||||||||||
| Fixed Charges | 605 |
|
| 623 |
|
| 677 |
|
| 720 |
|
| 847 |
| |||||||||||||||||||||||
| Capitalized Interest 1 | 6 |
|
| 8 |
|
| 9 |
|
| 9 |
|
| 8 |
| |||||||||||||||||||||||
| Adjusted Earnings | $ | 3,748 |
|
| $ | 4,304 |
|
| $ | 4,962 |
|
| $ | 5,148 |
|
| $ | 6,056 |
| ||||||||||||||||||
|
|
|
|
|
|
|
|
|
|
| ||||||||||||||||||||||||||||
| Fixed Charges: |
|
|
|
|
|
|
|
|
| ||||||||||||||||||||||||||||
| Interest Expense 2 | 463 |
|
| 478 |
|
| 525 |
|
| 559 |
|
| 659 |
| |||||||||||||||||||||||
| Rental Expense 3 | 142 |
|
| 145 |
|
| 152 |
|
| 161 |
|
| 188 |
| |||||||||||||||||||||||
| Total Fixed Charges | $ | 605 |
|
| $ | 623 |
|
| $ | 677 |
|
| $ | 720 |
|
| $ | 847 |
| ||||||||||||||||||
|
|
|
|
|
|
|
|
|
|
| ||||||||||||||||||||||||||||
|
|
|
|
|
|
|
|
|
|
| ||||||||||||||||||||||||||||
| Ratio of Earnings to Fixed Charges | 6.2 |
|
| 6.9 |
|
| 7.3 |
|
| 7.1 |
|
| 7.2 |
| |||||||||||||||||||||||
|
|
| ||||||||||||||||||||||||||||||||||||
| 1 | Includes the net of subtractions for interest capitalized and additions for amortization of previously-capitalized interest. | ||||||||||||||||||||||||||||||||||||
|
|
| ||||||||||||||||||||||||||||||||||||
| 2 | Interest accrued on uncertain tax positions is excluded from Interest Expense in the computation of Fixed Charges. | ||||||||||||||||||||||||||||||||||||
|
|
| ||||||||||||||||||||||||||||||||||||
| 3 | The portion of rental expense that is representative of the interest factor in these rentals. | ||||||||||||||||||||||||||||||||||||
|
|
| ||||||||||||||||||||||||||||||||||||
| 4 | Earnings for the fiscal year ended January 29, 2016 included a $530 million non-cash impairment charge related to the investment in the Australia joint venture with Woolworths Limited. Excluding this charge from the calculation would result in a ratio of earnings to fixed charges of 7.9 for the fiscal year ended January 29, 2016. | ||||||||||||||||||||||||||||||||||||
Exhibit 21.1
LOWE’S COMPANIES, INC. AND SUBSIDIARY COMPANIES
|
| ||
|
|
|
|
| NAME AND DOING BUSINESS AS: |
| STATE OF INCORPORATION |
|
|
|
|
| Lowe’s Home Centers, LLC |
| North Carolina |
| GBI Delaware, LLC |
| Delaware |
|
|
|
|
| All other subsidiaries were omitted pursuant to Item 601(21)(ii) of Regulation S-K under the Securities and Exchange Act of 1934, as amended. | ||
Exhibit 23.1
CONSENT OF INDEPENDENT REGISTERED PUBLIC ACCOUNTING FIRM
We consent to the incorporation by reference in:
|
| |
|
|
|
| Description | Registration Statement Number |
|
|
|
| Form S-3 ASR |
|
| Lowe’s Stock Advantage Direct Stock Purchase Plan | 333-200115 |
| Debt Securities, Preferred Stock, Common Stock | 333-206537 |
|
|
|
| Form S-8 |
|
| Lowe’s 401(k) Plan | 33-29772 |
| Lowe’s Companies, Inc. 1994 Incentive Plan | 33-54499 |
| Lowe’s Companies, Inc. 1997 Incentive Plan | 333-34631 |
| Lowe’s Companies, Inc. Directors’ Stock Option Plan | 333-89471 |
| Lowe’s Companies Benefit Restoration Plan | 333-97811 |
| Lowe’s Companies Cash Deferral Plan | 333-114435 |
| Lowe’s Companies, Inc. 2006 Long-Term Incentive Plan | 333-138031; 333-196513 |
| Lowe’s Companies Employee Stock Purchase Plan - Stock Options for Everyone | 333-143266; 333-181950 |
|
|
|
of our reports dated April 3, 2017, relating to the consolidated financial statements and financial statement schedule of Lowe’s Companies, Inc. and subsidiaries (“the Company”), and the effectiveness of the Company’s internal control over financial reporting, appearing in this Annual Report on Form 10-K of the Company for the fiscal year ended February 3, 2017.
/s/ DELOITTE & TOUCHE LLP
Charlotte, North Carolina
April 3, 2017
Exhibit 31.1
CERTIFICATION
I, Robert A. Niblock, certify that:
(1) I have reviewed this Annual Report on Form 10-K for the fiscal year ended February 3, 2017 of Lowe’s Companies, Inc. (the Registrant);
(2) Based on my knowledge, this report does not contain any untrue statement of a material fact or omit to state a material fact necessary to make the statements made, in light of the circumstances under which such statements were made, not misleading with respect to the period covered by this report;
(3) Based on my knowledge, the financial statements, and other financial information included in this report, fairly present in all material respects the financial condition, results of operations and cash flows of the Registrant as of, and for, the periods presented in this report;
(4) The Registrant’s other certifying officer and I are responsible for establishing and maintaining disclosure controls and procedures (as defined in Exchange Act Rules 13a-15(e) and 15d-15(e)) and internal control over financial reporting (as defined in Exchange Act Rules 13a-15(f) and 15d-15(f)) for the Registrant and have:
|
|
|
| (a) | Designed such disclosure controls and procedures, or caused such disclosure controls and procedures to be designed under our supervision, to ensure that material information relating to the Registrant, including its consolidated subsidiaries, is made known to us by others within those entities, particularly during the period in which this report is being prepared; |
|
|
|
| (b) | Designed such internal control over financial reporting, or caused such internal control over financial reporting to be designed under our supervision, to provide reasonable assurance regarding the reliability of financial reporting and the preparation of financial statements for external purposes in accordance with generally accepted accounting principles; |
|
|
|
| (c) | Evaluated the effectiveness of the Registrant’s disclosure controls and procedures and presented in this report our conclusions about the effectiveness of the disclosure controls and procedures, as of the end of the period covered by this report based on such evaluation; and |
|
|
|
| (d) | Disclosed in this report any change in the Registrant’s internal control over financial reporting that occurred during the Registrant’s most recent fiscal quarter (the Registrant’s fourth fiscal quarter in the case of an annual report) that has materially affected, or is reasonably likely to materially affect, the Registrant’s internal control over financial reporting; and |
(5) The Registrant’s other certifying officer and I have disclosed, based on our most recent evaluation of internal control over financial reporting, to the Registrant’s auditors and the audit committee of the Registrant’s board of directors (or persons performing the equivalent functions):
|
|
|
| (a) | All significant deficiencies and material weaknesses in the design or operation of internal control over financial reporting which are reasonably likely to adversely affect the Registrant’s ability to record, process, summarize and report financial information; and |
|
|
|
| (b) | Any fraud, whether or not material, that involves management or other employees who have a significant role in the Registrant’s internal control over financial reporting. |
|
| ||
|
|
|
|
| April 3, 2017 |
| /s/ Robert A. Niblock |
| Date |
| Robert A. Niblock Chairman of the Board, President and Chief Executive Officer |
Exhibit 31.2
CERTIFICATION
I, Marshall A. Croom, certify that:
(1) I have reviewed this Annual Report on Form 10-K for the fiscal year ended February 3, 2017 of Lowe’s Companies, Inc. (the Registrant);
(2) Based on my knowledge, this report does not contain any untrue statement of a material fact or omit to state a material fact necessary to make the statements made, in light of the circumstances under which such statements were made, not misleading with respect to the period covered by this report;
(3) Based on my knowledge, the financial statements, and other financial information included in this report, fairly present in all material respects the financial condition, results of operations and cash flows of the Registrant as of, and for, the periods presented in this report;
(4) The Registrant’s other certifying officer and I are responsible for establishing and maintaining disclosure controls and procedures (as defined in Exchange Act Rules 13a-15(e) and 15d-15(e)) and internal control over financial reporting (as defined in Exchange Act Rules 13a-15(f) and 15d-15(f)) for the Registrant and have:
|
|
|
| (a) | Designed such disclosure controls and procedures, or caused such disclosure controls and procedures to be designed under our supervision, to ensure that material information relating to the Registrant, including its consolidated subsidiaries, is made known to us by others within those entities, particularly during the period in which this report is being prepared; |
|
|
|
| (b) | Designed such internal control over financial reporting, or caused such internal control over financial reporting to be designed under our supervision, to provide reasonable assurance regarding the reliability of financial reporting and the preparation of financial statements for external purposes in accordance with generally accepted accounting principles; |
|
|
|
| (c) | Evaluated the effectiveness of the Registrant’s disclosure controls and procedures and presented in this report our conclusions about the effectiveness of the disclosure controls and procedures, as of the end of the period covered by this report based on such evaluation; and |
|
|
|
| (d) | Disclosed in this report any change in the Registrant’s internal control over financial reporting that occurred during the Registrant’s most recent fiscal quarter (the Registrant’s fourth fiscal quarter in the case of an annual report) that has materially affected, or is reasonably likely to materially affect, the Registrant’s internal control over financial reporting; and |
(5) The Registrant’s other certifying officer and I have disclosed, based on our most recent evaluation of internal control over financial reporting, to the Registrant’s auditors and the audit committee of the Registrant’s board of directors (or persons performing the equivalent functions):
|
|
|
| (a) | All significant deficiencies and material weaknesses in the design or operation of internal control over financial reporting which are reasonably likely to adversely affect the Registrant’s ability to record, process, summarize and report financial information; and |
|
|
|
| (b) | Any fraud, whether or not material, that involves management or other employees who have a significant role in the Registrant’s internal control over financial reporting. |
|
| ||
|
|
|
|
| April 3, 2017 |
| /s/ Marshall A. Croom |
| Date |
| Marshall A. Croom Chief Financial Officer |
Exhibit 32.1
Certification Pursuant to 18 U.S.C. Section 1350,
as Adopted Pursuant to Section 906 of the Sarbanes-Oxley Act of 2002
In connection with the Annual Report on Form 10-K of Lowe’s Companies, Inc. (the Company) for the fiscal year ended February 3, 2017 as filed with the Securities and Exchange Commission on the date hereof (the Report), I, Robert A. Niblock, certify, pursuant to 18 U.S.C. Section 1350, as adopted pursuant to Section 906 of the Sarbanes-Oxley Act of 2002, that:
|
|
| |
| 1. | The Report fully complies with the requirements of Section 13(a) or 15(d) of the Securities Exchange Act of 1934; and | |
|
|
| |
| 2. | The information contained in the Report fairly presents, in all material respects, the financial condition and results of operations of the Company. | |
/s/ Robert A. Niblock
Robert A. Niblock
Chairman of the Board, President and Chief Executive Officer
April 3, 2017
Exhibit 32.2
Certification Pursuant to 18 U.S.C. Section 1350,
as Adopted Pursuant to Section 906 of the Sarbanes-Oxley Act of 2002
In connection with the Annual Report on Form 10-K of Lowe’s Companies, Inc. (the Company) for the fiscal year ended February 3, 2017 as filed with the Securities and Exchange Commission on the date hereof (the Report), I, Marshall A. Croom, certify, pursuant to 18 U.S.C. Section 1350, as adopted pursuant to Section 906 of the Sarbanes-Oxley Act of 2002, that:
|
|
| |
| 1. | The Report fully complies with the requirements of Section 13(a) or 15(d) of the Securities Exchange Act of 1934; and | |
|
|
| |
| 2. | The information contained in the Report fairly presents, in all material respects, the financial condition and results of operations of the Company. | |
/s/ Marshall A. Croom
Marshall A. Croom
Chief Financial Officer
April 3, 2017
Exhibit 99.1
AAMENDMENT NUMBER FIVE TO THE
LOWE’S 401(K) PLAN
This Amendment Number Five to the Lowe’s 401(k) Plan, as amended and restated effective as of January 1, 2013 (the “ Plan ”), is adopted by Lowe’s Companies, Inc. (the “Company”).
W I T N E S S E T H:
WHEREAS, the Company currently maintains the Plan; and
WHEREAS, the Company desires to amend the Plan to update and clarify the Plan’s in-service withdrawal provisions;
NOW, THEREFORE, the Company hereby amends the Plan effective as of June 1, 2016, as follows:
1. The first sentence of Section 10(b) of the Plan shall be replaced with the following:
“An Employee who is a Participant may request a one-time withdrawal of his entire Capital Accumulation after he attains age 59½ or after he incurs a disability. For purposes of this Section 10(b), ‘disability’ shall mean a disability for which the Employee has been determined by the Social Security Administration to be entitled to Social Security disability income benefits.”
2. The Plan, as amended herein, shall continue in full force and effect in all other respects.
IN WITNESS HEREOF, the Company has caused this instrument to be executed by its duly authorized officer this 7th day of June , 2016.
|
| ||
|
|
|
|
|
| LOWE’S COMPANIES, INC. | |
|
|
|
|
|
| By: | /s/ Jennifer L. Weber |
|
|
| Jennifer L. Weber Chief Human Resources Officer |
Exhibit 99.2
AMENDMENT NUMBER SIX TO THE
LOWE’S 401(k) PLAN
This Amendment Number Six to the Lowe’s 401(k) Plan, as amended and restated effective as of January 1, 2013 (the “ Plan ”), is adopted by Lowe’s Companies, Inc. (the “Company”).
W I T N E S S E T H:
WHEREAS, the Company currently maintains the Plan; and
WHEREAS, the Company desires to amend the Plan to update and clarify the Plan’s in-service withdrawal provisions;
NOW, THEREFORE, the Company hereby amends the Plan effective as of January 1, 2016, as follows:
1. Section 9(c) of the Plan is amended in its entirety to read as follows:
“The distribution of the Capital Accumulation of any Participant who attains age 70½ in a calendar year and either (1) has terminated Service or (2) is a ‘5% owner’ of Lowe’s Stock (as defined in Section 416(i)(l)(B)(i) of the Code) must occur not later than April 1st of the next calendar year and must be made in accordance with the regulations under Section 401(a)(9) of the Code, including Section 1.401(a)(9)-2.”
2. The Plan, as amended herein, shall continue in full force and effect in all other respects.
IN WITNESS HEREOF, the Company has caused this instrument to be executed by its duly authorized officer this 16th day of December , 2016
|
| ||
|
|
|
|
|
| LOWE’S COMPANIES, INC. | |
|
|
|
|
|
| By: | /s/ Matthew B. Eurey |
|
|
| Matthew B. Eurey Vice President – Total Rewards |


