review the results, interpretations from your data analysis, and draw conclusions from the results of your research study. In addition, as you have concluded writing the results or findings of y
80
CHAPTER FOUR: RESULTS
The purpose of this research was to study employee perspectives of the leadership style of managers within nonprofit institutions. Specifically, this study aimed to understand the impact of leadership style on employees in human services organizations located in the northeastern United States. The study was a two-group design. Two groups of employees were compared on the quality of leadership between their managers, differentiated by managers who hold human services degrees and managers who do not hold human services degrees. Quality of leadership was measured as three specific leadership behaviors (aims or goals emphasis; personal backing; and work easing or facilitation). The intent was to identify management factors that could improve the functioning of a human services organization.
This results chapter is divided into six sections. The first section lists the research questions. The second section briefly describes data screening, reliability, summated scales, and statistical tests used to analyze the data. The third section presents the participants’ demographic characteristics. The fourth section presents descriptive statistics for summated scales and managerial effectiveness along with correlations for identifying the analytical approach to address the research questions. The fifth section presents results for Research Questions 1, 2, and 3. The sixth and final section is the summary.
Research Questions
This study was guided by three research questions. They correspond to the three leadership behaviors of interest (aims or goals emphasis; personal backing; and work easing or facilitation). Associated hypotheses are listed in sections that present the results for the research questions.
Research Question 1 (RQ1)
Is there a difference in aims or goals emphasis, as a leadership behavior, between non-profit human services managers with and without human services degrees?
Research Question 2 (RQ2)
Is there a difference in personal backing, as a leadership behavior, between non-profit human services managers with and without human services degrees?
Research Question 3 (RQ3)
Is there a difference in work easing or facilitation, as a leadership behavior, between non-profit human services managers with and without human services degrees?
Data Screening, Reliability, Summated Scales, and Statistical Tests
This section briefly describes data screening, testing the reliability or internal consistency of the data, generating summated scales, and statistical tests used to analyze the data. Statistical tests were chi-squares, correlations, and multivariate analysis of covariance (MANCOVA).
Data Screening
All data were initially screened for entry errors and missing data points. The data were collected on the online survey site SurveyMonkey.com, so there were not any entry errors. There was a small number of missing data points, but these did not show any systematic pattern, although the number of participants in various analyses (n’s) tended to vary slightly. Likert-scaled responses were screened for normality, linearity, homoscedasticity, and outliers to determine if they could be treated as continuous data (Hair, Black, Babin, Anderson, & Tatham, 2010). Following Warner (2013), the decision was made ahead of time to retain outliers because they reflect the working reality of human services organizations and the goal of this research was to understand the reality of human services organizations better. Low scores emerged as low outliers in all three leadership behaviors of interest (aims or goals emphasis; personal backing; and work easing or facilitation; described below) but the data did not otherwise show any substantial departures from statistical normality. Likert-scaled data were therefore treated as continuous data and examined with parametric inferential statistical tests to examine group differences.
Percentages were rounded off to whole numbers and may not add up to precisely 100%. Data were analyzed with SPSS v 25, which is dedicated statistical software. Statistical significance was set at alpha = .050.
Reliability
Reliability statistics (i.e., internal consistency) were run on conceptually-similar survey items with Cronbach’s alpha for the three leadership behaviors of interest (aims or goals emphasis; personal backing; and work easing or facilitation). Cronbach’s alpha statistics range in value from 0 to 1. The closer Cronbach’s alpha is to 1, the greater the reliability of the database. Indices of .70 or higher reflect an adequately reliable database (Gliner & Morgan, 2000).
Summated Scale Scores
A summated scale was generated for each of the three leadership behaviors of interest (aims or goals emphasis; personal backing; and work easing or facilitation). A summated scale is a single empirical measure that represents multiple aspects of a construct in one variable (Hair et al., 2010). Deriving a single measure from several related aspects decreases the measurement error in the original data points, which increases data reliability and validity as well as parsimony in the overall number of variables (Hair et al., 2010). Because each summated score was a mean, its possible values ranged 1 – 7 (1 = strongly disagree, 7 = strongly agree) like the Likert scale used to measure responses to survey items.
Aims emphasis. Two survey items measured the leadership dimension of “aims emphasis.” An example of a survey item that measured aims emphasis is: “My manager makes sure subordinates have clear goals to achieve.” Internal consistency was high, Cronbach’s alpha = .74. Because of high internal consistency, a summated scale (SS) was generated, using the mean response of the related items. It is hereafter called the Aims Emphasis SS.
Personal backing. Three survey items measured the leadership dimension of “personal backing.” An example of a survey item that measured personal backing is: “My manager is concerned about his/her subordinates as people.” Cronbach’s alpha showed that internal consistency was high, alpha = .84. Because of high internal consistency, a summated scale (SS) was generated, using the mean response of the related items. It is hereafter called the Personal Backing SS.
Work easing. Four items measured the leadership dimension of “work easing.” An example of a survey item that measured work easing is: “My manager helps his/her subordinates solve work-related problems.” Cronbach’s alpha showed that internal consistency was high, alpha = .94. Because of high internal consistency, a summated scale (SS) was generated, using the mean response of the related items. It is hereafter called the Work Easing SS.
Chi-square Test of Independence
A chi-square test of independence was used to examine demographic variables pertaining to managers’ backgrounds in human services. Chi-square tests set up categorical data in cross-tabulated tables. Data are analyzed by comparing the actual number of participants in the database that fall into a specific category (observed frequencies or counts) to the number of participants that would be expected by chance (expected frequencies or counts, Siegel & Castellan, 1988). The Yates correction was applied because the data formed a 2 x 2 table, and the correction reduces the observed-expected difference by half a point so that it fits chi-square distributions more accurately. The overall chi-square statistic indicates whether the observed counts differ significantly or non-significantly from counts expected by chance. For significant chi-square statistics, individual pairs of observed and expected frequencies are then inspected for statistical significance by transforming observed/expected differences into z scores called adjusted residuals. Statistically significant relationships are revealed by adjusted residuals that are ±1.96 (Siegel & Castellan, 1988).
Pearson’s Correlations
Correlations were used to examine the data for covariates. Correlations were Pearson product-moment correlations. They were interpreted categorically following Cohen (1988, p. 79-81): small effect r = .10; medium effect r = .30; large effect r = .50. These are zero-order correlations in which the effects of other associated variables are not taken into account. It is generally recommended that sample sizes be at least N = 100 when correlations are used, partly to have adequate statistical power and partly to minimize the effect of extreme outliers (Warner, 2013). The data set in the current study met Warner’s criterion.
MANCOVA Test
Research questions 1-3 were addressed with a version of the MANOVA test called a MANCOVA. MANOVA is an acronym for multivariate analysis of variance. Like all ANOVA tests, this test is designed to test the statistical significance of group differences (Hair et al., 2010). However, unlike ANOVA tests, MANOVA tests are multivariate tests that examine two or more related dependent variables simultaneously. In the current study, the related dependent variables there were examined simultaneously were the three leadership behaviors of interest (aims or goals emphasis; personal backing; and work easing or facilitation). In contrast, ANOVA tests are univariate tests because each only examines one dependent variable at a time.
MANOVA is preferred over several separate ANOVAs for several reasons (Hair et al., 2010; Warner, 2013). Complex phenomena, such as leadership style in human services organizations in the current study, are more accurate when measured in multiple ways because it can be very challenging to obtain accurate measures of a complex phenomenon from a single measure of it. MANOVA results can be more informative than a series of univariate ANOVA tests because MANOVA takes intercorrelations among the dependent variables into account by treating them in combination. The MANOVA calculations create a new dependent variable that is the linear combination of the original dependent variables which maximizes group differences; it is called the multivariate dependent variable. The advantage is that a multivariate dependent variable may reveal differences that individual ANOVA tests cannot show. For example, the MANOVA may establish that related dependent variables each represent a conceptually distinct and independent outcome or intercorrelations suggest they represent multiple measures of one conceptually distinct outcome. Finally, group differences may only emerge when the outcome of two or more dependent variables is considered jointly.
MANOVA yields more output than ANOVA because it is more complex and has up to three steps. In Step 1, the overall multivariate hypothesis is tested. The most commonly used test statistic to evaluate the significance of this hypothesis is Wilks Lambda (λ), a measure of the within-groups variance divided by the total variance. Lambda ranges in value from 0 to 1 so the smaller the value of Lambda, the greater the evidence of group differences. If the multivariate null hypothesis is retained, the convention is to stop the analysis at this point and conclude that the intervention (in the current study, whether or not a manager held a human services degree) had no effect (in the current study, on different dimensions of leadership). Effect sizes are measured with partial eta squared (partial η2), which is the amount of variance in the dependent variable that is explained by the corresponding independent variable (i.e., group membership, Warner, 2013).
When the overall multivariate test is statistically significant, Step 2 is to undertake a series of univariate ANOVAs to identify the dependent variable(s) affected by the intervention. A Bonferroni-like adjustment is applied to maintain the risk of a Type I error at the original alpha level.
In Step 3, any univariate test of a dependent variable that results in statistical significance is followed by planned comparisons to identify specific differences with Tukey’s tests, when there are more than two levels of the independent variable.
In the current study, research questions 1-3 were addressed with a multivariate analysis of covariance or MANCOVA. MANCOVAs are MANOVAs with the addition of covariates. Covariates are variables that correlate with the dependent variable. The question is whether the covariate influences the dependent variable such that it misleads researchers about differences in the dependent variable from main or interaction affects. MANCOVA first determines if there is a significant covariate effect. If so, it removes the influence of the covariate statistically and then compares the remaining variance in the dependent variable to reveal statistically significant independent variables. In the current study, an overall measure of manager effectiveness was the covariate.
Demographic Characteristics
This section presents demographic variables and characterizes the modal participant. A total of 113 individuals completed surveys. Of those, 10 participants (cases 4, 14, 20, 21, 33, 45, 62, 78, 101, 105) failed to provide information on their managerial educational background, leadership style, or both. They were eliminated from further analyses, N = 103 participants. The demographic results in this section show that the modal participant was a married Caucasian woman in her 40s who had worked for her current organization for ten years and for her current manager for five years.
There were three times as many participants whose managers did not hold human service degrees, n = 75 participants, 73%, as participants who managers held human services degrees, n = 28 participants, 28%. The 3-to-1 ratio of non-degree-holders to degree-holders is illustrated on Figure 1. [Sharon, comment in chapter 5 about this 3-1 ratio: is this correct in general for human services organizations such as the ones you sampled? Is there any industry trend toward changing this by requiring managers to have the pertinent degrees?]
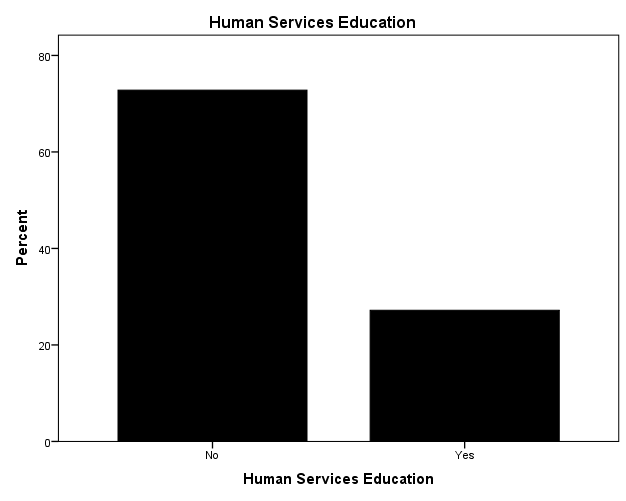
Figure 1. Numbers of participants by human services degrees.
There was a gender ratio of 4-to-1 women to men; women 80%, n = 82 female participants, men 20%, n = 21 male participants. Four of the 103 participants did not provide ethnic information. Of the 99 participants who provided ethnic information, illustrated on Figure 2, the majority of the participants were Caucasian, 77%, n = 76 participants. The next largest group was African American, 12%, n = 12 participants. The remaining ethnicities were each represented by four or fewer participants.
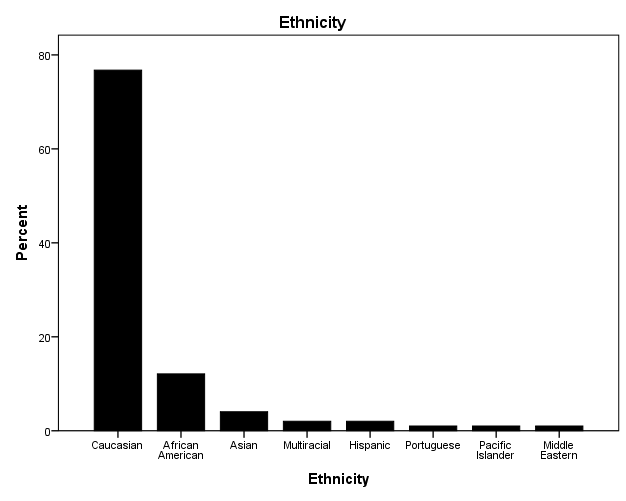
Figure 2. Numbers of participants by ethnicity.
Figure 3 illustrates the participants by marital status. Half were married, 50%, n = 51 participants. Approximately half were single, 41%, n = 42. Ten participants labeled their marital status as something other than married or single, 10%.
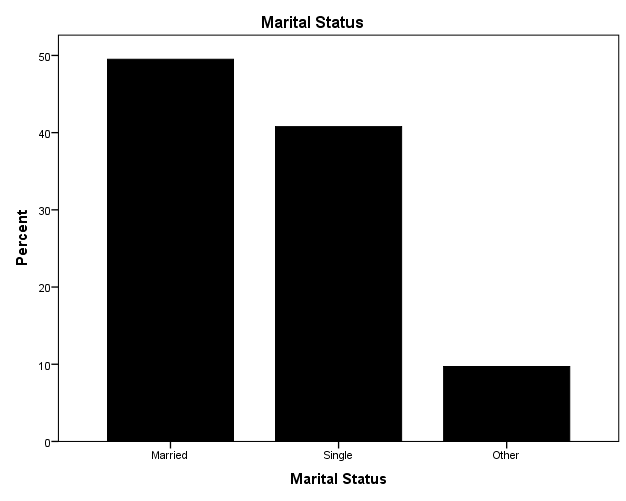
Figure 3. Numbers of participants by marital status.
Participants were in their early 40’s on average, M = 43.38 years old, SD = 13.13, but represented a broad range of ages, min = 21 years, max = 70 years. They had been working for their current organization nearly ten years on average, M = 9.84 years, SD = 8.02, though again represented a broad range of time on the current job, min = 1 year, max = 31 years. They had worked for their current manager about half as long as they had been employed by the organization, M = 4.87 years, SD = 5.48. They again, however, reported a broad range, min = 1 year, max = 30 years.
Each participant was a member of one of two groups: those whose managers held a human services degree and those whose managers did not hold a human services degree. Participants were also asked on the survey whether or not their manager’s professional background included human services experience, regardless of formal education.
Figure 4 shows the cross-tabulation of human services degrees (formal education) and professional background (direct experience) among managers. In total, 28 managers held human services degrees. All 28 of them had a professional background in human services as well. The other 74 managers did not hold a human services degree. In a 2-to-1 ratio, twice as many non-degree-holding managers had professional backgrounds in human services as did not have professional backgrounds in human services.
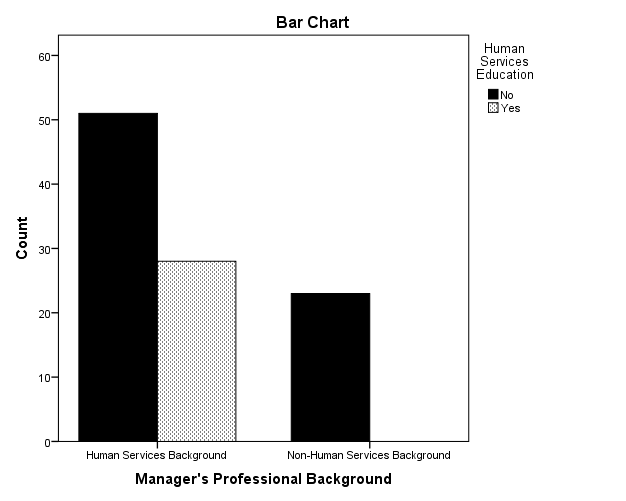
Figure 4. Cross-tabulation between human services degree held (yes or no) and manager’s professional background in human services (yes or no).
A chi-square test was run to determine whether the association between holding a human services degree and having a professional human services background was statistically significant. The hypotheses were:
H0: The association between human services degrees and professional background in human services was not statistically significant.
H1: The association between human services degrees and professional background in human services was statistically significant.
Results of the chi-square indicated that the association between human services degrees and professional background in human services was statistically significant, X2 (1, 102) = 9.53, p = .002, Φ = .33, p = .001. The null hypothesis was rejected. Adjusted residuals, listed on Table 1, showed that there were significantly fewer degree holders without human services backgrounds than expected but also significantly more non-degree-holders without human services backgrounds than expected. [Sharon, maybe one of the observations you have made professionally, which led to your study, is that a quarter of your participants work for managers who have neither formal education nor professional experience in human services! That combination of inexperience would make it difficult for someone to perform well at work!]
Table 1
Manager's Professional Background by Human Services Education Crosstabulation
| Manager's Professional Background | Human Services Education | Total | |||
| No | Yes | ||||
| Human Services Background | Observed Count | 51 | 28 | 79 | |
| Expected Count | 57.3 | 21.7 | 79.0 | ||
| % within Human Services Education | 69% | 100% | 77% | ||
| Adjusted Residual | -3.4 | 3.4 | |||
| Non-Human Services Background | Count | 23 | 0 | 23 | |
| Expected Count | 16.7 | 6.3 | 23.0 | ||
| % within Human Services Education | 31% | 0% | 23% | ||
| Adjusted Residual | 3.4 | -3.4 | |||
| Total | Count | 74 | 28 | 102 | |
| Expected Count | 74.0 | 28.0 | 102.0 | ||
| % within Human Services Education | 100% | 100% | 100% | ||
Descriptive Statistics for Summated Scales and Managerial Effectiveness
Recall that the Likert scale of agreement used to measure the three leadership behaviors of interest (aims or goals emphasis; personal backing; and work easing or facilitation) had a 7-point scale (1 = strongly disagree, 7 = strongly agree). Also recall that summated scale scores were the means of each participant’s responses to conceptually-related items. Table 2 shows the descriptive statistics for the three summated scales and a measure of manager effectiveness.
Means for all three summated scales fell between 5 and 6 in value. Scores between 5 and 6 reflect responses between “somewhat agree” to “agree.” The minimum score for all three summated scales was one, indicating that at least participant strongly disagreed with all of the survey items used to measure a particular summated scale. Alternatively, the maximum score for all three summated scales was 7, indicating that at least one participant strongly agreed with all of the survey items used to measure a particular summated scale.
The fourth measure whose descriptive statistics are listed on Table 2 summarizes overall managerial effectiveness. These data emerged from responses to the survey question, “How effective is your manager? Pleases choose one number between 1 and 10, with 1 = not at all effective, 10 = maximally effective.” On average, participants rated managerial effectiveness between 7 and 8, indicating that average perceptions were that managerial effectiveness fell between moderate and maximal.
Table 2
Descriptive Statistics for Summated Scales and Managerial Effectiveness
| Aims Emphasis SS | Personal Backing SS | Work Easing SS | Managerial Effectiveness | ||
| Cronbach’s alpha | .74 | .84 | .94 | - | |
| Mean | 5.59 | 5.31 | 5.46 | 7.64 | |
| 95% CI | LB | 5.34 | 5.03 | 5.17 | 7.17 |
| UB | 5.83 | 5.59 | 5.75 | 8.11 | |
| 5% Trimmed M | 5.69 | 5.42 | 5.60 | 7.85 | |
| Median | 6.00 | 5.66 | 6.0 | 8.00 | |
| Variance | 1.46 | 1.9 | 2.09 | 5.63 | |
| Std. Deviation | 1.21 | 1.40 | 1.44 | 2.37 | |
| Minimum | 1.00 | 1.00 | 1.00 | 1 | |
| Maximum | 7.00 | 7.00 | 7.00 | 10 | |
| Range | 6.00 | 6.00 | 6.00 | 9 | |
| IQR | 1.50 | 1.33 | 1.50 | 4 | |
| Skewness | -1.42 | -1.28 | -1.45 | -1.05 | |
| Kurtosis | 2.79 | 1.24 | 1.73 | 0.54 | |
Note. 95% CI = 95% confidence interval of the mean. LB = lower bound of the 95% CI. UB = upper bound of the 95% CI. IQR = Interquartile range.
Correlations
This section shows the results of inspecting correlations to look for covariates and sufficient correlations among dependent variables to establish the analytical approach to answering RQs 1-3. The analytical plan was based on correlations: analyze RQs 1-3 with separate independent t tests in the absence of covariates; analyze RQs 1-3 with 1x2 ANCOVA tests in the presence of covariates; analyze RQs 1-3 with a MANOVA test if the dependent variables (leadership behaviors: aims or goals emphasis; personal backing; and work easing or facilitation) were sufficiently correlated; or analyze RQs 1-3 with a MANCOVA test the dependent variables were sufficiently correlated and there were covariates.
The patterns of the correlations among participants whose managers did and did not hold a human services degree are shown on Table 3. Correlations above the diagonal reflect managers without human services degrees, n = 73-75 participants. Correlations below the diagonal reflect managers with human services degrees, n = 27-28 participants.
The patterns across the two groups were identical. Four patterns emerged. One, all three summated scales (V1, V2, and V3) were strongly and positively correlated to each other. This justified a MANOVA test. Two, all three summated scales (V1, V2, and V3) were also strongly and positively correlated with the numeric estimate of the manager’s overall effectiveness (V4). This justified a MANCOVA test. Three, there were strong and positive correlations between the years spent working for the current manager, years spent working for the current human services organization, and the participant’s age (V5, V6, and V7) . Four, these three demographic variables (V5, V6, and V7) did not correlate significantly with the summated scales (V1, V2, and V3) or managerial effectiveness (V4). These demographic variables were therefore not used as covariates [Sharon, ergo, the demographic variables are NOT covariates. But managerial effectiveness is a covariate.]
Table 3
Pearson Correlation Matrix of Leadership Styles and Demographic Variables
| V1 | V2 | V3 | V4 | V5 | V6 | V7 | |
| V1 Personal Backing SS | | .82** | .84** | .71** | .13 | -.06 | -.06 |
| V2 Aims Emphasis SS | .71** | | .86** | .75** | .14 | -.02 | -.07 |
| V3 Work Easing SS | .84** | .92** | | .81** | .19 | -.05 | -.02 |
| V4 Managerial Effectiveness | .71** | .69** | .77** | | .08 | .02 | .01 |
| V5 Years w Current Manager | .21 | .19 | .16 | .15 | | .59** | .45** |
| V6 Year w Current Organization | -.20 | -.18 | -.23 | -.20 | .66** | | .48** |
| V7 Age | -.03 | -.09 | -.04 | .04 | .35 | .43* | |
Note. V = variable. Above diagonal: managers without human services degrees, n = 73-75 participants. Below diagonal: managers with human services degrees, n = 27-28 participants. *Correlation is significant at the 0.05 level (2-tailed). **Correlation is significant at the 0.01 level (2-tailed).
Results for Research Questions 1-3
Correlations listed on Table 3 justified a MANCOVA test that addressed all three research questions at once in a single analysis. This section presents those results. RQ1 was, Is there a difference in aims or goals emphasis, as a leadership behavior, between non-profit human services managers with and without human services degrees? RQ2 was, Is there a difference in personal backing, as a leadership behavior, between non-profit human services managers with and without human services degrees? RQ3 was, Is there a difference in work easing or facilitation, as a leadership behavior, between non-profit human services managers with and without human services degrees?
In the MANCOVA, the covariate was the managerial effectiveness. The independent variable was human services degree, with two levels (yes, manager held a human services degree; no, manager did not hold a human services degree). The multivariate dependent variable was the linear combination of the three leadership behaviors of interest (aims or goals emphasis; personal backing; and work easing or facilitation). MANCOVA first tests a set of multivariate hypotheses. The multivariate hypotheses were:
Covariate H0: Managerial effectiveness was not a significant covariate.
Covariate H1: Managerial effectiveness was a significant covariate.
Multivariate H0: The difference in the linear combination of the three leadership behaviors of interest between managers with and without human services degrees was not statistically significant.
Multivariate H1: The difference in the linear combination of the three leadership behaviors of interest between managers with and without human services degrees was statistically significant.
The data met the assumption of equality of covariance matrices, Box’s M = 16.44, F(6, 16609) = 2.62, p = .021. The data also met the assumption of equality of error variances, Aims Emphasis SS Levene’s F(1, 99) = 0.52, p = .474; Personal Backing SS Levene’s F(1, 99) = 0.12, p = .735; Work Easing SS Levene’s F(1, 99) = 0.95, p = .331.
Results of the multivariate portion of the MANCOVA showed that the managerial effectiveness was a significant covariate, Wilks Lambda = .35, F(3, 96) = 60.29, p < .001; the covariate null hypothesis was rejected. The impact of the overall managerial effectiveness was very strong, partial eta2 = .65.
When the impact of the overall managerial effectiveness was factored out, the difference in the linear combination of the three leadership behaviors of interest between managers with and without human services degrees was not statistically significant, Wilks Lambda = .99, F(3, 96) = 0.37, p = .775. The multivariate null hypothesis was retained.
[Sharon, I am very sorry! Your hypothesis was not supported! Holding a human services degree did not seem to increase the managers’ effectiveness! However, we gained valuable information. One was that managers’ overall effectiveness matched their effectiveness in the three individual dimensions of leadership: aims or goals emphasis; personal backing; and work easing or facilitation. Our MANCOVA results argued that the related dependent variables (aims emphasis; personal backing; and work easing) probably do not each represent a conceptually distinct and independent outcome, but actually represent multiple measures of one conceptually distinct outcome: effectiveness. You can comment in chapter 5 about whether this fits with literature on the dimensions measured by the MAO. From a practical standpoint, our results further indicate that we can simply ask for an effectiveness rating on a 1-10 scale. Another was that differences between managers with and without degrees disappear when we factor out overall effectiveness, BUT there were still differences between the means that show that managers with degrees are better at aims emphasis; personal backing; and work easing. These will be shown in the Cohen’s d statistics.
Propose future research in chapter 5 to discover what managers without human services degrees and/or professional backgrounds do to make up for their deficits.]
Figure 5 illustrates mean ratings for Aims Emphasis across the two groups. The average rating for the Aims Emphasis SS was slightly higher among managers who held human services degrees, M = 5.91, SD = 0.98, than it was among managers who did not hold human services degrees, M = 5.45, SD = 1.27. Although the difference in means was non-significant, as per the MANCOVA results, the impact of human services degrees on this dimension of leadership was very strong, partial eta2 = .45.
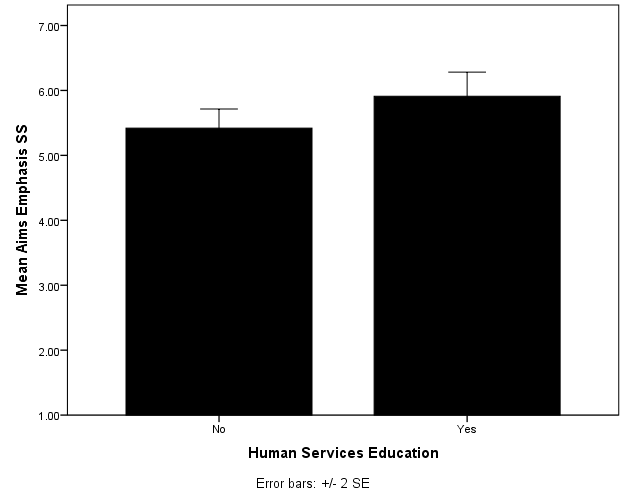
Figure 5. Mean Aims Emphasis SS across managers with and without a human services degree.
Figure 6 illustrates mean ratings for Personal Backing across the two groups. The average rating for the Personal Backing SS was slightly higher among managers who held human service degrees, M = 5.71, SD = 1.40, than it was among managers who did not hold human services degrees, M = 5.15, SD = 1.45. Although the difference in means was non-significant, as per the MANCOVA results, the impact of human services degrees on this dimension of leadership was very strong, partial eta2 = .50.
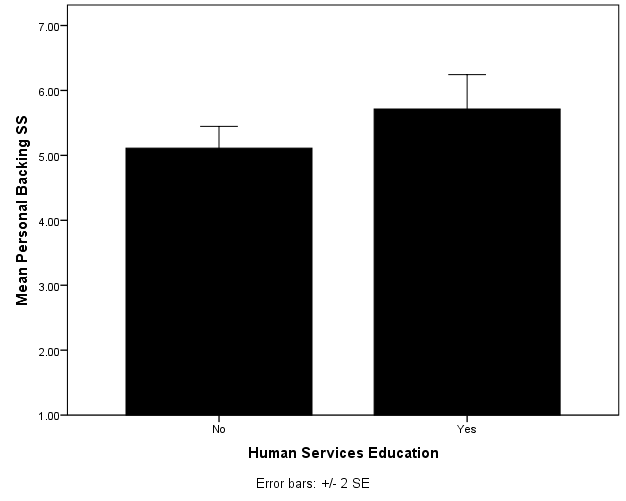
Figure 6. Mean Personal Backing SS across managers with and without a human services degree.
Figure 7 illustrates mean ratings for Work Easing across the two groups. The average rating for the Work Easing SS was slightly higher among managers who held human services degrees, M = 5.79, SD = 1.28, than it was among managers who did not hold human services degrees, M = 5.30, SD = 1.49. Although the difference in means was non-significant, as per the MANCOVA results, the impact of human services degrees on this dimension of leadership was very strong, partial eta2 = .42.
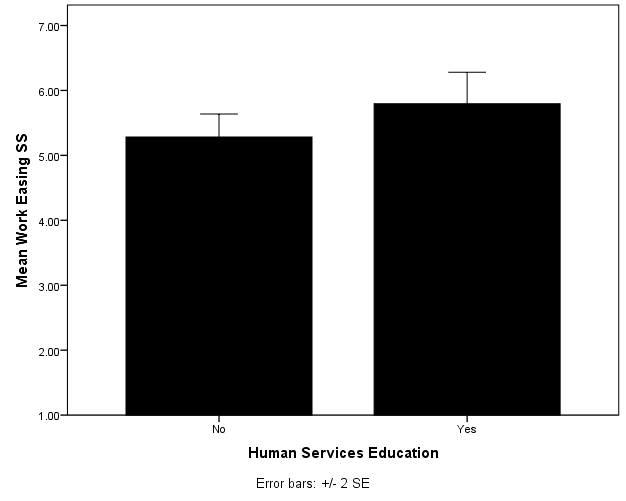
Figure 7. Mean Work Easing SS across managers with and without a human services degree.
Answer to Research Questions
The answer to RQ1 (Is there a difference in aims or goals emphasis, as a leadership behavior, between non-profit human services managers with and without human services degrees?) was no. The answer to RQ2 (Is there a difference in personal backing, as a leadership behavior, between non-profit human services managers with and without human services degrees?) was no. The answer to RQ3 (Is there a difference in work easing or facilitation, as a leadership behavior, between non-profit human services managers with and without human services degrees?) was no.
Summary
The modal participant was a married Caucasian woman in her 40s who had worked for her current organization for ten years and for her current manager for five years, N = 103 participants. Three times as many participants had managers who did not hold human services degrees, 73%, as did, 28%. A chi-square test revealed a significant association between holding a human services degree and having a professional human services background, with fewer degree holders but more non-degree-holders without human services backgrounds.
Means for three summated scales of aims emphasis, personal backing, and work easing fell 5-6 in value, reflecting “somewhat agree” to “agree” responses. Manager’s effectiveness (measured on a 1-10 scale where 10 = maximally effective) averaged 7-8, indicating that managerial effectiveness fell between moderate and maximal.
Patterns in correlations among participants whose managers did and did not hold a human services degree were identical. Four patterns emerged. 1) All three summated scales were strongly and positively correlated to each other. 2) All three summated scales were strongly and positively correlated with manager’s overall effectiveness. 3) Strong and positive correlations arose among demographic variables of years spent working for the current manager, years spent working for the current human services organization, and the participant’s age. 4) demographic variables did not correlate with summated scales or managerial effectiveness.
Correlational patterns justified a MANCOVA test that addressed all three research questions at once in a single analysis. RQ1 was, Is there a difference in aims or goals emphasis, as a leadership behavior, between non-profit human services managers with and without human services degrees? RQ2 was, Is there a difference in personal backing, as a leadership behavior, between non-profit human services managers with and without human services degrees? RQ3 was, Is there a difference in work easing or facilitation, as a leadership behavior, between non-profit human services managers with and without human services degrees? MANCOVA results showed that managerial effectiveness was a significant covariate. When its impact was factored out, the difference in multivariate leadership between managers with and without human services degrees was not significant. For all three leadership summated scales, participants whose managers held human services degrees had higher means that reflected non-significant but strong effects of degree holders on leadership.
Xxxxxxxxxxxxxxxxxxxxxxxxxxxxxxxxxxxxxxxxxxxx
Remove from this chapter and add to your References!
Gliner, J. A., & Morgan, G. A. (2000). Research methods in applied settings: An integrated approach to design and analysis. Erlbaum: Mahwah, NJ.
Hair Jr., J. F., Black, W. C., Babin, B. J., Anderson, R. E., & Tatham, R. L. (2010). Multivariate data analysis. Upper Saddle River, NJ: Prentice Hall. 785 pp.
Siegel, S., & Castellan, Jr., N. J. (1988). Nonparametric statistics for the behavioral sciences. 2nd ed. New York NY: McGraw-Hill.
Warner, R. M. (2013). Applied Statistics. 2nd ed. Los Angeles CA: Sage. 1101 pp.


