Activity 11 Develop a Gantt Chart, using Microsoft Project, for the WBS you created for the alternative solution you selected as best. A discussion of Gantt charts and an illustration of a Gantt c
Activity 11: See Session 7 Lecture Notes for details
http://www.iteconcorp.com/T11Gantt.html
(please submit to Assignment Folder only, no need to submit to Turnitin)
Screenshot of Microsoft Project Gantt Chart (an example)
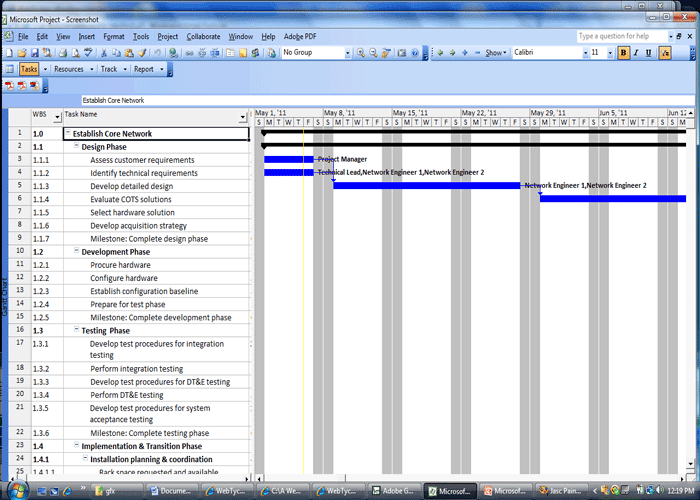
Template 11. Screenshot of Microsoft Project Gantt Chart
Activity 12: See Session 8 Lecture Notes for details
IT Economics Corporation.
| Required Outcomes (What must be demonstrated or accomplished as the end results of this contract?) | Performance Standards (What performance standards and acceptable quality levels/metrics will be used for the outcomes?) | Monitoring Methods (What monitoring methods will our organization use to determine that success has been achieved?) | Incentives and Disincentives (For Meeting or Not Meeting the Desired Outcomes and/or Performance Standards) |
| [Describe first required outcome.] | [Describe the performance standards and acceptable quality levels.] | [Describe the monitoring or surveillance method.] | [Describe the incentives and disincentives.] |
| [Describe second required outcome.} | [Describe the performance standards and acceptable quality levels.] | [Describe the monitoring or surveillance method.] | [Describe the incentives and disincentives.] |
| [Describe third required outcome.} | [Describe the performance standards and acceptable quality levels.] | [Describe the monitoring or surveillance method.] | [Describe the incentives and disincentives.] |
| [Describe fourth required outcome.} | [Describe the performance standards and acceptable quality levels.] | [Describe the monitoring or surveillance method.] | [Describe the incentives and disincentives.] |
| [And so on, as needed] | [And so on, as needed] | [And so on, as needed] | [And so on, as needed] |
| Template 12. Performance Work Statement (PWS) |


