I will pay 50.00 for the following essay, required reading attached. Unit VII Essay Use the projects you completed in Units III and VI to conduct a preliminary risk analysis. Use a qualitative and a q
Running head: UNIT VI PROJECT 0
Unit VI Project
Your Name
Columbia Southern University
Part 1
The Project Schedule
Activity Precedence Diagram (T.I. Liu, 1996)
| Earliest Start Time | Duration | Earliest Finish Time |
| 1 week | 2 months | 7 weeks | ||
| <Task Description> | Development of a Software for Online Store | |||||||
| Latest Start Time | Float | Latest Finish Time | 10 days | 0 weeks | 9 weeks | |||

Activity Duration Table
| Duration | ||||
| Activity | Optimistic | Likely | Pessimistic | Est. Duration |
| A | 2 | 2 | 4 | 2 |
| B | 3 | 6 | 6 | 1 |
| C | 5 | 5 | 7 | 2 |
| D | 4 | 4 | 7 | 2 |
| E | 2 | 6 | 8 | 1 |
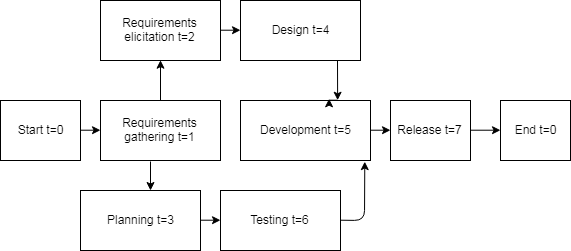
Network Diagram
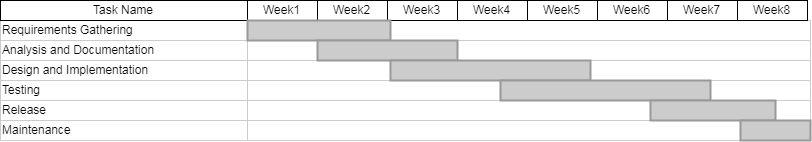
Gantt chart

Part 2
Please complete Case Study 10.1: Project Scheduling at Blanque Check Construction on page 360 of the textbook, and answer the three questions at the end.
Project Network (Blackburn, 2002).
| Steps | Activity | Activity Description |
| Step 1 | Vendor selection | The vendor are selected in this very first phase |
| Step 2 | Contract signing | Contracts with the selected vendors are made |
| Step 3 | Requirement gathering | Requirements gathering is done in this activity |
| Step 4 | Requirement analysis | Gathered requirements are analyzed |
| Step 5 | Planning scope | Scope of the project is planned |
| Step 6 | Planning budget | Budget available for the project is defined here |
| Step 7 | Planning time | Time required to complete the project is planned |
| Step 8 | Design | Design of the product is worked upon |
| Step 9 | Implementation | Design is implemented |
| Step 10 | Development | Development of the product starts |
| Step 11 | Prototype testing | Prototype of the product is made for testing |
| Step 12 | Engineering | Engineering related to the product is carried here as in this case it is civil engineering for the construction of properties |
| Step 13 | Subcontract signing | Subcontracts to different local contractors are made in order to divide the work load |
| Step 14 | Quality testing | The quality of the product is tested in this activity |
| Step 15 | Environmental Testing | The buildings made are tested in accordance with the suitability to natural environment |
| Step 16 | Addressing shortcomings | Discovered shortcomings are removed |
| Step 17 | Final Testing | Final testing of the product is carried in this activity prior to the release |
| Step 18 | Release | The tested product is delivered to the client |
| Step 19 | Maintenance | The maintenance work of the product is performed in accordance with the time constraints defined in the contract |
| Step 20 | Project termination | The project is closed officially |
Question No. 2
Expert Opinion for Calculation of Duration Estimation for the Project Activities
This approach can be used by contacting different estate experts that have the idea of that particular market in which the construction will take place. The opinion of such people can matter a lot in the project and such experts should also be made to give opinions that are well aware to the construction projects in that site.
Past History for Calculation of Duration Estimation for the Project Activities
The past history can also provide sufficient data regarding the duration estimates for the project activities as it can efficiently predict the duration of future activities on the basis of the pattern found in past projects (Saunders, 1990).
Mathematical Calculation for Calculation of Duration Estimation for the Project Activities
The mathematical calculations are also an effective tool for the duration estimates. The time limits can be utilized in the mathematical equations to predict the duration of various activities accurately.
Question No. 3
Joe should consider following issues before choosing between the methods of AON and AOA:
The feasibility of construction projects in that particular area
Analysis of available resources like time and money
Analysis of past projects
Estimating available workforce
Demands and needs of the client
Part 3
Network Activity Chart (Andronov, 2013)
The expected duration of the project is 7 weeks.
Part 4
Project Activity Network

Critical Path and other Paths through the Network (ARSHAM, 1999)
The critical path through the network is C–G–H that has the longest resulting value of 14.
The other paths like B-D-F and D-F-H can be identified as subcritical with the values of 12 for both.
References
Andronov, A., & Rebezova, M. (2013). Polynomial approximation of the activity completion time distribution in network chart. Automatic Control And Computer Sciences, 47(4), 192-201. doi: 10.3103/s0146411613040020
Arsham, H. (1999). Stability analysis of the critical path in project activity networks. Civil Engineering And Environmental Systems, 15(4), 305-334. doi: 10.1080/02630259908970245
Blackburn, S. (2002). The project manager and the project-network. International Journal Of Project Management, 20(3), 199-204. doi: 10.1016/s0263-7863(01)00069-2
G Saunders, R. (1990). Project management in R&D: the art of estimating development project activities. International Journal Of Project Management, 8(1), 45-50. doi: 10.1016/0263-7863(90)90008-y
Liu, T., & Yuan, G. (1996). PDES—An expert system for constructing the precedence diagram. Journal Of The Franklin Institute, 333(6), 975-990. doi: 10.1016/0016-0032(96)00037-3


