INTRODUCTION THE FUNCTION OF ENZYMES: DEVELOPING A TESTING A SCIENTIFIC HYPOTHESIS FOR INHERITED MUTATIONS IN THE ENZYME KINESIN Before...
| INTRODUCTION | The function of Enzymes: developing a testing a scientific hypothesis for inherited mutations in the enzyme “kinesin” |
| Before coming to Lab: 1. Read the entire lab entitled “The Function of Enzymes” 2. Read Essential Biology text, pg. 104-105 (How do We Know-Measuring enzyme performance) 3. Watch the Enzyme Kinetics tutorial (click here) viewing Parts 1-6 only. 4. Complete PreLab worksheet 5. Complete any experimental design needed. These sections will be highlighted in GREEN in the Lab Activities section. | OVERVIEW Enzymes are “active” proteins that catalyze the conversion of one biomolecule or protein into another. Two critical enzyme catalyzed reactions are illustrated below: Initiating glycolysis: Transport of proteins from ER to cell surface: There are 2 terms to become familiar with in this lab. These are “enzyme activity” and “rate of conversion of substrate to product.” In effect these both mean the same thing. The activity of an enzyme is directly related to the rate at which it catalyzes the conversion of a reactant (ie. glucose or ADP) to a product (ie. glucose-6-phosphate or ATP). One major reason scientists study enzymes is because their affinity for a protein is often related to the development of disease. For example, mutations in kinesin reduce the ability of the enzyme to hydrolyze ATP, which may prohibit transport of proteins in vesicles along neurons. Inhibited transport can lead to loss of motor function and neurological disease. As another example, the cancer drug Gleevec (Essential Cell pg. 721-724) is an inhibitor of the enzyme ABL, which binds proteins that activate cell proliferation and tumor growth.
Studying disease is, thus, often directly linked to studying enzyme affinity for a substrate. In order to learn and practice skills in enzyme affinity studies that will be applicable to careers in bioscience, ecological research, and/or healthcare, you will prepare reactions between an enzyme and a substrate and examine the conversion to product using both visual and analytical cues. You will learn how to use a very important research instrument called a spectrophometer and you will practice applying simple mathematical models to the raw data you generate. |
| LEARNING OBJECTIVES
| |


A) Before you start:
Read the entire lab exercise
Read pages 104-105 in Essential Biology text.
View the Enzyme Kinetics tutorial (click here) viewing Parts 1-6 only.
Download “PLoS ONE Kinesin” article from BbLab Information Enzyme Kinetics Lab. You will only read the abstract.
Peter Fuger, et al. Spastic Paraplegia Mutation N256S in the Neuronal Microtubule Motor KIF5A Disrupts Axonal Transport in a Drosophila HSP Model. PLoS Genetics, 2012. 8(11): 1-20.
B) Answer the questions.
| *** | Remember that lab preparation is weighted more heavily than lab reports in this course. Most of your time in any research experience will be planning and experimental design, and thus, a major focus in BIOL 2081C lab is your prelab work. Do not wait until the day of your lab to begin this pre-lab. Inability to access a computer is not a valid excuse for not completing this assignment on time. | *** |
Pre-Lab (2 pt each)
1. Consider the reaction: Glucose + hexokinase glucose-6-phosphate
Assign the molecule as the enzyme, substrate, and product
Glucose = __________________
Hexokinase = _______________
Glucose-6-phosphate= ________________
2. Which of the above reaction components corresponds to A, B, and E in the online tutorial?
Glucose = _________________
Hexokinase = ______________
Glucose-6-phosphate= ____ ___________
3. Fill in the blank:
When the reaction between glucose and hexokinase reaches equilibrium, the reaction rate, v, is ________________ because the reaction is moving ______________________.
4. How would you describe the relative proportions of substrate and enzyme in a biological reaction?
5. What is the “ceiling” that limits the rate at which an enzyme can convert a substrate into a product?
_______________________ ____
6. What does the Michaelis-Menton (M-M) curve describe? Why do scientists care about the M-M curve?
7. What does the flattening of the Michaelis-Menton curve signify with the respect to the enzyme active site and substrate concentration?
8. Referring to Section 5 of the tutorial:
If the Km and Vmax of Enzyme 1 are 16uM and 120uM/min, respectively, and Enzyme 2 has Km=11.8 microM, which enzyme has a stronger affinity for a given substrate?
If Vmax stays the same and Km decreases, does the reaction rate reach Vmax faster or slower?
9. What does “hyperbolic” mean in regards to the Michaelis-Menton plot?
10. True or False? When a reaction reaches equilibrium, product is no longer formed.
11. True or False? The Michaelis-Menton plot is a graphic representation of the product formed over time.
12. If you answered FALSE to questions 10 or 11, explain why.
Question 10. _____________________________________________________
Question 11. _____________________________________________________
13. Lysozyme is an enzyme that breaks down bacterial cell walls. Its Km is 6 mM. Chymotrypsin is a digestive enzyme that breaks peptide bonds and its Km is 5000 mM.
a) Insert the Km values for the two enzymes in the M-M curves below. Use a line to indicate where Km crosses the y- or x-axis.
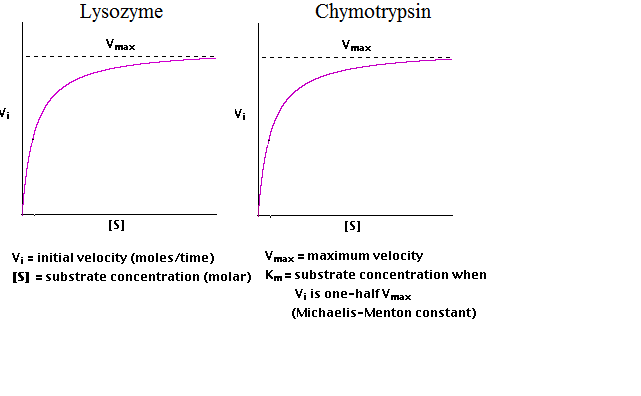
b) Which of these two enzymes has the higher affinity for its substrate and why do you think so?
c) Which enzyme(s) will be operating at maximum efficiency at the following concentrations of substrate?
Write L, C, B, or N in the box to the right of the substrate concentration, where lysozyme only (L), chymotrypsin only (C), both (B) or neither (N).
| 1 mM | |
| 100 mM | |
| 50,000 mM | |
| 6 mM | |
| 5000 mM |
Questions on article:
14. Make a schematic which includes the general shape of the motor protein kinesin, including the cellular components that bind to kinesin. (Will need to look up the function of kinesin in your text book.) Hint: Kinesin is a polar molecule, meaning that each end has a specific function. What are those functions?
15. Why is kinesin considered an enzyme?
16. How does mutant kinesin promote muscle weakness?
17. NOW complete the Experimental Design sections in Lab Activities (6pt)
Specific Information for this lab
In this lab you will first practice recording enzyme kinetic data using the enzyme -galactosidase as a model enzyme. You will then apply this knowledge to study the enzyme kinetics of kinesin, a cellular motor protein. -galactosidase offers analytical and visual information to study the conversion of a substrate to a product, because the substrate, ONPG, is clear, but the product , o-nitrophenol, is yellow. -galactosidase is a bacterial enzyme which has been studied extensively for decades. The basic reaction catalyzed by this enzyme in bacteria is: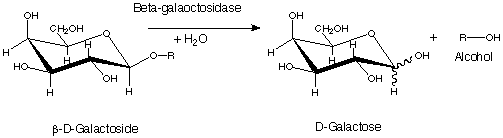
You will be using a colorimetric assay to measure -galactosidase activity.
Watch the video “How does a spectrophotometer work?” to see how the “spec” instrument is used detect color change in a colorimetric assay.
In this assay, a colorless substrate (ONPG, or o-nitrophenyl--D-galactopyranoside) is converted to a colored product (o-nitrophenol), which absorbs light at wavelength 420 nm and can be measured using a spectrophotometer. The molar absorptivity of o-nitrophenol =0.0045 OD/nmol. You can use this information to calculate the amount of product formed in your reaction.
Activity 1: Investing the Activity of β-galactosidase
By monitoring the appearance of the product o-nitrophenol (yellow color) over time you will quantitatively examine the rate at which -galactosidase catalyzes the conversion of ONPG to o-nitrophenol.
****Read through the procedures and create outlines for your data tables and/or figures before coming to lab. Your group will compile table/figures before beginning the procedure to make sure everyone is on the same page****
Construct the framework of a data table that will allow you to record the activity of β-galactosidase every minute over a 10 minute time period. To do this, consider what data you will collect and what your column headings should be.
Add experimental data to the table you generated above using the reaction between 3 ml of 0.2 mM ONPG mixed with 100uL enzyme.
Plot your results on the axes below. Add appropriate units to each axis.
4. Label the part of the above curve where the rate of the reaction is highest.
5. Label the part of the above curve where the rate of the reaction is lowest.
6. The highest rate is ___________________________ (estimate value, include units)
7. The lowest rate is ____________________________(estimate value, include units)
8. Now, convert your raw OD versus time data into rate (OD/min) versus time data, by calculating the rate of the reaction for each 1 minute interval:
Enter Table of data for rate of o-nitrophenol production at 0.2mM ONPG here:
9. Plot the rate of the reaction as a function of time, using the axes below. Include units on each axis:
10. What do you conclude from this experiment? Do all time intervals provide equally reliable measurements of the reaction rate between beta-galactosidase and 0.2 mM ONPG? Why or why not?
Activity 2: Effect of Substrate Concentration on the Reaction Rate
For this section, you will measure the activity of β-galactosidase at several different substrate concentrations and construct Michaelis-Menton curve from your data. This is the only way to ESTIMATE the Km and Vmax of the enzyme -galactosidase for the substrate ONPG.
1. Write the protocol that you will follow to measure the rates of the reactions set up in the table below. Measure enzyme activity over a 20 minute period, and decide what time intervals will you use to determine the rate of the reaction in each tube. Also construct a data table to record your results.
| Enter protocol here: | Enter Data table here: |
2. Set up four -galactosidase/ONPG reactions as follows (DO NOT ADD enzyme until you are ready to put the reaction into the spec. When ready, add 100uL enzyme to tube, invert to mix, pour in cuvette, and place in spec):
| Rxn 1 | Rxn 2 | Rxn 3 | Rxn 4 | |
| 2 mM ONPG | 3.0ml | 1.5ml | -- | -- |
| 0.2 mM ONPG | -- | -- | 3.0mL | 1.5mL |
| Buffer | -- | 1.5mL | -- | 1.5mL |
3. What is the initial substrate concentration in each of the reaction mixtures?
| Rxn 1 | Rxn 2 | Rxn 3 | Rxn 4 | |
| Initial [ONPG] (units?) |
4. Before you actually do the experiment, predict what will happen in the reactions from step 2 by plotting points that you expect on the axes below. Add the appropriate units to the axes.
5. Run the reactions according to your protocol. Plot results on the axes provided. Add the appropriate units to the axes.
6. If you think that your data are unreliable, alter your protocol and make the measurements again.
7. Label the parts of your curve where the reaction rates are highest and lowest.
8. Is the reaction rate equally sensitive to all changes in substrate concentration? Why or why not?
9. Where the rate is highest, estimate the fraction of enzyme molecules that are in complexes with substrate?
10. Does this rate approximate Vmax for beta-galactosidase? Why or why not?
Activity 3: Mutations in the enzyme kinesin lead to loss of motor control and neuropathy
NOTE: This portion of the lab is performed virtually on computer.
Scenario
You are an undergraduate researcher in a neuroscience lab that studies disorders in muscle motor control. Tamara, a postdoc in your lab, studies inherited genetic mutations in kinesin, a motor protein that “walks” along microtubules to deliver proteins and vesicle cargo down the length of neurons (Essential Cell, 577-578). To introduce you to the kinesin protein, Tamara tells you to check out these videos: here (video 2min) and here (video: 22 sec). Tamara is excited about a recent study she read that characterizes different mutants of kinesin and discusses the role of kinesin mutants in hereditary spastic paraplegias (HSPs), a group of neurodegenerative disorders characterized by spastic weakness of the lower extremities. She has acquired a sample of mutant kinesin from the authors of this paper and is performing a number of biochemical experiments on it.
Your project
Your project in the lab is to determine the enzyme kinetics, Vmax and Km, of normal and mutant kinesin using ATP as the substrate. You are excited because if you succeed you will be included as an author on Tamara’s manuscript. This would be a great resume booster and you want the lab to hire you as a summer intern, so you are trying to do your very best.
Tamara’s exciting reference
Peter Fuger, et al. Spastic Paraplegia Mutation N256S in the Neuronal Microtubule Motor KIF5A Disrupts Axonal Transport in a Drosophila HSP Model. PLoS Genetics, 2012. 8(11): 1-20.
Find on Bb under Lab Documents.
Procedure
Access the “Virtual Kinetics Experiment” in the Enzyme Kinetics tutorial and follow the prompts to perform the kinesin kinetics experiment virtually.
Introduction to Enzyme Kinetics
The vast majority of reactions occurring in cells are catalyzed by enzymes. The number of different enzymes at work at any given time is very large, as are the number of substrates consumed and products produced. Yet the fundamental mechanism of catalysis is similar for all enzymes. Enzymes do not alter the equilibria between substrates and products, nor do they alter Ghey simply make the reactions go much faster than they normally would- sometimes by a factor of a million or even a billion. Enzymes accomplish this by first binding to the substrate in a highly specific manner (Essential Cell 90-93) and then by altering the substrate molecule in such a way as to favor the formation of, and then stabilize, the transition state. The transition state is usually an unstable intermediate that can quickly break down. The spontaneous break down of the transition state molecule can lead to the reformation of the original molecule OR it can lead to the formation of a new molecule, the product. The ability to form and stabilize the transition state is the key to enzyme catalysis. It leads to a lower activation energy of the conversion from substrate to product, and this causes the overall reaction rate to increase dramatically.
There are a number of ways to study the properties of enzymes and enzyme substrate complexes. Biochemical and biophysical approaches tend to concentrate on the amino acids of the protein, particularly those that make up the active site and those that interact with cofactors and prosthetic groups. Another approach, called enzyme kinetics, focuses on the reactions themselves. These methods involve measurements of the rate of the reaction under different experimental and natural conditions.
In this experiment, you will use kinetic techniques to explore the properties of the enzyme beta-galactosidase.
You will then apply these skills in an online experiment to make predictions and hypotheses about the kinetics of the normal and mutant motor protein, kinesin.
Enzyme kinetics
Consider a simple cellular reaction in which A is converted to B by enzyme E.

The rate of this reaction can be measured by determining the rate of formation of B over time. The kinetic characteristics of the enzyme can be assessed by setting up a series of tubes and adding to each of them a different concentration of substrate A, while adding the same amount of enzyme to each, thus holding the enzyme concentration constant (Figure 2). In each tube, the initial linear rate of the reaction is called the initial velocity and is abbreviated, v0. The value of each v0 is determined as the slope of the line for each reaction; that is, the slope of each line shown in Figure 2. As the concentration of substrate (in this case A) is increased, the v0 of the reactions increase (Figure 2).

Figure 2. The rate of reaction of A B can be measured by measuring the rate of formation of B. The kinetics of the reaction can be assessed by holding the concentration the enzyme, [E], constant and increasing the concentration of the substrate, [A]. The slope of each line (change in B created / time) equals vo and it increases as [A] increases in each panel, from left to right.
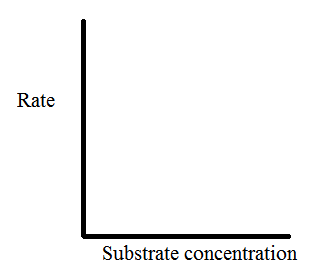
If these individual reaction rates (vo) are then plotted together on a graph of reaction velocity (vo) as a function of substrate concentration [A] (or in Figure 3, [S]), a curve like that shown in Figure 3 is produced. The amount of product increases linearly as substrate concentration increases up to a point, where the curves begins to level out and then finally plateaus. The maximum catalytic rate of the enzyme, i.e., the point at which the enzyme cannot work faster, no matter how much substrate is present, is call the maximum velocity and is abbreviated Vmax.

Figure 3. A plot of the initial reaction rates (v0) of an enzyme-catalyzed reaction as a function of substrate concentration [S] yields a characteristic curve, called the Michaelis-Menton curve.
One of the simplest kinetic models used to explain these phenomena is the one described in 1913 by Leonor Michaelis and Maud Menten. In the Michalis-Menton model (Karp text, Figure 3.17), it is assumed that the enzyme and substrate briefly unite to form an enzyme-substrate complex that then breaks down to form product and the original enzyme. Mathematically, this can be described in an expression for defining the initial velocity (v0) of an enzyme catalyzed reaction that can be used for all enzymes:
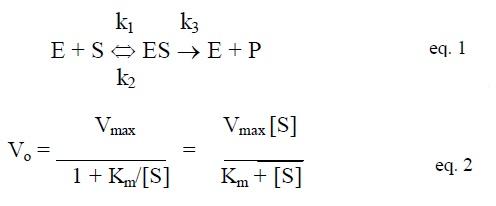
The important terms in this expression are Vmax and Km, which are unique to each specific enzyme-substrate pair. Today we call Km the Michaelis constant.
Note that Km is a concentration, not a reaction rate. It, therefore, has units of moles/liter, just as does substrate concentration. When v0 is equal to 1/2 Vmax, Km = [S]. Therefore, Km can be determined graphically by simply determining the substrate concentration giving half-maximal velocity. Note that enzymes with a small Km for a particular substrate will reach saturation at a low substrate concentration. A large Km indicates that saturation is reached only at high substrate concentrations.
The Michaelis-Menten equation shown above (equation 2) can be linearly transformed. That is, it can be mathematically manipulated so that it produces a straight line instead of a curve like that of Figure 3. This allows Km and Vmax to be more easily determined by using linear regression techniques. Linear plots also require fewer points (i.e., trials) to construct. One of the most common linear transformations is the Lineweaver-Burke plot. The Michaelis-Menten equation can be arranged in the form:
![]()
Notice that this equation has the general form y = mx+b. A plot of 1/v0 against 1/[S] yields a straight line with a y-intercept of 1/Vmax. The intercept of the line on the x-axis is equal to -1/Km. These plots are discussed in Karp page 103.
The two parameters that characterize the kinetics of an enzyme for a given substrate are Vmax and Km. More information on each is provided below.
Vmax:
A single enzyme molecule can convert molecules of substrate into product multiple times during a given time period. The maximum rate for a group of molecules is called Vmax. Imagine that the concentration of substrate is so high that there is essentially no time when an enzyme molecule is not bound to substrate. That is, as soon as a bound substrate molecule reacts to form product, it leaves the enzyme and is instantly replaced by a fresh substrate molecule. This is what we call a "saturating" concentration of substrate—because at this concentration, the active site is always filled (saturated) with substrate. Under such conditions, the rate at which an individual enzyme molecule can turn substrate into product is the highest it can possibly be. This maximum cycling rate per molecule is called the turnover number (TON). A group of 100 enzyme molecules, each able to convert substrate to product at the same maximum cycling rate, would produce an observed Vmax that was 100-fold higher than the turnover number.
Km:
The Michaelis constant (Km) of an enzyme is a measure of the affinity of the enzyme for its substrate. The value of Km for a particular enzyme is defined as the substrate concentration at which half of the enzyme molecules are complexed with substrate. Under these conditions, at any instant, half of the total enzyme molecules are capable of catalysis. Therefore, the observed reaction rate is half of the maximum possible rate—the rate achieved when all the enzyme molecules are complexed with substrate, Vmax.
The substrate concentration required to drive half of the enzyme molecules into enzyme-substrate (ES) complexes depends on the ability of the enzyme to bind its substrate. Thus, an enzyme with a high affinity for its substrate will have a low Km. That is, 50% of the enzyme molecules will have bound substrate at a relatively low concentration of substrate. In contrast, an enzyme with a low affinity for its substrate has a high Km value—because a relatively high concentration of substrate is required to drive 50% of the enzyme molecules into complexes with substrate.
Enzyme Inhibition (Essential Cell 106)
One of the major control mechanisms of enzymes is inhibition. There are two general categories of inhibitory molecules, irreversible and reversible.
Irreversible inhibitors covalently bind to an enzyme and cannot dissociate from it.
Examples: Nerve gas, penicillin
Reversible inhibitors, on the other hand, do not bind covalently and can dissociate from the enzyme. Two types of reversible inhibitors are competitive and non-competitive.
Competitive inhibitors bind to the active site, and thus compete with the substrate for access to the enzyme. In theory, the effects of the inhibitor can be negated if enough substrate is added; therefore, a competitive inhibitor should increase the Km of an enzyme but not alter the Vmax.
Examples: ACE-inhibitors to decrease blood pressure
A non-competitive inhibitor binds to the enzyme at an allosteric site, or a location other than the active site. The binding of the inhibitor alters the enzyme so that the catalysis of substrate to product is inhibited and, as a result, the Vmax is decreased. A true non-competitive inhibitor does not change the Km; however, many inhibitors that decrease the Vmax also increase the Km.
Examples: Tipranavir, an HIV therapeutic drug
The figure below illustrates how the Lineweaver-Burke curve is altered in the presence of an inhibitor.

Communication of Data to your Post-Doc Mentor
This is a group lab report.
Use the questions below to guide you through writing components of a brief data report. If you need help with your writing and/or analysis, talk to your TA, who is just as interested in reading a successful report as you are in writing one.
Read instructions- everything you need to include is provided. Do not make it harder than necessary. You will not earn points by adding excess information.
1. (5 points) Title Page: Give a descriptive title for the kinesin kinetics experiment (Activity 3 in this lab)
2. (25 points) Results Table. (NO RESULTS TEXT IS REQUIRED FOR THIS REPORT)
Include a) Data table organizing the Km and Vmax for wild type and mutant kinesin. [Include units or ZERO POINTS will be awarded for the results section.]
b) Table legend in this format: Label. Title. Analysis statement.
3. (25 points) Analysis/ Discussion. [Must be written in paragraph form or minus 10 points. Bullets are given only to assist with analysis and logical flow of information].
Restate the purpose of your project.
State the major results you found?
Discuss how the kinetic parameters you measured for mutant kinesin should theoretically alter the function of the mutant enzyme compared to the wild type enzyme.
Does mutant kinesin bind substrate (include correct name of substrate) better, worse, or the same, relative to wild type?
Discuss each parameter (Vmax and Km) as to how it relates to the ability of mutant kinesin to bind to the microtubule and hence, to transport proteins along the neuron.
How then does the altered transport function of mutant kinesin lead to hereditary spastic paraplegias, as described in the companion article to this lab.
NOTE: you may need to do some background reading to support your conclusions. You can use our text book, the article utilized in this Activity, or any scholarly literature source.


