Question 1Assume you have noted the following prices for paperback books and the number of pages that each book contains. Develop a least-squares estimated regression line. Go to Excel. Create a scatt
4
Running head: Project Week 1
93/100 Review Comments
Week 1 Project
Yvonne Lang
Grantham University
Week 1 Project
For each of the 2 majors create a pie chart using the column ‘School Type’. Comment on your results.
08/02/2018 03:08 PM
Remember that the data is connected to ROI. ROI should be in the title, and it should be in the graph interpretation also

We can see here that 80% of the Business majors in this study attended a private school.
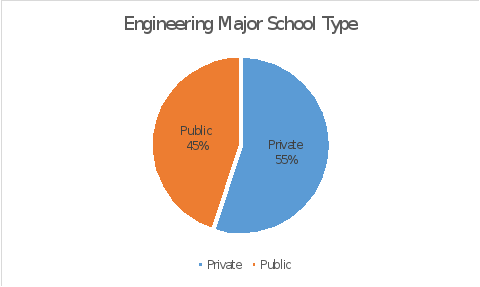
We can see here that the type of school attended for engineering is almost half private and half public.
For each of the 2 majors create a frequency distribution and histogram using the column ‘Annual % ROI’. Group with starting at 6% (0.06), ending at 11% (0.11), and go by 0.5% (0.005).
| Business Major | |
| Annual % ROI | Frequency |
| 6 to 6.5% | |
| 6.5 to 7% | |
| 7 to 7.5% | |
| 7.5 to 8% | |
| 8 to 8.5% | |
| 8.5 to 9% | |
| 9 to 9.5% | |
| 9.5 to 10% | |
| 10 to 10.5% | |
| 10.5 to 11% | |
| 11 to 11.5% | |
| 11.5 to 12% | |

| Engineering Major | |
| Annual % ROI | Frequency |
| 6 to 6.5% | |
| 6.5 to 7% | |
| 7 to 7.5% | |
| 7.5 to 8% | |
| 8 to 8.5% | |
| 8.5 to 9% | |
| 9 to 9.5% | |
| 9.5 to 10% | |
| 10 to 10.5% | |
| 10.5 to 11% | |
| 11 to 11.5% | |
| 11.5 to 12% | |

From these charts, we can conclude that most college educations will yield at least a 6.5% and up to an 11.7% Annual ROI if you major in Business or Engineering.


