In this assignment, discuss the concept of emerging markets in your words. If someone asked you to explain the concept of an emerging market, what would you tell them? Moreover, it is important to k
Spring 2016
ENGR 2411 Mechanics of Materials Lab
Section No. 001
Lab No. 1
Lab Title: Measurements
Submitted to:
Dr. Zahid Hossain
and
Mr. AM Feroze Rashid
College of Engineering
Submitted By:
Name: Kudakwashe Makuvire
Student ID: 50378716
02/15/2016
TABLE OF CONTENTS| Title | Pg. No. |
| List of Tables | |
| List of Figures | |
| Abstract | |
| Introduction | |
| Background and Methodology | |
| Results and Discussions | |
| Conclusions and Recommendations | |
| References Cited | |
| Appendix A Raw Data | |
| Appendix B Detail Calculations | 10 |
| Table No. and Title | Pg. No |
| Table 1 Raw Data | |
| Table 2 All raw data and calculations of the Lab experiment | |
| Table 3 Population Calculations | |
| Figure No. and Title | Pg. No |
| Figure 1. Component to be measured |
ABSTRACT
The majority of Mechanics of Materials study will involve the changes in dimensions of the material under question. This means that we will be measuring a lot of dimensions in this class, and it is very important that we master the basic concept of measuring the dimensions of a material accurately.
Keywords: Measure, Caliper, Scale, Mean, Deviation.
INTRODUCTION
This lab will help improve our skill in the use of the measuring equipment, specifically the Micrometer screw gauge and the Vernier Calipers. Most of the components we will be using in our experiments will be undergoing very minute dimensional changes because of stress and strain; so it is very important that we are very accurate in using the equipment as small misreadings will result in very large errors.
BACKGROUND AND METHODOLOGY
Before we began measuring the component in question we went over how to use the Vernier calipers. The steps we took were as follows:
We made sure the Vernier scale read zero when it was fully closed, ensuring the scale was properly calibrated.
The measurement of the object in question is taken by clamping the jaws of the caliper about the object and using the screw, or the automatic lock in our case, fix the jaws of the caliper.
Read the centime scale or the main scale up to the zero of the Vernier scale.
Read the Verneir scale up to the Verneir reading that directly coincides with the main scale reading
Add the two readings (main scale and vernier scale) together.
The steps for the measurements of the component and the subsequent calculations went as follows:
After receiving the component, we compared it with the drawing of the component we received so as to determine which part of the component corresponded to what letter
We took measurements of the different parts of the component, all taking turns until we had three different readings for each part of the component.
A mean of the three reading was taken for each different part of the component.
The data was recorded and tabulated.

Figure 1. Component to be measured
Equations
|
| Σ|x - μ| |
Standard Deviation
![]()
% Difference = [(Population Mean-Sample Mean) / (Population Mean)]*100
(di)2 = (Mean Deviation)2 Variance = (Standard Deviation)2
RESULTS AND DISCUSSIONS
The results of the measurements were tabulated in Table 1. as shown below.
Table 1. Raw data
| Dimensions | Gr 1 (mm) | Gr 2 (mm) | Gr 3 (mm) | ||||||||
| 45.65 | 45.70 | 45.55 | 44.80 | 44.75 | 44.80 | 45.45 | 45.40 | 45.55 | |||
| 21.85 | 21.80 | 21.75 | 21.35 | 21.35 | 21.15 | 21.75 | 21.85 | 22.10 | |||
| 32.30 | 32.30 | 32.20 | 33.30 | 33.20 | 33.30 | 32.65 | 32.85 | 32.85 | |||
| 22.40 | 22.40 | 22.35 | 22.30 | 22.35 | 22.35 | 21.65 | 21.75 | 21.55 | |||
| 11.70 | 11.65 | 11.70 | 11.75 | 11.70 | 11.75 | 11.55 | 11.65 | 11.65 | |||
The resulting calculations and readings required we tabulated in table two, which is shown on the next page.
The sample mean for our group varied rather significantly from the population mean, if we compared our results to those of the other groups. This was especially notable in the first three readings, a, b and c. However the readings we made as a group were very consistent, suggesting our dimension part could have been different from the other two groups.
The average of all the sample deviations is 0.05615
The values of the absolute values would be bigger than the average of the regular values. As all the values would be getting added together without any of the number subtracting from the values.
In our case the sample standard deviation is more appropriate in our case because of the outlying values of the second group. The sample standard deviation of values per group would more accurately represent the readings taken by the group and if bunched together with other groups would result in skewed representation of the data.
Table 2. All raw data and calculations of the Lab experiment
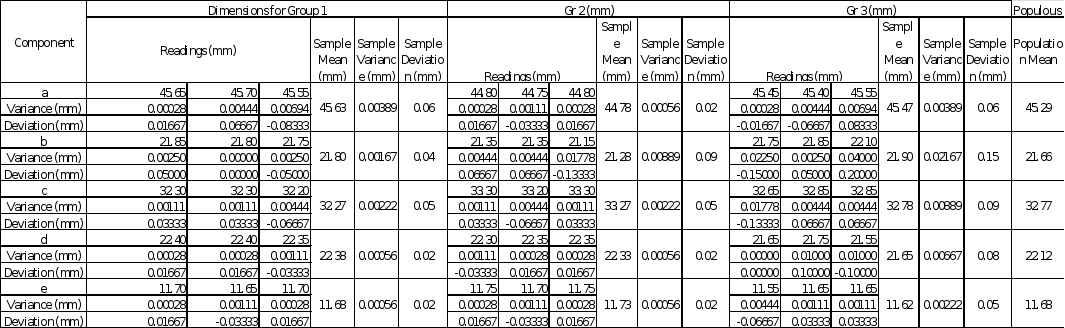
Tbale 3. Population Calculations
| Table 2. Descriptive Statistics of Components (Population) | |||||
| Sample | |||||
| Measurements | |||||
| Mean (mm) | 45.29 | 21.66 | 32.77 | 22.12 | 11.68 |
| Deviation (mm) | 0.15811 | 0.31091 | 0.20000 | 0.15275 | 0.10000 |
| Median (mm) | 45.45 | 21.75 | 32.85 | 22.35 | 11.70 |
| Std Deviation (mm) | 0.3715 | 0.2894 | 0.4137 | 0.3384 | 0.0583 |
| Variance (mm) | 0.1380 | 0.0838 | 0.1712 | 0.1145 | 0.0034 |
CONCLUSIONS AND RECOMMENDATIONS
This lab allowed students to become familiar with the Vernier Calipers as well as use equations to find statistical calculations both of which will be needed in later labs. The experiment gave accurate results that are shown in the figures and tables of this report.
APPENDIX A RAW DATA
APPENDIX B DETAIL CALCULATIONS
10


