just analyze the graph and write about it same as the example provided see what I've wrote. The sensor was in ME 250 room I just need two paragraph and that's it.This is the assignment.1. Provide a l
This is what I’ve did do for me this graph the same too.
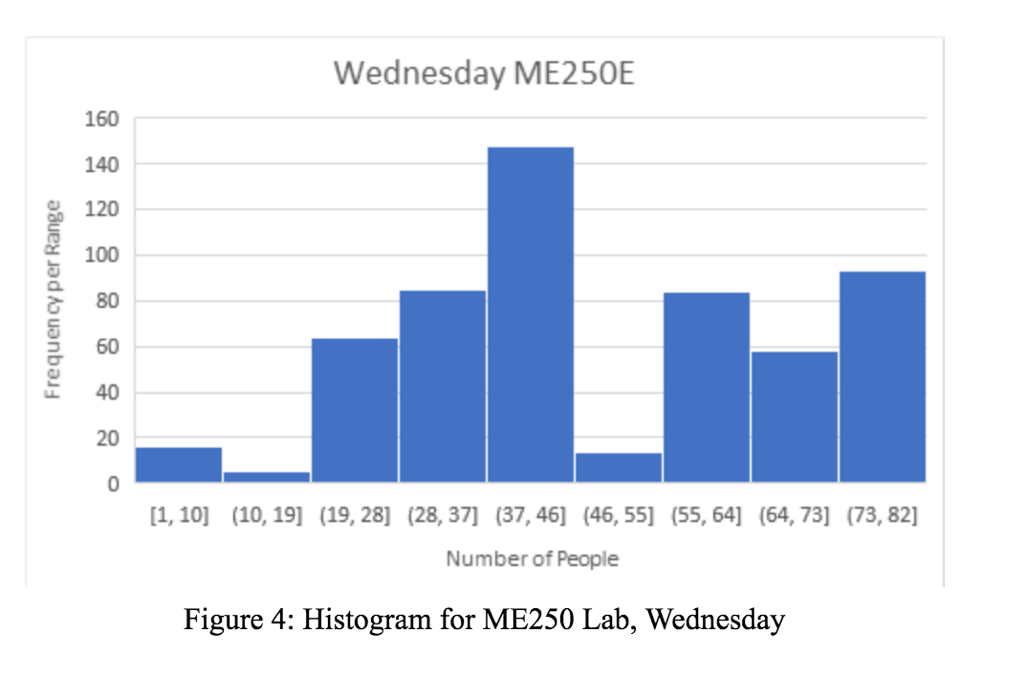
Wednesday is one of the busy days in the lab due to classes running. This can be seen clearly in the histogram (figure 4), as it is skewed slightly more to the right, leaning towards the larger numbers. The largest bar is right in the center, which indicates that during Wednesday, the room very frequently had somewhere between 37 and 46 people. The average was roughly 48 people, which seems a little high. Team 9 believes that there is a possibility that there is error in the data, since it is unlikely that 73-82 people were in the room as frequently as the data suggests. However, they believe that the center bar is mostly accurate to what occurs in the room during that day. The first hour of the day tends to be fairly busy, since class begins at 9:00 AM. At that time, there are 4 TA’s in the room, which seems like a good amount. It equates to roughly 10 students per TA. However after 10:00 PM, there is only one TA on duty, which seems a bit low since the same amount of students are still in the room at that time. According to Team 9, it could be a good idea to put more TA’s on duty during class time on Wednesdays during the second hour of class.
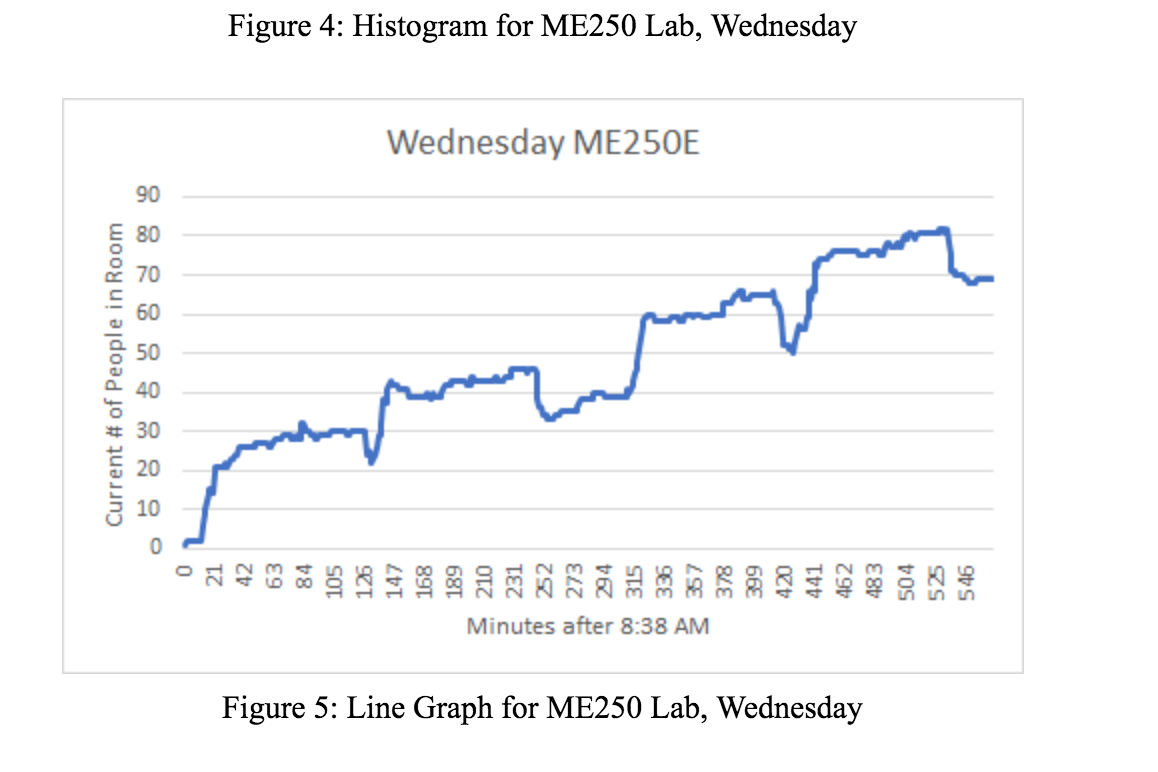
Other important points to note for Wednesday are the minimum number of people in the room during the day, which was one, the maximum number of people in the room at once, which was 82 (this is most likely an error point, as it would be very unlikely for there to be 82 people in the room at once), and rush hours, which can be seen on the line graph to be around 8:50 AM to :05 AM and 10:50 AM to 11:05 AM.