SCMA 301 Case 5 Scatterplots and Linear Regression For this case you'll analyze the relationships between housing prices and the size of the house
SCMA 301
Case 5
Scatterplots and Linear Regression
For this case you’ll analyze the relationships between housing prices and the size of the house for the housing market in the Richmond area. Again use the data in your Databook on Worksheet 1: Richmond Housing Prices.
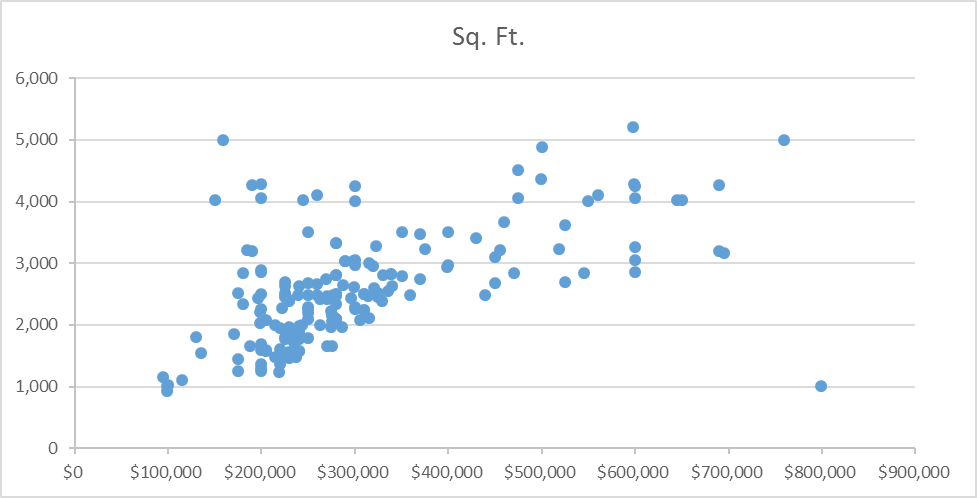
Create a Scatterplot for the number of square feet related to price.
What is the explanatory or predictor variable and what is the responses variable?
Is the pattern positive, negative or none?
What is the form of the scatterplot?
What is the strength of the association?
Are there outliers?
What is the correlation coefficient?
Determine the linear regression model for this data.
What are the meanings of the slope and intercept in your regression model?
How much of the variation in home prices can be attributed to square feet?
Reference: Sharp, DeVeaux and Velleman: Chapter 4
A)
B) For this scatterplot, the explanatory variable would be the prices of homes(x-axis) and the reponse variable would be the area of Sq. ft. of the homes(y-axis).
C) The pattern shows a positive correlation.
D) It has a linear association form.
E)


