This assignment helps you develop the skills to master the following course competencies:Apply the theories, models, and practices of finance to the financial management of the firm. Assess the impac
Running Head: Financial Analysis Activity, Canopy Growth Corporation 0
Financial Analysis Activity
By
[Name of Student]
Course
Professor
[Name of Institution]
December 09, 2018
Canopy Growth Corporation is a Canadian based company that produces weed for the pharmaceutical industries. The company was developed in 2014 with Bruce Linton as its CEO from 2014 till date. The company has been one of the growing companies in Canada with some of the interesting financials compared with the industry average for the first two years i.e. 2014 and 2015.
Beginning with the income statement items as a percentage of sales show that the company has been performing in line with the general trend line of the industry as well. The operating cost for the industry in 2014 was 87.6% whereas the operating cost for the company in 2014 was 87.4%. This shows that the company did reasonably well in its first year of operations as compared to the industry average. Another positive point for the company is that it has paid out a dividend of 0.1% for the year 2014 while the pay-out percentage for dividend for the industry holds at 0%.
However, the depreciation and amortization for the company was 3.3% as compared to the industry average of 2.8%. This is justified because as the company has been recently established, the cost of wear and tear for the equipment used in the company will be higher in the initial years and then it will reduce in the later years. This is true for the company and the industry using diminishing balance method for depreciation.
Furthermore, the interest on debt for the company is 2.9% which is higher than the industry average of 1.3%. This is also justified as the company is a new company and therefore, often banks are reluctant to lend funds to new start-ups because of the high amount of risk involved. In order to compensate for the high amount of risk involved, banks charge a higher price for new start-ups than a more established firms in the industry. Subsequently, as a result of higher interest, tax savings are observed through the financial model for Canopy Growth Corporation.
Ratio Analysis
There are many different ratios that are more commonly used in the industry across the globe that helps to understand the positioning and performance of the company better in comparison to its peers or the industry average.
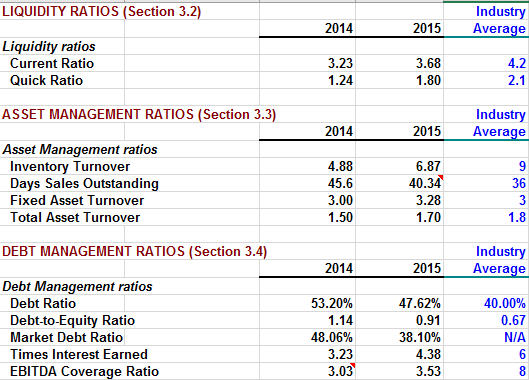
The asset management ratio shows how successful was the company in making use of its assets and managing them efficiently. The inventory turnover for the company was lower in 2015 was 6.87 times whereas the industry average was 9. This shows that the movement of the company’s inventory was less than the industry average.
Similarly, the day sales outstanding ratio shows the ability of the company to be able to collect debts from the debtors. On average, the industry takes 36 whereas the company has a day sales outstanding ratio of 40.34. Although, the company has improved as compared to 2014 but still needs to improve its debt collection time period to avoid chances of defaults.
The fixed asset turnover and total asset turnover shows the efficiency of the company in an attempt to be able to improve it. Both of these ratios have increased in 2015 for the company. in case of fixed asset turnover, the company with an average industry of 3.28 so the company is doing better than the industry average of 3. However, the total asset ratio is with 0.01 less than the industry average. This shows that the company is doing very well.
The debt management ratios show the importance of the ability and the capacity of the company is doing as well. The debt ratio of the company is higher 2015 than 2014 of 47.62% while the industry average is 40%. In this case, the Canopy Growth Corporation appears to be highly leveraged company than the average.
Debt to equity shows a similar trend and comparison with industry average. Even though the company’s debt to equity ratio has fallen from the previous year, the industry average of the current year 2015 is 0.67 whereas for Canopy Growth Corporation is 0.91. This allows the lenders about the capacity of the company to be able to endure the interest and provide the necessary cushion to help growth of the company. Other debt management ratios including Time interest earned, EBITDA coverage ratio comparison with the industry average shows that the ratios of both of these firms are lower.
Profitability analysis is one of the most important ratios for the financial analysis. This is mainly because they are easy to use and calculate and helps the management of the company carry out exclusive decision making for future growth prospects of the company. Also, it is one of the major tools used by the investors who are looking to buy shares in the company.
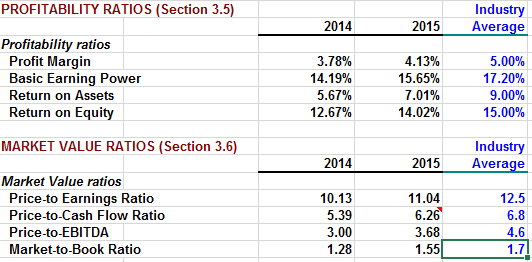
The profitability analysis shows that the company is doing well in comparison to it previous year i.e. in 2014. However, the company’s performance as compared to the industry is below average. This is mainly because the existing companies in the industry have been able to achieve the economies of scale and have produced a sustainable means of efficient strategies that help reduce cost and increase profitability. These ratios help the management of the company to be able to easily identify areas that needs further improvement. This is a little difficult to achieve for a company that is only two years old. The profit margin for Canopy Growth Corporation was 4.13% as opposed to the industry average i.e. 5%.
Similar is the trend for basic earning power, return of assets and return on equity. The basic power earning shows the ability of the company to make money out of its operations before taking into account any effect of the interest and taxes. The return on assets show the efficient use of assets to generate return or net income. The return on equity show the efficient use of equity to generate net income.
The basic earning power for the company is 15.65% whereas the industry average is 17.2%. The return on assets for the company is 7.01% whereas for the industry is 9%. The return on equity for Canopy Growth Corporation is 14.02% but the average for the industry is 15%. These differences are not very huge and given the speed with which the company is growing, it will be able to perform above the industry average very soon.
The market value ratios show the importance and positioning of the company in the market and the perception of the major players of the market regarding the company. The price to earnings ratio shows the relationship between the market price and the earnings per share of the company. Even though the price to earnings ratio have improved for Canopy Growth Corporation from 10.13 to 11.04, it is still lower than the industry average which is 12.5%.
Similar is the case with other ratios as well such as the Price-to-Cash flow ratio which is 6.26 for the company but the industry average stands at 6.8. This ratio shows the relationship between the company’s price and cash flow’s earned. Furthermore, the price to EBITDA shows the relationship between the price and earnings before interest, taxes and depreciation. This shows that how much the price can change expectedly, given a changes in EBITDA. The price-to-cash flow of Canopy Growth Corporation is 3.68 whereas the industry average is 4.6.
Also, the market to book ratio shows the change in the market value of the company, given the change in the book value. For Canopy Growth Corporation, it is 1.55 whereas the industry average is 1.7. All of the market ratios affirm that the Canopy Growth Corporation is performing well as compared to last year but it is still below the industry average. However, given the same company’s, it will be able to soon outcast the market.
Company’s Cash Flows
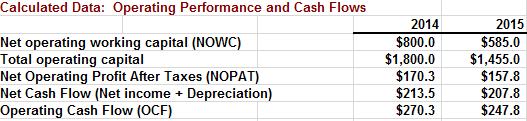
The cash flows of the company show that as compared to the last year, the operating cash flow, net cash flows of the company have fallen. This may be because of the lower sales as compared to the last year. However, management should make decisions that will help them overcome the problem of reducing cash flows because if this trend continues, the company will have serious problems in paying off its creditors on time. As a matter of fact, the company has various options to fill the needed gap after forecasting the future needs of cash flows in the form of bank overdraft, short-term financing etc.
Over Financial Health of the company
The analysis shows that the Canopy Growth Corporation has been able to perform very well. Provided that the current financials, the company has performed very well as most of the ratios are closer to the industry average. The future of the company looks optimistic due to the improvement in the current year’s performance of 20105 as compared to the previous year’s performance. There are certain types of efficiencies that can only be achieved through time such economies of scale. However, there is always room for improvement and space to think and reinvent strategies that can help mitigate the costs and the increase the profits in the short time.
References
Canopy Growth Corporation. (2018). Home. Retrieved from Canopy Growth Corporation: https://www.canopygrowth.com/
Canopy Growth Corporation. (2018). Investors. Retrieved from Canopy Growth Corporation: https://www.canopygrowth.com/investors/
Market Screener. (2018). Canopy Growth Corp. Retrieved from Market Screener: https://www.marketscreener.com/CANOPY-GROWTH-CORP-16195087/?type_recherche=rapide&mots=cano


