just answers these question based on the project make the answers short as can as you could QUALITATIVE. These are intentionally open-ended. In "real life" an interviewer would be mostly looking
I. Histograms
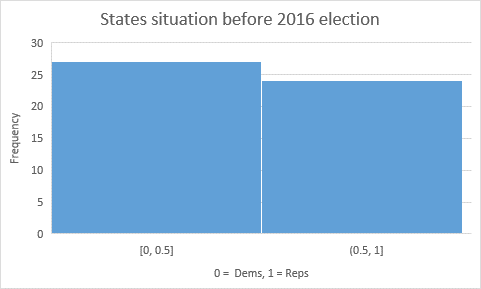
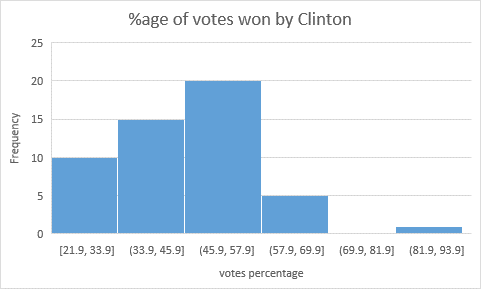
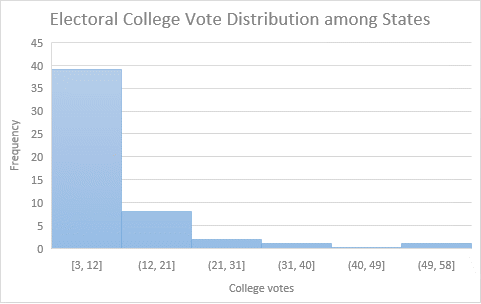
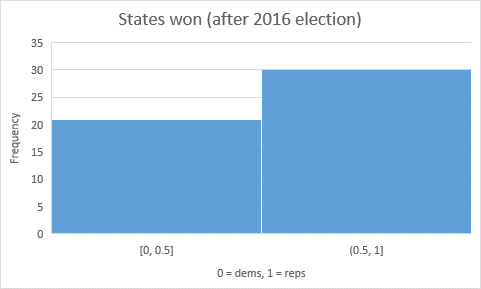
For each variable, provide a histogram that summarizes its distribution. Make sure each histogram has a title and that both chart axes have labels.
II. Simple Regression Analysis
In this section, you will report results from performing SIMPLE regression with each of your independent variables.
Estimated Regression Parameters and R-squared. Please report the regression parameters and R-squared values found via simple regression. Provide UNITS with your regression coefficients.
| Independent Variable Name | R-squared |
|
|
| State Majority (after 2012 elections) | 0.616858 | 0.222222 | 0.777778 |
| Clinton votes percentage | 0.540414 | 1.924159 | -0.02999 |
| Electoral College Votes | 0.001831 | 0.602996 | -0.00218 |
 (y-intercept)
 (slope)
Residual Plots. For each simple regression model, provide a residual plot showing e (the residual error) versus x. Make sure each plot has a title and that both axes have labels.


Inference. Populate the following table using a confidence level of 99%.
| Independent Variable Name | p-value for | p-value for | Is relationship significant at 99% confidence level? (Y/N) | Confidence Interval (Lower, Upper) | Does inference appear to be valid? (Y/N) | |
| State Majority (after 2012 elections) | 0.000549 | 1.44E-11 | Yes | 0.540469 | 1.015087 | Yes |
| Clinton (%age of votes won) | 7.3E-14 | 1.21E-09 | Yes | -0.0407 | -0.01928 | Yes |
| Electoral College Votes | 6.45E-07 | 0.767965 | No | -0.02186 | 0.017508 | Yes |
III. Multiple Regression Analysis
Next, you will perform a MULTIPLE regression using all of the independent variables together.
Correlation Table. Provide a table showing the correlation between your independent variables. This is important for knowing whether your model might suffer from multi-collinearity. Use a different cell color to indicate values that are greater than 0.5 in absolute value (positive or negative).
| State Majority (after 2012 elections) | Clinton | Electoral College Votes | |
| State Majority (after 2012 elections) | -0.7468 | -0.19103 | |
| Clinton (%age of votes won) | -0.7468 | 0.25983 | |
| Electoral College Votes | -0.19103 | 0.25983 |
Estimated Regression Parameters and Confidence Intervals. Report the regression parameters found via multiple regression using the table below. Provide UNITS with your regression coefficients.
| Parameter | Estimated Value | p-value | Significant at 99% confidence? (Y/N) | Confidence Interval | |
| y-intercept | 0.947624238 | 0.001043 | Yes | 0.220267561 | 1.674980915 |
| State Majority (after 2012 elections) | 0.527877739 | 0.000072912 | Yes | 0.202426659 | 0.853328818 |
| Clinton (%age of votes won) | -0.015500733 | 0.003726174 | Yes | -0.029129389 | -0.001872077 |
| Electoral College Votes | 0.007982467 | 0.070869747 | No | -0.003616981 | 0.019581915 |
Residual Plot. Provide a SINGLE residual plot showing e (the residual error) versus  . Make sure each plot has a title and that each plot axis has a label.

Multiple Regression Summary. Answer the following questions:
What is the Adjusted R-squared value for this model?
R2 = 0.691269241
Does inference appear to be valid based on your residual plot?
Yes


