I have sent an attachment of the assignment along with a sample and format, plus a link to the web page where the experiment is to be done.
Project 1 Description
This experiment uses the Method of Adjustment to study the effect of the Muller-Lyer Illusion on your ability to match the length of two lines. You will do 20 trials of the Muller-Lyer Illusion experiment. The method you are using is the Method of Adjustment, one of 3 classic psychophysical experimental methods. You are trying to find your difference threshold, the largest amount of difference between two stimuli that does not make them seem different. On each trial you will get a result expressed as a percent of difference from the standard stimulus. You must write down each percentage as it is presented, before going to the next trial. When you have completed all 20 trials and have recorded all 20 percentage difference results, add up all 20 difference percentages, then divide by 20. This is the average percentage difference for you. This average percentage difference is your difference threshold,expressed as an average of the difference percentages between the two line segments. In other words, the illusion caused you to see the line segments as equal in length when they were actually, on average, xx% different from each other.
Normally you would have actual length differences instead of percentages, but the experiments I wanted to use have been made inaccessible. The experiments you will use for projects 1 and 2 both give percentage results. This is not as good as having the actual numbers but you can get the same sense of what the difference threshold is all about.
Use your results to write up your project using the sample project as a guide (found on the course shell). The sample project was about the Method of Limits using the Muller-Lyer Illusion to find a difference threshold. Be sure to read about the Method of Adjustment and how it works. Your Project 1 write up should be similar in length and detail to that of the sample project.
Link to experiment
https://michaelbach.de/ot/sze-muelue/index.html
Müller-Lyer Illusion from Michael’s Visual Phenomena & Optical Illusions

Top of Form
Bottom of Form
What to doGrab the central arrow with your mouse and drag its tip to the centre between the outer arrowheads. Now you may press “Show result” and learn how you fared…
I hope you enjoy this “Müller-Lyer Illusion” from 1889. When one bisects the horizontal line, it is quite normal that large errors are made, so don’t be annoyed or disappointed (I err by ≈ 10%).
This phenomenon is placed in the category “size constancy” because I find the perspective explanation (see further down) very convincing. Müller-Lyer’s original figure showed two double-ended arrows, here I used the Brentano variant.


The German satirical magazine ‘Pardon’ published in ≈1970 an article on this illusion. It was accompanied by the two neighbouring pictures, demonstrating a Müller-Lyer effect on enclosed objects ;-). [The right elephant not only looks larger, but also happier…]
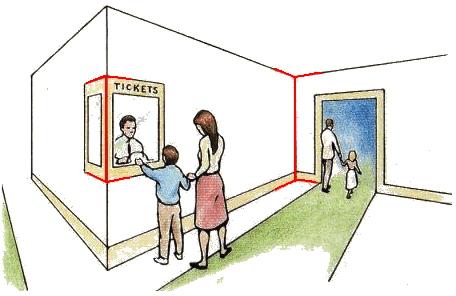
The picture on the right (from Amazingart) demonstrates the perspective explanation (Gregory 1968):
When you place the mouse pointer over the picture, the blue lines indicate that the two red arrows are of equal length. The arrow configuration “angles in” (near the ticket counter) is always the front side of an object, the “angles out” configuration occurs at the far end of a room, for instance (here next to the door). So, given no further information (as in the Müller-Lyer arrangement at top), the brain assumes the “angles in” configuration to be closer, computes size constancy on it, and –given identical retinal size of the two angle arrangements– concludes that the “angle in”-line is shorter.
[Thanks to Michael Birnbaum for pointing out that the green ruler mark had, at some time, not really been centered…]
Some sourcesMüller-Lyer FC (1889) Optische Urteilstäuschungen. Archiv für Physiologie Suppl. 263–270
Brentano F (1892) Über ein optisches Paradoxen. Zeitschrift für Psychologie 3:349–358
Müller-Lyer FC (1894) Über Kontrast und Konfluxion. Zeitschrift für Psychologie IX p 1 / X p 421
Lewis EO (1909) Confluxion and contrast effects in the Mueller-Lyer illusion. Brit J Psychol 3:21–41
Rudel R & Teuber HL (1963) Decrement of visual and haptic Müller-Lyer illusion on repeated trials: A study of cross-modal transfer. Quarterly Journal of Experimental Psychology 15:125–131
Segall HH, Campbell DT, Herskovits MJ (1966) The Influence of Culture on Visual Perception. Bobbs-Merrill, Indianapolis
Dewar RE (1967) Stimulus determinants of the magnitude of the Mueller-Lyer illusion. Perceptual and Motor Skills 24:708–710
Gregory RL (1968) Perceptual illusions and brain models. Proc R Soc Lond B Biol Sci 171:24279–296Christie PS (1975) Asymmetry in the Mueller-Lyer illusion: Artifact or genuine effect? Perception 4:453–457
Restle F & Decker J (1977) Size of the Mueller-Lyer illusion as a function of its dimensions: Theory and data. Perception & Psychophysics 21:489–503
Adam J & Bateman L (1983) A correlational analysis of symmetry between the arrowhead and featherhead Mueller-Lyer illusions. Perception 12:119–129
Pressey AW & Martin NS (1990) The effects of varying fins in Mueller-Lyer and Holding illusions. Psychol Res 52:46–53
Lab Report Form
Projects should be written in Microsoft Word only and submitted by email attachment from your Troy email account.
Title Page
Give your name and the number of the Project.
Introduction
Describe the general procedure you are using and its purpose. If, for example, your procedure is the Method of Adjustment or Method of Limits using the Muller-Lyer Illusion, describe how the method works (Adjustment or Limits) in general. Do not describe the specific test (i.e., looking at lengths of lines) you are doing at the moment. Tell for what purpose, in general, you use the method, who developed it, and when. Use your textbook and Outside Articles for this.
Method
Participants - Since you are the only participant, describe yourself in experimental terms (gender, age, if you care to, enrolled in Sensation and Perception, PSY3310 at Troy University-Montgomery) but do not give your name. Use complete sentences, not a list.
Materials - Describe the software you are using, giving the source. Use complete sentences, not a list.
Procedure - Start with a description of the purpose of what you are doing and give the exact details of the particular procedure you are doing. Give enough detail so that someone could do this exercise by following your description. Write in paragraph form with complete sentences. Do not give a list of steps. Do not tell me you turned on the computer and then clicked on the link in the course shell. Only give the procedure used to collect data.
Results
Tell the results you got (the numbers or the outcomes), including the raw data and the statistical information produced, the difference threshold, DL. I repeat, YOU MUST GIVE ME THE RAW DATA. Be sure to give me the units in which the data was measured (percentage difference)
Discussion
Tell what these results mean about your performance. What do they indicate? Use your book to help you interpret the results. Refer to the purpose of the exercise (finding your difference threshold) to help your interpret your data. What is this procedure supposed to show? I got these results, now what do they mean about my performance?
Introduction
In this lab, the method of adjustment was used to test the susceptibility of the horizontal-vertical illusion. Wundt invented this test in 1868 in an effort to calculate a participant’s difference threshold. I could not find literature that explained why this illusion works, but I did read that it is one of the most popular and accepted tests for difference threshold in the world. Perhaps humans usually read from left to right (or right to left), we’re used to processing the horizontal quicker than the vertical, causing inaccurate interpretations in tests like these; conducting the test on an Asian community which reads top to bottom may answer this question.
Method
Participant: A 28 year old male student, enrolled in Sensation and Perception, PSY3310 at Troy University. No preconceived knowledge was brought to the test. The test was done in ambient light conditions.
Materials: A Virtual Lab Manual CD-ROM, 8th Edition, by E. Bruce Goldstein was used. The software was operated on a computer operating on a Windows 7 operating system.
Procedure: Two line stimuli were presented. One line, blue in color was horizontally, and one, red in color, was presented vertically. The vertical line acted as the constant, and remained the same length through each of the tests. The horizontal line grew larger or smaller depending on the input of the participant, relayed by a slide bar underneath the lines. The participant was instructed to attempt to visually estimate the size of the vertical line, using the slider to adjust the horizontal line until it was the same length. A result button was pressed after the estimated measurement was accomplished, and the amount the participant was off by was displayed. This test was repeated for 20 trials. The mean for all differences was calculated. Because some repetitions began with a horizontal line that was larger than the vertical (requiring me to adjust it smaller), and some repetitions began with a horizontal line that was smaller than the vertical line (requiring me to adjust it larger), I also noted the difference in results, and subsequently calculated the means in those subcategories as well.
Results
| Trial Number | Horizontal length/Estimated Vertical length | Actual Vertical length | Error Rate (+=Over, -under) | L= Adjusted line started larger S=Adjusted line started off smaller |
| 104 | 122 | -18 | ||
| 119 | 116 | +3 | ||
| 104 | 107 | -3 | ||
| 111 | 120 | -9 | ||
| 96 | 112 | -16 | ||
| 115 | 117 | -2 | ||
| 108 | 113 | -5 | ||
| 105 | 107 | -2 | ||
| 102 | 124 | -22 | ||
| 10 | 94 | 102 | -8 | |
| 11 | 105 | 108 | -3 | |
| 12 | 107 | 127 | -20 | |
| 13 | 108 | 127 | -19 | |
| 14 | 120 | 109 | +11 | |
| 15 | 92 | 104 | -12 | |
| 16 | 111 | 123 | -12 | |
| 17 | 99 | 115 | -16 | |
| 18 | 104 | 112 | -8 | |
| 19 | 107 | 122 | -15 | |
| 20 | 97 | 106 | -9 | |
| Mean S: 13.92 | Mean for L: 3 | Overall Mean: 9.25 |
Discussion
Results indicate that my difference threshold for the test was 9.25. What I found curious is that when the horizontal line began larger than the vertical line, I was a lot more accurate. In fact, my difference threshold lowered my nearly 11 points, when compared the threshold of the trials where it started out smaller. I was curious about this, and noticed that when I made the line larger, my gaze glanced from left to right, but when I made the line smaller, it went from right to left. If my idea about the processing of the horizontal quicker than the vertical because of reading habits is true, then this may be because of the effect. I could have been more accurate was because I do not read from right to left, therefore my brain took more time to process the information, resulting in a more accurate result. The only way to test this would be to give the tests to literate participants, in specific regions of the world who read from left to right, compared to ones who read right to left, and ones who read from top to bottom.


