Questions attached.
| Unit 3 | [AB204: Macroeconomics] |
 Unit 3 Template
| ||
| Price | Quantity Demanded Per Month | Quantity Supplied Per Month |
| $5 | 6,000 | 10,000 |
| $4 | 8,000 | 8,000 |
| $3 | 10,000 | 6,000 |
| $2 | 12,000 | 4,000 |
| $1 | 14,000 | 2,000 |
|
| ||
| ||
2) Consider supply and demand for Maine lobsters indicated in the following tables to answers questions from a –d below. Suppose that the supply schedule of Maine lobsters is as follows:
| Price of Lobster per Pound | Maine Quantity of Lobster Supplied (pounds) |
| $25 | 800 |
| $20 | 700 |
| $15 | 600 |
| $10 | 500 |
| $5 | 400 |
First, assume that Maine lobsters can be sold only in the United States. The U.S. demand schedule for Maine lobsters is as follows:
| Price of Lobster per Pound | USA Quantity of Lobster Demanded (pounds) |
| $25 | 200 |
| $20 | 400 |
| $15 | 600 |
| $10 | 800 |
| $5 | 1,000 |
Looking at both the schedules of supply and demand, as well as the graph of the demand and supply curve for Maine Lobsters, what is the equilibrium price of lobsters and the equilibrium quantity of lobsters demanded and supplied at that price?
Second, suppose that Maine lobsters can also be sold in France. The French demand schedule for Maine lobsters is as follows:
| Price of Lobster per Pound | Quantity of Lobster Demanded (pounds) |
| $25 | 100 |
| $20 | 300 |
| $15 | 500 |
| $10 | 700 |
| $5 | 900 |
What is the demand schedule for Maine lobsters now that French consumers can also buy them?
c. Using the combined U.S. and French demand schedule, the U.S. demand schedule and the supply schedule, and the graph below, analyze the change in the market for lobsters. What will happen to the price at which fishermen can sell lobster? What will be the final output of lobsters?
d. What will happen to the price paid by U.S. consumers? What will happen to the quantity consumed by U.S. consumers?
3) Atlantis is a small, isolated island in the South Atlantic. The inhabitants grow potatoes and catch fresh fish. The accompanying table shows the maximum annual output combinations of potatoes and fish that can be produced. Obviously, given their limited resources and available technology, as they use more of their resources for potato production, there are fewer resources available for catching fish.
|
| Quantity of Potatoes (Pounds) | Quantity of Fish (Pounds) |
| 1,000 | ||
| 800 | 300 | |
| 600 | 500 | |
| 400 | 600 | |
| 200 | 650 | |
| 675 |
Continue to answer the additional questions found on page 4 below…
Examine the Maximum annual output options table above and the resulting Production Possibility Frontier Graph below and answer questions from a -e.
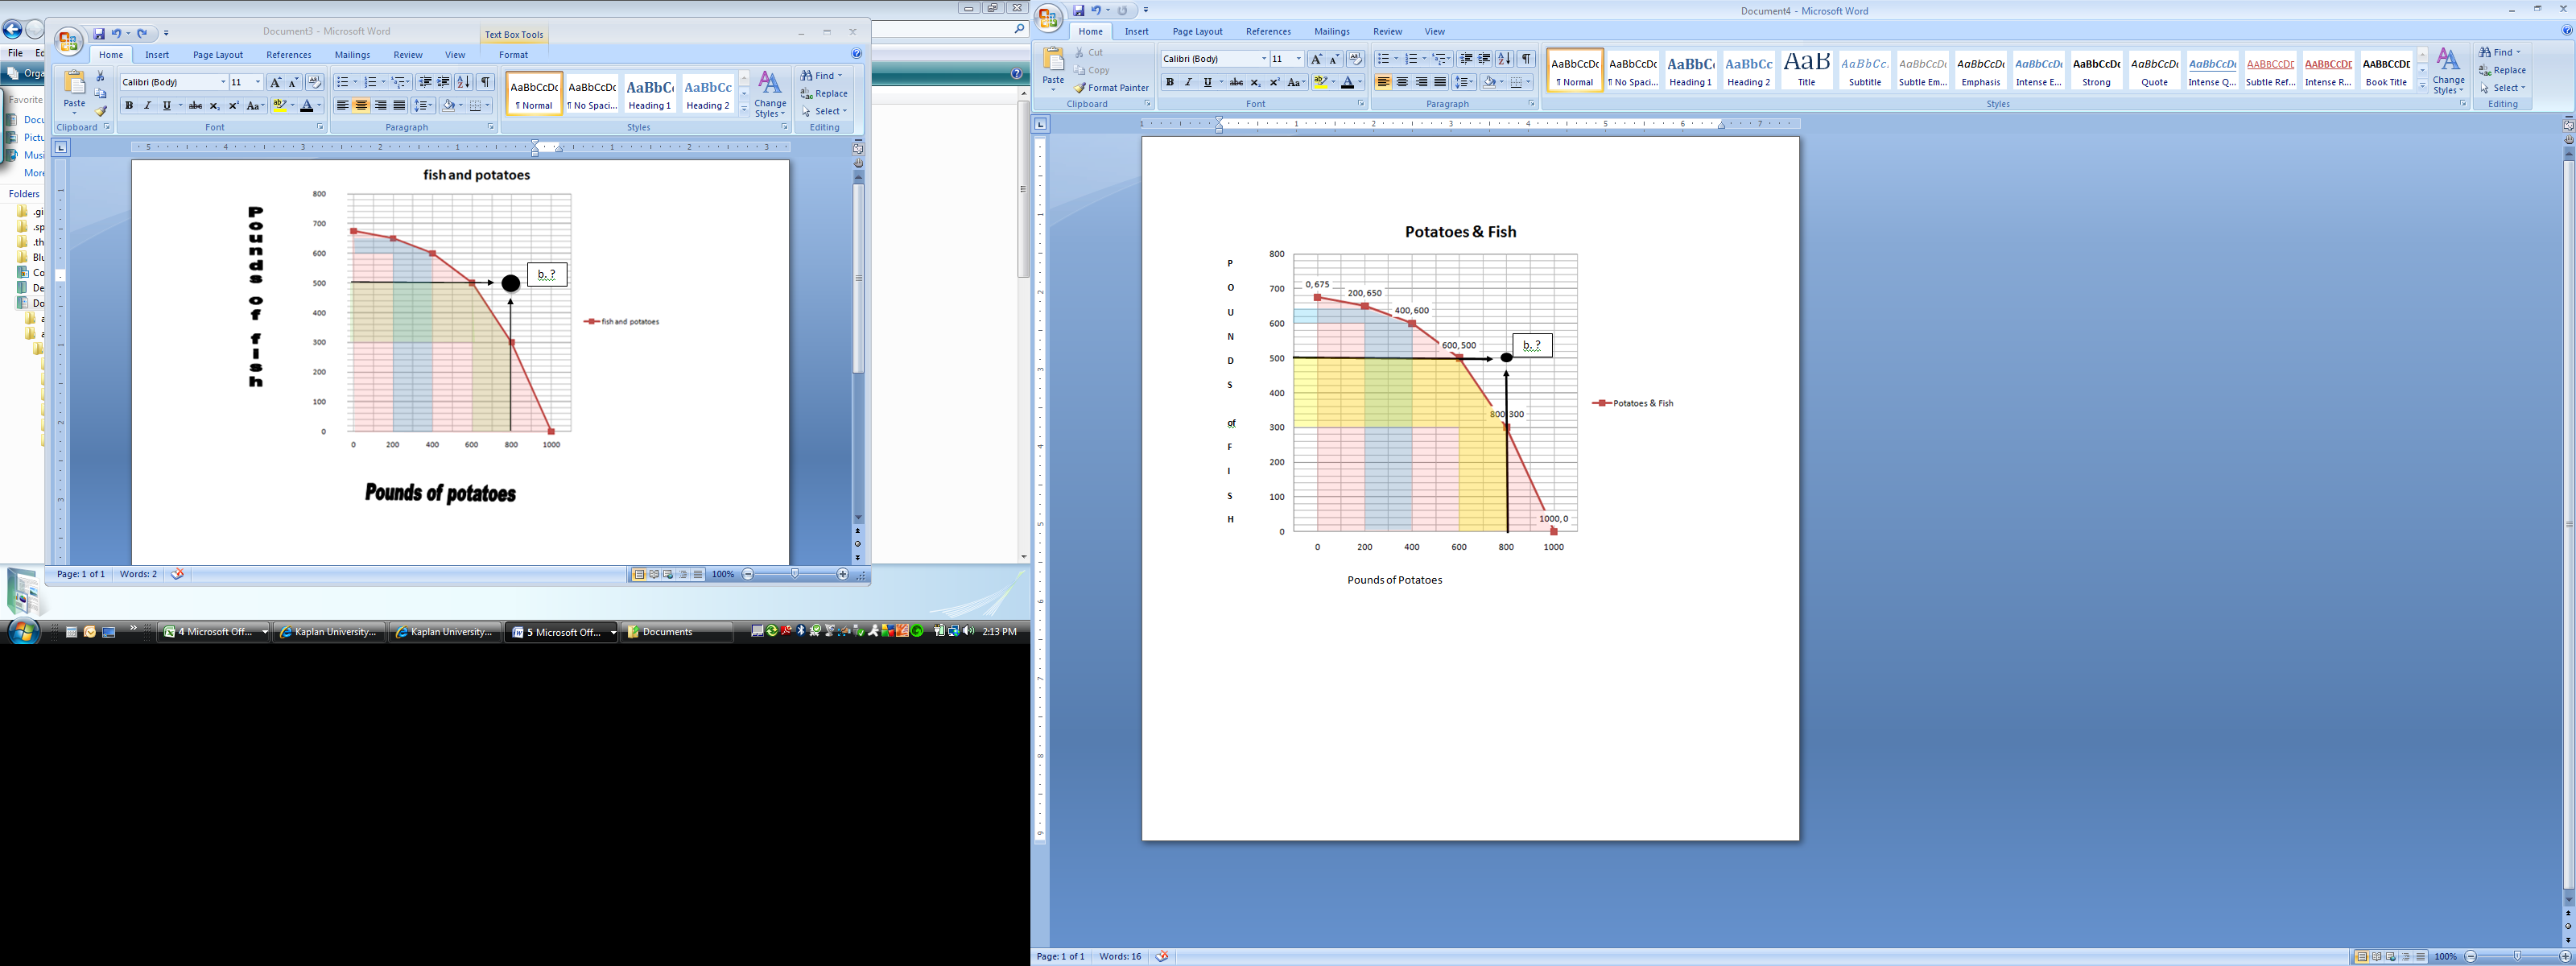
a. Can Atlantis produce 500 pounds of fish and 800 pounds of potatoes? Explain.
b. What is the opportunity cost of increasing the annual output of potatoes from 600 to 800 pounds?
c. What is the opportunity cost of increasing the annual output of potatoes from 200 to 400 pounds?
d. Can you explain why the answers to parts b and c are not the same?
e. What does this imply about the slope of the production possibility frontier?
v.6.9.17 4 of 4


