After reading the reading resources, please refer to the passage on "Law and Order" themes in society and politics. In 3 - 4 paragraphs, please illustrate an understanding of the past manipulation of
Law and Order themes - past and present
After reading the reading resources, please refer to the passage on "Law and Order" themes in society and politics. In 3 - 4 paragraphs, please illustrate an understanding of the past manipulation of the Law and Order theme in politics, and how it may have affected the recent social and political climate or may still affect the forthcoming social and political climate in America.
Note: Please try not to be excessively partisan, as this is not a forum for political opinions.
Reading Resources and Link’s that can be used for reference
Law and Order
International Encyclopedia of the Social Sciences. Ed. William A. Darity, Jr.. Vol. 4. 2nd ed. Detroit, MI: Macmillan Reference USA, 2008. p369-372.
Copyright: COPYRIGHT 2008 Gale, Cengage Learning
Listen
Page 369
Law and Order1962 TO 1965: VIOLENT RESISTANCE TO CIVIL RIGHTS
1965 TO 1970: BLACK MILITANT GROUPS AND URBAN UNREST
LAW AND ORDER IN THE 1968 CAMPAIGN
1972 TO 2007: LAW-AND-ORDER THEMES RECYCLED
LAW AND ORDER AND VIGILANTISM IN AMERICAN LIFE AND FILM
BIBLIOGRAPHY
The term law and order refers to a prominent theme of Richard Nixon’s (1913–1994) successful 1968 campaign for the American presidency. Law and order became a potent campaign symbol for Nixon, and related themes have sometimes surfaced in later Republican presidential campaigns—especially in 1972 and 1988. The term law and order is a political symbol capturing public anxieties about civil unrest, urban riots, black militant groups (which, some charged, fomented violence), and rising crimerates. Later events, such as the violence in the Boston area in response to court-ordered busing, widely publicized crime sprees like the Son of Sam murders in New York City, and continued rising crime rates, stoked fears of societal breakdown during the 1970s and gave law-and-order appeals additional resonance. These developments, sometimes connected with subtle racial appeals, contributed to the erosion of the Democratic Party’s dominant position in American politics after 1968.
1962 TO 1965: VIOLENT RESISTANCE TO CIVIL RIGHTSAfter a period of relative domestic tranquility in the 1950s, the 1960s came as a rude shock to many Americans. Between 1961 and 1964, violent actions by southern whites bent on defending racial segregation became commonplace. Demonstrators at sit-ins and freedom riders, black and white, faced actual or threatened violence and mass arrests on fabricated charges. More violence erupted as federal officials attempted to carry out court-ordered desegregation. When black student James Meredith sought to enroll at (and integrate) the University of Mississippi, thousands of segregationists rioted, resulting in two deaths and forcing President John F. Kennedy (1917–1963) to mobilize thousands of troops to restore order.
As the civil rights movement continued, it was met with more violence. Police in Birmingham, Alabama, deployed dogs and high-pressure water cannons against unarmed civil rights demonstrators in 1963. The murders of National Association for the Advancement of Colored People (NAACP) leader Medgar Evers in Jackson, Mississippi, in 1963 and of three civil rights workers near Philadelphia, Mississippi, in 1964 fed fears of mounting social unrest. A 1963 bombing of a Birmingham black church killed four little girls, and Alabama state troopers attacked unarmed voting-rights marchers with dogs and electric cattle prods in March 1965. These cumulative shocks to the national consciousness were amplified by the 1963 assassination of President Kennedy in Dallas, Texas.
1965 TO 1970: BLACK MILITANT GROUPS AND URBAN UNRESTIn response to white violence against civil rights activists, some black leaders adopted increasingly belligerent rhetoric. The rise of black radicalism was personified in militants like Stokely Carmichael (1941–1998) and H. Rap Brown. As political scientists Donald Kinder and Lynn Sanders noted, the new rhetoric frightened many whites. There was “less talk of nonviolence and more of self-defense; less yearning for integration and more for solidarity and black nationalism; ‘We Shall Overcome’ was replaced by Black Power and ‘burn, baby, burn’” (1996, p. 103). The image of neatly-dressed blacks pummeled by vicious white violence faded, replaced by images of blacks rampaging through city streets, torching cars and buildings and looting stores. The initial trigger for the changing imagery was the August 1965 Watts riot in Los Angeles. As Kinder and Sanders described the Watts riot:
The violence raged unchecked for three days, and three days longer in sporadic eruptions. Blacks looted stores, set fires, burned cars, and shot at policemen and firemen. Before the violence was halted, 14,000 National Guard troops, 1,000 police officers and 700 sheriff’s deputies were pressed into service.… In the end, 1,000 buildings were damaged, burned, looted or completely destroyed; almost 4,000 people were arrested; more than 1,000 were injured seriously enough to require medical treatment; and 34 were dead, all but three of them black. (Kinder and Sanders 1996, p. 103)
Watts was only the beginning, as 1966, 1967, and 1968 each brought more unrest. In 1967, 250 serious uprisings occurred, including the Detroit riots, which killed forty-three people. More disturbances erupted in multiple cities after the assassination of Martin Luther King Jr. in April 1968. As Kinder and Sanders observe:
For one long, hot summer after another, Americans watched what appeared to be the coming apart of their own country. On the front page of their morning newspapers and on their television screens in the evening appeared dramatic and frightening pictures of devastation and ruin: cities on fire, mobs of blacks looting stores and hurling rocks at police, tanks rumbling down the avenues of American cities.… Discussion of the “racePage 370 | Top of Articleproblem” in America … centered on the threat that inner-city blacks posed to social order and public safety. (Kinder and Sanders 1996, p. 103)
In 1968 the Kerner Commission released a report on the civil disturbances, warning that the United States was “moving toward two societies, one black, one white—separate and unequal.” The urban violence and Kerner Commission report created an opening for Republicans to pounce on the law-and-order theme. Republican presidential candidate Richard Nixon blasted the report for “blaming everybody for the riots except the perpetrators of violence,” promising “retaliation against the perpetrators” that would be “swift and sure.” As noted by journalists Thomas Edsall and Mary Edsall, Nixon’s running mate, hard-line Maryland governor Spiro Agnew (1918–1996), summoned black leaders in Baltimore to a stormy meeting where he accused them of cowardice for refusing to renounce black militant leaders like Stokely Carmichael and H. Rap Brown. Speaking of the violence in Baltimore after the King assassination, Agnew charged: “The looting and rioting which has engulfed our city during the past several days did not occur by chance. It is no mere coincidence that a national disciple of violence, Mr. Stokely Carmichael, was observed meeting with local black power advocates and known criminals in Baltimore three days before the riots began” (quoted in Edsall and Edsall 1991, p. 85).
The 1968 Democratic national convention met in Chicago following the June 1968 assassination of Democratic presidential candidate Robert Kennedy. Chaotic scenes of police beating demonstrators in Chicago’s streets and parks echoed the tumult within the convention hall, as party delegates splintered over the Vietnam War (1957–1975). By 1965 almost all American homes had televisions, bringing searing images of one dramatic (and sometimes horrifying) event after another into the public consciousness. The racial subtext to much of the unrest of the 1960s is unmistakable. As Kinder and Sanders note:
The riots opened up a huge racial rift. Fear and revulsion against the violence were widespread among both white and black Americans, but whites were much more likely to condemn those who participated in the riots and more eager for the police and National Guard to retaliate against them. Where blacks saw the riots as expressions of legitimate grievances, whites were inclined to explain them as eruptions of black hatred and senseless criminality.… To many white Americans, then, the civil disorders of the 1960s amounted to an appalling collective mugging. (Kinder and Sanders 1996, p. 104).
Liberals, then, faced the unenviable task of explaining why, after leading the fight to pass major civil rights laws, blacks appeared to be responding not with gratitude, but with annual explosions of violence, looting, and destruction.
As political analyst James Sundquist observes, the potency of law-and-order themes was evident as early as 1966, when Ronald Reagan (1911–2004) easily won the governorship of California after promising to “get tough” on welfare, crime, riots, and student unrest. In October 1966, the Republican Coordinating Committee charged that officials in the Lyndon B. Johnson (1908–1973) administration had “condoned and encouraged disregard for law and order.” In an August 29, 1967, press conference, House Republican leader Gerald R. Ford (1913–2006) proclaimed:
The war at home—the war against crime—is being lost. The Administration appears to be in full retreat. The homes and the streets of America are no longer safe for our people. This is a frightful situation.… The Republicans in Congress demand that the Administration take the action required to protect our people in their homes, on the streets, at their jobs.… There can be no further Administration excuse for indecision, delay or evasion. When a Rap Brown and a Stokely Carmichael are allowed to run loose, to threaten law-abiding Americans with injury and death, it’s time to slam the door on them and any like them—and slam it hard! (quoted in Sundquist 1983, p. 385)
As Sundquist notes, Ford’s statement illustrates that “by 1967, the Republicans were pulling out all the stops” (on the law and order issue). In 1968 “the issue was propelled by so many events that it hardly needed partisan exploitation” (1983, p. 385).
The cumulative effect of civil-rights violence, assassinations, urban rioting and unrest, the tumult at the 1968 Democratic convention, and the comparatively peaceful 1968 Republican convention in Miami was to create a climate unmistakably ripe for Republican law-and-order appeals. Many Americans were shell-shocked by the rising crime rates and domestic violence of the 1960s, amplified by the increasingly controversial Vietnam War, with antiwar demonstrators burning their draft cards and soldiers coming home, some in body bags, others maimed. In May 1970, Ohio National Guardsmen opened fire on antiwar protesters at Kent State University, killing four students and injuring nine. Many Americans sympathized more with the shooting guardsmen than with the dead students—a sentiment captured in Neil Young’s protest song “Ohio” (written immediately after the Kent State shootings and performed by Crosby, Stills, Nash, and Young). Page 371 | Top of ArticleThe song characterized conservative sentiment as celebrating the shootings: “should’ve been done long ago.”
LAW AND ORDER IN THE 1968 CAMPAIGNThe political context in 1968 was clearly ripe for a campaign centering on law and order. The Nixon campaign eagerly seized the opening. Nixon’s selection of Agnew as his running mate sent an unmistakable signal that if elected president he would “crack down” hard on rioters, draft protesters, and others perceived as contributing to or fomenting social and urban unrest. At the 1968 Republican convention, Nixon began his acceptance speech: “As we look at America, we see cities enveloped in smoke and flame. We hear sirens in the night.” Nixon’s speech continued by attacking Democratic-sponsored government programs for the unemployed, the poor, and cities as “reaping an ugly harvest of frustration, violence, and failure across the land.” Nixon’s campaign advertisements, too, reinforced the law-and-order theme. As Kinder and Sanders note:
Nixon’s television advertisements played upon Americans’ fear of crime. While voiceovers pointed to sharp increases in violent crime and blamed the Democrats, the television viewer witnessed scenes of riots and buildings in flames, montages of urban decay, a lonely policeman on the beat, a mugging, crowds taunting the police, faces of anxious and perplexed Americans, and a woman walking alone on a deserted city street as darkness fell. (Kinder and Sanders 1996, p. 226)
After Nixon’s election victory in 1968, Agnew, as vice president, demonstrated a slashing, attack-dog speaking style that further expanded on law-and-order themes. As noted by Sundquist, Agnew toured the country to support Republican candidates, attacking and denouncing “permissivists,” “avowed anarchists and communists,” “misfits,” the “garbage” of society, “thieves, traitors and perverts,” and “radical liberals” (1983, p. 387). This rhetoric is anything but subtle in positioning the Republican Party as representing the masses of “middle America” that abide by society’s rules, are horrified by social violence, and support harsh crackdowns against it—a group that later would be targeted by the appeal of the 1972 Nixon campaign to the “silent majority.” By implication, Agnew sought to position Democrats as representing less savory elements: antiwar radicals, draft-card burners, urban rioters, black militants, hippies, and practitioners of recreational drug use and sexual activity. Agnew’s language, then, expanded the law-and-order theme to imply that Democrats sympathized not only with those who encouraged and practiced crime and violence (i.e., black militants, urban rioters, and draft-card burners), but also with groups that encouraged a more general social permissiveness and breakdown of traditional moral values—that is, permissivists, radical liberals, and perverts. These themes foreshadowed Nixon’s 1972 reelection campaign, which would successfully brand Democratic presidential candidate George McGovern as the candidate of “acid, amnesty, and abortion.”
1972 TO 2007: LAW-AND-ORDER THEMES RECYCLEDSince 1972, explicit law-and-order themes have become less central issues in most campaigns. However, a major exception was the 1988 presidential campaign, when George H. W. Bush portrayed Democratic candidate Michael Dukakis as “soft” on violent crime in a campaign that critics charged appealed to racial prejudices. The campaign featured the story of William “Willie” Horton, a black convict who, released from prison on a weekend furlough (a controversial program supported by Massachusetts governor Dukakis), escaped to Maryland, where he attacked a couple in their home. Republican strategists openly exploited the Horton case. One television advertisement, sponsored by an independent pro-Bush group, showed a sinister and unruly-looking Horton in a mug shot, while an announcer recounted Horton’s crimes, emphasized by the words kidnapping, raping, and stabbingappearing in large print on the screen. Republican strategist Lee Atwater (1951–1991) promised that “by the time this election is over, Willie Horton will be a household name.” Later, he said “the Horton case is one of those gut issues that are value issues, particularly in the South, and if we hammer at these over and over, we are going to win.” As Kinder and Sanders note, Atwater joked to a Republican gathering, “There is a story about Willie Horton, who, for all I know may end up being Dukakis’ running mate.… Maybe [Dukakis] will put this Willie Horton on the ticket when all is said and done” (1996, p. 255).
The 1988 campaign illustrates the political dangers for Democrats of not responding adequately to Republican efforts to brand them as “soft on crime.” Especially in the more conservative South, Democrats have responded by emphasizing crime-fighting credentials and support for the death penalty. Bill Clinton used this formula successfully in his 1992 and 1996 presidential campaigns, and in 2005 Democrat Timothy Kaine won the governorship of Virginia, a conservative state. Kaine successfully fended off Republican attacks on his personal opposition to the death penalty by promising to uphold death sentences handed down by Virginia juries. The law-and-order campaign theme most clearly applies to the 1968 presidential campaign. However, it has spawned similar campaign themes, usually pursued by Republicans Page 372 | Top of Articleeager to portray Democrats as “soft on crime,” with varying degrees of success.
LAW AND ORDER AND VIGILANTISM IN AMERICAN LIFE AND FILMParadoxically, the appeal of law-and-order themes has potentially contributed to citizen vigilantism at times. American history offers numerous examples of citizens “taking the law into their own hands.” White southerners’ lynchings of blacks are but one example of vigilante actions defending a social order that is anything but admirable. In 1898, for instance, the majority-black port city of Wilmington, North Carolina, was consumed by a race riot in which an unknown number of blacks (probably dozens) were murdered and hundreds more banished by an armed white mob bent on establishing white supremacy in local and statewide politics. Historian Timothy Tyson described the actions and motives of riot instigators as follows:
On Nov. 10, 1898, heavily armed columns of white men marched into the black neighborhoods of Wilmington. In the name of white supremacy, this well-ordered mob burned the offices of the local black newspaper, murdered perhaps dozens of black residents—the precise number isn’t known—and banished many successful black citizens and their so-called “white nigger” allies. A new social order was born in the blood and the flames, rooted in what News and Observer publisher Josephus Daniels, heralded as “permanent good government by the party of the White Man.” (Tyson 2006)
Tyson added that the riot “marked the embrace of virulent Jim Crow racism” nationwide. The Red Shirts, a paramilitary arm of the then-white-supremacist Democratic Party, had rampaged across North Carolina before the 1898 election, disrupting black church services and Republican meetings, and attacking blacks, who leaned Republican. These violent, vigilante actions were justified as necessary to preserve a cherished social order, white supremacy, by any means necessary. That their actions were neither lawful nor orderly probably never crossed the minds of either the Red Shirts or the white participants in the Wilmington riot.
Similarly, some anti-immigration activists along the U.S.-Mexican border have launched vigilante efforts to deter would-be undocumented immigrants from crossing from Mexico into the United States. Ranch Rescue is one such group, which styles itself as a defender of U.S. borders and private property rights against what it calls “criminal aliens” and “terrorists” out of a belief that law enforcementis unable or unwilling to act appropriately toward these ends. In 2005 Ranch Rescue founder Casey Nethercutt lost his southern Arizona ranch to satisfy a court judgment levied against him and other Ranch Rescue members for seizing and traumatizing two Mexican immigrants (Pollack 2005). The Wilmington riots and the Ranch Rescue case illustrate behaviors that are probably driven by the conviction that to restore law and order—or a cherished social goal—requires violating law and order at least temporarily.
The vigilantism inherent in the actions of the Wilmington riot instigators and Ranch Rescue members is also reflected in some American films. In movies like the Death Wish series starring Charles Bronson (1921–2003) and The Punisher (1989 and 2004), vigilantism is celebrated, with a curious and unmistakable implicit message: exacting revenge sometimes requires violating law and order—even abandoning the rule of law altogether. Law and order, then, has morphed from an often-potent political symbol from the 1960s through the 1980s to a notion that some action films celebrate violating—but whose impact in real-world politics is largely blunted.
Source Citation (MLA 8th Edition)
"Law and Order." International Encyclopedia of the Social Sciences, edited by William A. Darity, Jr., 2nd ed., vol. 4, Macmillan Reference USA, 2008, pp. 369-372. Gale Virtual Reference Library, http://link.galegroup.com/apps/doc/CX3045301310/GVRL?u=umd_umuc&sid=GVRL&xid=3e5f0073.
Ecology of Crime
RALPH B. TAYLOR
Encyclopedia of Crime and Justice. Ed. Joshua Dressler. Vol. 2. 2nd ed. New York, NY: Macmillan Reference USA, 2002. p573-582.
Copyright: COPYRIGHT 2002 Macmillan Reference USA, COPYRIGHT 2006 Gale, COPYRIGHT 2007 Gale, Cengage Learning
Listen
Page 573
ECOLOGY OF CRIMEEcological variation in crime, delinquency, and fear of crime are examined in this entry. The discussion examines macro-level variations at the regional and city-levels, this considers community level variations.
City and regional and city differencesDocumented variations in local crime or arrest or offender rates date to the mid-nineteenth century. In France, for example, officials and researchers were particularly interested in seeing the effects of their new criminal laws. They looked at how many people were being arrested, imprisoned, flogged, or hung in different parts of the country. Researchers like Guerry and Quetelet found spatial variation in the rate at which people were being arrested for crime in different parts of the country (Brantingham and Brantingham).
The specifics of the patterns observed by these researchers still hold true when looking at spatial differences in crime rates today. In France, a few administrative subdivisions had very high rates, a few had very low rates, and many places were in between. Differences between regions were stable over time. In the United States, the South has been the highest violence region for quite some time K. Harris). Nevertheless, rates have varied widely in a range of locations. For example, the rate for people accused of crimes against persons for the period 1826–1830 ranged from 1 in 2,199 on the Mediterranean island of Corsica to 1 in 37,014 in Creuse in central France. In the United States reported violent crime rates at the state level in 1998 varied from 1,023 per 100,000 in Florida to 87 per 100,000 in North Dakota (Maguire and Pastore, eds. Table 3.118).
Patterns for violent and property crimes differ. Violent crimes were highest in rural areas of the U.S. South; in France during the 1990s property rates were highest in the industrialized, northern urban departments. During the same period in the United States, states with high rates of property crime were found not only in the South (Florida), but also in the far West (particularly in Arizona, Nevada, and New Mexico) (Maguire and Pastore, eds., Table 3.116). In short, such patterns of local crime rates have proven durable in research over the past one hundred fifty years. Researchers in Britain during the mid-nineteenth century found comparable patterns at the county and local level (Glyde).
By the end of the nineteenth century, environmental criminologists had discovered the following fundamental features about spatial and temporal distributions of crime:
There is spatial variation in rates of reported crime, and that variation shows up no matter the level of detail. The variation is higher in some places than in others, regardless of whether one looks at the large-scale units, such as counties, or at areas within counties, like different towns or different cities, or different sections of a city (Brantingham et al.).
The spatial variation was persistent. Areas that were high on offense or offender or delinquency rates might stay high for a decade, or even generations, regardless of the physical changes made in or the population changes occurring in the locale.
Sometimes the spatial patterns are not what one might expect. High violence in rural areas represents one case in point. In 1980, seventy-one out of the one hundred highest homicide rate counties in the United States were rural counties (Kposowa et al.).
American criminologists have worked hard to explain the higher rates of violence in the South. Some have suggested that historically rooted and racially linked subcultural variations are linked to higher violence (e.g., Messner and Rosenfeld). Studies since the early 1990s, however, focus not on race but on a culture of honor originating in historical patterns of independent pig farming in the Deep South (Cohen and Nisbett). The famous Hatfield-McCoy feud, for example, started over a pig.
A more micro-scale view on subcultural differences has emerged since the mid-1970s. This view builds on Louis Wirth's theory of urbanism (1938), which sought to explain differences in how people acted in cities as compared to nonurban locations. City size, density, and heterogeneity of populations were expected to affect residents' social networks, mood, and community involvement.
The subcultural theory of urbanism does not address crime per se, but rather unconventional behavior that deviates from broader societal norms. Both criminal behavior and delinquency could presumably be considered unconventional behaviors. The theory contains four propositions:
Larger places develop more and more specialized subcultures than do less populous ones, and are therefore more culturally heterogeneous.
More populous places develop not only more distinct subcultures but also more intense subcultures than less populous places.
Between-group contact leads to mutual influence. Diffusion from more unusual to more typical groups is likelier the larger the atypical subculture and is therefore more likely in urban places.
The more urban the place, the higher the rates of unconventionality relative to the wider society, because a) larger places generate more diverse and more specialized subcultures; and b) critical mass and intergroup friction are likelier in larger places (Fischer, 1995, pp. 545–546).
Subcultural theory is an ecological theory because it is about impacts of places, usually cities. This model could explain differences in crime and delinquency linked to city size, as well as urban versus suburban versus rural differences in offending rates and delinquency rates.
Researchers have tried to explain the causes of city-to-city (or metro area-to-metro area) differences in crime rates, the net of regional differences, concentrating largely either on economic or racial differences. A range of theorists link crime and related outcomes to structural inequality. Models differ in the aspects of inequality addressed, forces giving rise to inequality, outcomes of interest, or the different processes whereby inequality leads to crime or related outcomes. All these models presume a conflict perspective.
From the mid-1850s to the 1950s large U.S. cities witnessed increases in industrial manufacturing, and increasing needs for disciplined, cooperative workers. These shifts resulted in increasing orderliness and routine in white and ethnic urban neighborhoods, the improvements in the latter neighborhoods taking place as immigrants became assimilated into the workforce. African Americans, in response to strong demand during World War II, and decreased segregation at least in some cities in the 1960s, also joined these occupational groups, with concomitant shifts in their neighborhoods. This was followed, from about 1965 onward, by deindustrialization and the economic deconcentration of manufacturing jobs from central city locations. Particularly hard hit were African American communities because those workers were the last group permitted entry to the industrial jobs, and the group whose ability to move to the new jobs was lowest.
Inequality theorists describe how in the last thirty years industrial restructuring and the shift to post-industrial economies have further accelerated processes leading to increased inequality across urban communities (e.g., Hagan and Peterson). These shifts have markedly affected urbanites' mood (Fisher, 1982) and their economic well-being. More specifically, since the 1960s poverty has increased rapidly in urban centers, with African Americans being heavily represented among the urban poor. These rapidly increasing concentrations of poverty have transformed low-income, urban communities. In many communities welfare-dependent, female-headed households have become the norm.
Concentration effects linked to high poverty levels may explain between-city differences inPage 575 | Top of Articlecrime rates as well as between-community differences. In extremely poor, predominantly African American urban communities, fundamental transformations take place in neighborhood life when poverty rates climb past 39 percent following class-selective out-migration by lower-middle to middle income African American households (Wilson). The broader commitment to the formal economy falters, as does commitment to mainstream values. Neighborhood institutions disappear, their customer base severely eroded. The joblessness itself triggers a range of social problems, including more disorderly street life, drug use, and crime. Concentration effects are economic in origin, and can operate in the context of a stratified labor market.
As neighborhoods become increasingly disorderly and socially isolated, outsiders avoid them and outside employers become more wary of hiring residents from these stigmatized locations; those remaining become increasingly socially isolated, making it even more difficult to network and get back into the mainstream economy. These represent concentration effects emerging from the extremely high density of unemployment, problems and disadvantage in these locations, not from the racial composition of the locales themselves. Recent ethnographies confirm such isolation in predominantly African American and some predominantly Hispanic communities (e.g., Bourgois).
As neighborhoods become increasingly disadvantaged one might expect crime to go up for any number of reasons. Four possible functional dynamics have been proposed at the city level, focusing on racial inequality, that could be driven by the concentration effects described by W. J. Wilson (Messner and Golden). One path expects more widespread "social disorganization/anomie" and thus more violence as racial inequality increases. Ties across communities will be poorer, and commitment to norms will weaken. Wilson would say that commitment to the formal economy and associated values would weaken. A second pathway ("relative deprivation/frustration-aggression") expects that increasing racial inequality makes the disadvantaged groups experience more relative deprivation; these sentiments increase offending rates among members of those disadvantaged groups. So violence rates just among the deprived groups should increase. A third pathway ("relative gratification/reduced aggression") looks at the reverse; as racial inequality increases those in the better-off contingent, that is, whites, should have lower offending rates because they are less deprived and more advantaged. Finally, an "opportunity effect" model suggests that as concentrations of extremely poor and often African American groups increases in cities, and chances for meaningful contacts between various racial groups decrease, interracial violence rates should drop. Blacks and whites simply have fewer chances of interacting with each other as racial inequality and isolation increase.
In addition to crime being an outcome influenced by inequality, if it increases as disadvantage increases, it can spur further concentration effects, including neighborhood depopulation, as selective out-migration increases.
An alternate view on racial inequality and crime emerges from D. Massey's work on segregation (Massey and Denton). His historical perspective suggests that virtually all ethnic groups except African Americans have moved out of segregated, inner-city, impoverished locations, and successfully assimilated. His work also highlights the constraints on African Americans migrating out of severely distressed neighborhoods. Crime's ability to cause neighborhood depopulation may be limited by poor African Americans continuing to move in, and limitations on the African Americans attempting to leave the distressed neighborhoods. For Massey, concentration effects emerge from long-standing racial attitudes and practices, not economic shifts.
Many researchers addressing city and metropolitan area changes work within a "new urban sociology" perspective, and the processes they highlight may help explain increasing crime rates from the late 1960s through the early 1990s in many large cities, and differences in crime rates between cities and suburban 1ocations (Gottdiener, The New Urban Sociology). These analysts point out:
The international political economy has significant effects on urban, suburban, and rural life.
A fundamental transformation of metropolitan structures took place in the last thirty to forty years as hierarchically arranged, central-city-dominated metro areas serving outlying suburbs and rural areas were transformed into highly differentiated, economically deconcentrated polynucleated metropolitan structures.
The transformation has produced highly uneven development, as capitalist growth always does, resulting in more radical spatial separations of different races and classes, reflected, for example, in increasing numbers of gated communities, hypersegregated "excluded ghettos," and "totalizing suburbs" where all residents' needs can be met in a small area (Marcuse); there is increasing economic, social, and political separation not only within the cities but also in the broader metropolitan areas.
As homogeneity in many city neighborhoods has decreased, so too have shared local ties. These shifts make for weaker local political cultures. In the language of systemic control theory, the increased heterogeneity and decreased local ties weaken informal local ties or parochial control, and the strength of public control as well. In the language of routine activity theory, fewer committed informal place managers may be present, or it may be harder to place managers to decide who belongs where.
The recent crime drop seen in many larger cities starting around 1990 or 1992, and continuing into the mid or even late 1990s has drawn considerable attention. Some have suggested the decline is due to better, "smarter" policing (e.g., Bratton), others have suggested it was due to declining gun use among juveniles, which may have linked to declining activity of crack cocaine-drug dealing activities, but the causes may vary from city to city (Fagan et al.).
Variation at the community and streetblock levelsWithin cities, there are safe neighborhoods and crime-ridden ones; even within crime-ridden neighborhoods, there are safe street-blocks—the two sides of the street bounded by the two cross streets—and dangerous ones. What do these patterns look like, and how are they to be explained? Most of the work in this area has examined neighborhood-to-neighborhood variations, although some have considered block-to-block differences (Taylor et al., 1984). Further, the bulk of the work has focused on social, economic, and cultural factors, although physical design features including landuse mix and design features linked to territorial functioning are relevant as well.
Many of the explanatory models used here have relied on a family of loosely associated perspectives on attributes of community including social problems, called human ecology (Hawley, 1981). These views seek to explain geographic variation in those attributes by concentrating on features of the immediate surround, whether that be streetblock, neighborhood, or city sector, and the connections between that surround and the broader geographic arena. Three fundamental premises of this family of perspectives are that place-to-place differences in racial and ethnic composition, socioeconomic status, and stability and family structure arise from broader dynamics at work in the larger spatial context; that those place-to-place differences in turn simultaneously instigate and reflect local, face-to-face and small group social dynamics; and that those local dynamics link to a wide range of crime-related outcomes such as delinquency rates, local crime rates, and fear of crime and related reactions to crime.
In 1925 Sir Cyril Burt, a British psychologist, published The Young Delinquent. He looked up the addresses of boys and girls reported as "industrial school cases" in London. Then he looked up where they lived, and made up a delinquency rate. Delinquency rates were highest in the areas right near the central business district (CBD), and declined as one moved outward. In addition, the areas of highest delinquency were also the areas of highest poverty. Burt concluded a relationship existed between social class and delinquency. Furthermore, even though his data were cross-sectional, he concluded that the relationship was causal. Later research of individuals continues to find connections between delinquency and social class (e.g., Hindelang et al.). But this does not mean the relationship holds at the individual level—to presume so is to commit the ecological fallacy.
Sociologists at the University of Chicago in the first half of this century investigated a wide array of urban social problems: delinquency, petty theft, dance halls, gambling, and immigrants' "culture shock," to name a few.
Two of these sociologists, Clifford Shaw and Henry McKay, investigated delinquency. They collected data not only from Chicago, but from other cities as well: Philadelphia, Richmond, Cleveland, Birmingham, Denver, and Seattle. Shaw and McKay went to juvenile courts and collected data about the number of juveniles who had been adjudicated delinquent. They were able to construct delinquency rates by posing the question, for every one thousand youths living in the community between the ages of nine and fifteen, how many had officially been adjudicated delinquent by the court? They also constructedPage 577 | Top of Articlerates using other spatial units, such as one square mile areas.
As had Burt, Shaw and McKay found higher delinquency rates closer to the center of the city, the central business district (CBD), than they did further away from the center city. Indeed, they observed that the further away a community was from the center city, the lower its delinquency rate. This pattern appeared not just in Chicago, but in each of the other cities they examined as well.
As is often time in cities, spatial differences link to social and economic differences. At the time Shaw and McKay were writing, populations were increasing in older cities. This "engine" of city growth led to economic differences across communities at varying distances from the city center. More specifically, because of city growth the CBD was expanding to keep up and "serve" the growth in the broader city. This, of course, had happened in the past as well. Given this historical and ongoing pattern, more desirable locations were always at the outer edge of the expanding city. Land use closer to the city center was often converted to nonresidential land uses such as large industries, stockyards (in the case of both Chicago and Baltimore), and large commercial concerns.
Not only were more central locations less desirable per se, they also were the sites of older housing. For the most part, older housing is also more worn-out housing. Given these less desirable locations, and the more dilapidated housing stock, housing in these areas tended to be cheaper. As prices shifted so too did the types of households living there. Poorer households were more likely to locate close to the city center, where housing was cheapest. Further away one would find housing occupied by low wage or blue-collar workers. More distant, one would find middle-income households. And finally, even further away, in an outer-city or perhaps in a more distant suburban location, one would find the highest income households.
These economic differences in house values and rents were exacerbated by the threat of invasion from the expanding CBD. People were constantly trying to "trade up" in their housing anyway, and move to a slightly better location. But since the CBD was growing at the time, residents from each inner zone would be "invading" the zones just beyond. In the innermost zone, the residential areas were in transition, converting from residential to commercial or industrial. This zone was thus labeled the transition zone. These impending changes led those residents who could get out to do so, those who owned properties there to stop maintaining them, and to maximize their return by converting these units to apartments. Left living in these sites were low-income individuals and households that could not afford housing anywhere else. The residential environment there was rather chaotic.
Linked to the economic differences were ethnic ones. It is generally true, with some exceptions (Massey and Denton), that the newest immigrants to a city make up predominantly lower-income households. This is still true today in large U.S. cities even though the immigrant groups in question are different now than they were then. Consequently, many members of these immigrant groups, when they first arrived in U.S. cities, were limited to central-city, low-income neighborhoods where housing was cheap.
In short, Shaw and McKay's basic model was an economic one; location-based dynamics were set in motion based on the socioeconomic status of the group in question. The physical dilapidation of an area matched the segregation of the population on an economic basis. Given the ethnic heterogeneity in these more dilapidated areas, and shorter tenures, supervision of juveniles was more lax, willingness to reprimand others' children was weaker, and delinquency was higher (Maccoby et al.).
The spatial pattern described above has shifted markedly in large cities in the post–World War II era:
Centralized city planning increased in the years following World War II. Urban renewal initiatives destroyed vast tracts of older, worn-out housing in older cities, and replaced them with large numbers of public-housing communities. Many of those displaced from older "slum" locations lost many friends in the process (Frey; Gans). The siting of these communities influenced the surrounding locations, sometimes destabilizing them.
Suburbanization increased as federal highway initiatives, especially under President Dwight D. Eisenhower, provided drastically improved road access to cities.
But for a number of reasons, the suburbanization of African American households proceeded more slowly than the suburbanization of white households (Massey et al.). Consequently, the larger, older cities themselves became increasingly African American in composition.
Passage of various fair housing laws, and related court cases in the 1950s and 1960s increased African Americans' access to housing. In cities where African Americans had historically been limited to specific sections of the city, pent-up demand resulted in rapid racial turnover in large numbers of neighborhoods.
Since about 1970 additional changes in cities have further modified the spatial pattern described above. Most importantly, large numbers of manufacturing jobs have left, migrating from central city locations first to southern locations, then abroad, making it increasingly difficult for those with relatively low education levels to secure employment. Receiving more media attention than has perhaps been warranted given the relatively small number of locations where it has occurred, central city neighborhoods in many urban locations have become partially gentrified. Lower-income households were partially replaced by middle or upper income households that moved in and improved the housing stock.
Given these shifts in cities since around 1950, one would not necessarily expect to see the same spatial pattern for delinquency rates, or crime rates, as were reported for the years prior to World War II. Nonetheless, one still might expect community characteristics to link to these outcomes in a similar way.
At the heart of the human ecological model of offense and delinquency rates is a constellation of processes: social disorganization. Its opposite is collective efficacy. A locale is socially disorganized if several things are true: residents do not get along with one another; residents do not belong to local organizations geared to bettering the community and thus cannot work together effectively to address common problems; residents hold different values about what is and what is not acceptable behavior on the street; and residents are unlikely to interfere when they see other youths or adults engaged in wrongdoing (Bursik, 1988).
By contrast, if collective efficacy is high in a locale, residents will work together on common, neighborhood-wide issues, will get along somewhat with one another, and will take steps to supervise activities of youth or teens taking place in the immediate locale. These outcomes link to organizational participation ("Do you belong to the local improvement association? Does your neighbor?"); informal social control ("If your neighbor saw a young teen spray painting the side of a building about midnight, would he do something about it?"); and local social ties based on propinquity ("How many of the people living on your block do you know by name? How many can you recognize when you see them? If you needed to borrow a tool, could you do so from a close neighbor?").
Researchers have suggested that three levels of resident-based control shape the level of social disorganization versus collective efficacy in a locale (e.g., Bursik and Grasmick). Private control refers to dynamics within families and between close friends. If Junioretta extorts school lunch money from two other neighbors while walking to school, and her parents find out about it, will they punish her appropriately? Parochial control refers to supervisory efforts made by neighbors and acquaintances. If a neighbor while gardening out back sees Junioretta walking down the alley threatening two other children and demanding their lunch funds, will she grab Junioretta by the ear and walk her home to her dad, or will she, the neighbor, just shrug her shoulders and go about planting her tomatoes? How much parochial control is exercised varies from block to block in a neighborhood. Public control refers to the neighborhood leadership's ability to garner resources from public and private agencies outside the neighborhood. Can the community association's leaders effectively lobby city hall for resources for neighborhood improvements and programs? For example, can they obtain funding for more school crossing guards on well-traveled routes leading to and from the local school? Can they work collaboratively with other neighborhood organizations on issues affecting their part of town?
High delinquency rates occurred in low income, ethnically heterogeneous, unstable locations because those ecological characteristics made social disorganization more likely. In lower income locales residents' concerns are more spatially circumscribed than in higher income locales (Taylor, 1988). In some low-income neighborhoods residents only feel safe within their own dwelling. As ethnic heterogeneity increases, it becomes increasingly difficult for residents to "decode" what other residents are doing. Increasing intercultural distance and perhaps language barriers make it harder to figure out what is going on. As instability increases, residents have less time to get to know their neighbors;Page 579 | Top of Articleit is harder to figure out who "belongs" on the block and who does not belong.
In other words, these structural attributes of the community either increase or decrease the chances that residents would exert some control over what took place in their community; these dynamics in turn would influence outcomes like delinquency, the local offending rate, and local victimization rates. Note that social disorganization mediates the impacts of community structure on the outcomes. It represents a crucial link connecting community fabric with the outcomes. It does appear, however, that community fabric; although it affects social disorganization, continues to exert an independent influence on outcomes like delinquency, victimization, and offending (Veysey and Messner). In short there are structural causes of these community-level differences beyond differences in social disorganization or collective efficacy.
Social disorganization is likely to be strongest, and collective efficacy weakest, when a community is in the midst of an invasion-succession cycle. In such a cycle, a neighborhood "turns over," with one type of resident replacing another. In the midst of such a cycle residents are unlikely to know their neighbors, and the local population will be quite heterogeneous in makeup.
Neighborhood residents are always changing: people move in and people move out. But if the two rates are roughly matched, and if the volume is relatively modest, and if those moving in are sociodemographically similar to those moving out, then the neighborhood is stable (Ahlbrandt and Cunningham). But if the volume of in-movers increases beyond a relatively low rate, and if the in-movers are sociodemographically dissimilar from the current residents, then over time the population in the locale would change. There would be an "invasion" of a new type of resident, and eventually that new type of resident would "succeed" the older type of resident.
Such cycles could be seen most clearly in the 1960s and 1970s in urban neighborhoods where racial succession took place, and white populations were replaced in relatively short order by African American households. Many expected that gentrified neighborhoods would follow the same cycle; but they have not. Even in some of the most reclaimed neighborhoods, higher-income, recent in-migrant owners mingle on the street with lower-income, longer-term, renters (Lee and Mergenhagen). The invasion-succession cycle can "stall" before completion. In these partially gentrified locations violent and property crime rates can be higher (Covington and Taylor).
Shaw and McKay's initial cross-sectional findings have been supported again and again (e.g., Baldwin, 1975). Studies routinely find the following.
Delinquency and offense and offender rates are higher closer to the city center than farther away, although there are exceptions, and although each of these outcomes maps differently onto spatial structure (Baldwin and Bottoms). Delinquency and offense and offender rates are higher in lower income, and/or less stable, and/or more predominantly African American communities (K. D. Harries, 1980), although differences have arisen regarding the relative contribution of each attribute, and the appropriate labels to apply to some of the dimensions of urban community structure examined (Sampson and Lauritsen). For example, some have argued that relative socioeconomic status in a locale—how poor the residents are, or how poor they are relative to those residents in adjoining neighborhoods—is the most important community correlate of high violent crime rates (Land et al.). Others argue that family disruption, and/or family structures that are less stable or provide less supervision of the locale are the most important (Sampson and Lauritsen). This debate is not about to end anytime soon.
In essence, the human ecological theory focuses on a community's position in the larger urban fabric, and how that position changes over time. It is its relative status, stability, and racial composition, and the changes in those features, that determine changes in offense, offender, and delinquency rates.
In a series of studies using Shaw and McKay's data on delinquency and census characteristics in Chicago, from the 1930s through the 1960s, more rapid community shifts connected with more rapid changes in the delinquency rate (e.g., Bursik, 1986). The ways in which neighborhoods changed varied across each decade, as did the relative contribution of different types of neighborhood changes to changes in delinquency. What was happening each decade was conditioned by the historical context. But despite these variations in each decade, community changes linked to delinquency changes in the expected ways. For example, increasing unemployment and increasing nonwhite racial composition were both tied to increasing delinquency rates.
Page 580 | Top of Article
Changes in neighborhood fabric are linked not only to changes in delinquency but also to changes in violence. A Baltimore study of changes in the 1970s found that neighborhoods shifting more dramatically on stability or status experienced more sizable shifts in violence as well (Taylor and Covington, 1988). Which particular feature of neighborhood fabric proved important depended on the type of violent crime examined.
Briefly put, one of the major extensions of social disorganization theory in the last two decades has been the application of the model to ecological changes over time. As the theory predicts, neighborhoods whose composition is changing more rapidly, relative to the other neighborhoods in the city, are more likely to experience increasing delinquency or crime problems. Even if the rapid change is in a "positive" direction, such as gentrification, increasing crime may accompany the shift (Covington and Taylor, 1989).
The features of neighborhood structure only predispose a neighborhood to have more or less social disorganization. Key studies, in Britain and in the United States, highlight the central importance of social disorganization versus collective efficacy processes (e.g., Sampson et al.). These processes mediate the impacts of structure on outcomes like offending and victimization, but structural impacts like differences in status and stability continue to exert some impacts on the outcomes separate from these processes (Versey and Messner).
Responses to crime like fear of crime are also ecologically patterned and social disorganization versus collective efficacy processes likewise appear to mediate the impacts of structure—status, race, stability—on the outcomes (Taylor, 1996). Similarly, rapid structural change affects these processes that in turn affect fear of crime (Taylor and Covington, 1993). Generally these studies show that although there are differences from study to study, neighborhood structure—especially status and stability—affects these outcomes in ways anticipated by the human ecological model, and that indicators of social disorganization versus social efficacy at least partially mediate the relationship.
In the last few years a related set of models concentrating on social and physical aspects of disorder in neighborhoods has emerged. The model terms these features incivilities. Physical incivilities include abandoned cars, weed-filled lots, vacant houses, and unkempt properties and yards. Social incivilities, although viewed by some as just misdemeanor crimes, include vandalism, rowdy groups of unsupervised teens, fighting neighbors, public drug use or drug sales, and the like. These models come in different forms, but the version drawing the most attention has suggested that incivilities can contribute independently, over time, to increasing neighborhood crime, neighborhood structural decline, and increased neighborhood fear (Skogan). Longitudinal analyses, however, show that incivilities do not change uniformly in locations (suggesting they are indicative of separate and somewhat unrelated problems) and the independent impacts of incivilities on neighborhood level outcomes are far weaker than the theory anticipates, although some predicted impacts do emerge (Taylor, 2001).
Policy impacts of work on the ecology of crime have been several. Since the early 1900s, city programs have targeted some of the areas where youths are at greatest risk of delinquency. More recently more refined geographic analyses of crime have concentrated enforcement efforts on crime "hot spots"—locations where police are called repeatedly to deal with crimes or disturbances. These targeted interventions can under some conditions have some deterrent or preventive impacts. Concern about incivilities has led to community policing initiatives targeted at these problems in the beliefs that reducing these problems will reduce crime. One recent longitudinal work suggests this enthusiasm may be misplaced (Taylor, 2001).
Interest in this work in the future will increase due in large part to increased availability of mapping software for locating crime and community data geographically, and allowing sophisticated spatial analyses (Weisburd and McEwen). Increasing availability of multilevel models also facilitate work in this area (Bryk and Raudenbush). In addition, after having fallen out of favor in the 1960s and 1970s, interest in the ecology of crime has increased in recent years and sociologists generally are discovering "neighborhood effects" in a range of topic areas. Nonetheless, one of the biggest factors holding work in this area back is the lack of routinely updated data that includes community characteristics, police calls for service and crime data, and social disorganization versus collective efficacy indicators for a number of neighborhoods in a number of cities. Hopefully future efforts of an inter-universityPage 581 | Top of Articleconsortium will work on such an effort.
RALPH B. TAYLOR
Source Citation (MLA 8th Edition)
TAYLOR, RALPH B. "Ecology of Crime." Encyclopedia of Crime and Justice, edited by Joshua Dressler, 2nd ed., vol. 2, Macmillan Reference USA, 2002, pp. 573-582. Gale Virtual Reference Library, http://link.galegroup.com/apps/doc/CX3403000101/GVRL?u=umd_umuc&sid=GVRL&xid=caa681dd.
Societal Stratification
ARCHIBALD O. HALLER
Encyclopedia of Sociology. Vol. 4. 2nd ed. New York, NY: Macmillan Reference USA, 2001. p2864-2874.
Copyright: COPYRIGHT 2001 Macmillan Reference USA, COPYRIGHT 2006 Gale, COPYRIGHT 2007 Gale, Cengage Learning
Listen
Page 2864
SOCIETAL STRATIFICATIONSocietal stratification phenomena are the relatively enduring, hierarchically ordered relationships of power among the units of which society is composed. The smallest units are adults, gainfully employed men and/or women, nuclear families, or sometimes extended families or households. Such units are ordered from highest to lowest in terms of power: political power, acquisitional power, the power of prestige, and the power of informational standing. Everybody experiences stratification every day, although a person often notices it only in the sense that some people seem better or worse off than he or she is. Social thinkers, powerful people, and revolutionaries have always been especially concerned with stratification.
Page 2865 | Top of Article
Secure knowledge of the varying forms stratification structures may take is important because of the effects those structures have on many aspects of human experience, such as people's dreams of a better life, efforts to improve their situations, strivings for success, fear of failure, sympathy for the less fortunate, envy of others' good fortune, and even feelings about revolution.
A complete understanding of stratification requires several kinds of knowledge: first, what stratification structures consist of and how they vary; second, the individual and collective consequences of the different states of those structures; and third, the factors that make stratification structures change. This article reviews current thinking on the first of these elements.
HISTORY: CLASSICAL THEORYTwo different lines of thought inform modern theory on societal stratification. One is classical theory; concerned with political power and privilege, it employs historical evidence. The other is the empirical tradition, which deals with systematic data on stratification as it exists contemporarily. Present-day theory of the behavior of stratification phenomena can be traced to Karl Marx's challenge to the manufacturing and financial elites of his day. Behind his concerns and those of the working class for which he was Europe's chief spokesman for many years lay the great economic and political upheavals of the eighteenth and nineteenth centuries.
The American and French revolutions and their aftermath culminated in legislation that made adults in many countries equal before the law. The related wave of emancipation of slaves and serfs in Europe and the Americas was also part of the intellectual environment of that day. Of more direct relevance to Marx's thinking was the rise of trade and the factory system, along with the growth of cities and the expansion of wealth. Marx saw urban populations dividing into two opposed classes. The capitalist class employed the workers; owned the workplaces, machines, and tools; and had ready access to large amounts of money for investment. The capitalists were opposed by their employees, the working class, who had nothing to offer but their time and energy. In Marx's view, these two classes differ in terms of power and privilege: power because capitalists give orders that workers must accept, privilege because capitalists take the surplus (whatever is left after paying the cost of production) for themselves and their investments, leaving for workers only the wages that the market for labor forces capitalists to pay. Actually, Marx was interested in how these classes came into being and the conflicting interests they expressed. He did not write specifically on societal stratification as it is understood today.
Later writers on stratification, attempting to elucidate or contradict Marx, spelled out more complex sets of stratification dimensions. Weber (1946, 1947) saw power as the general factor basic to the enduring inequalities referred to as stratification. Sometimes, like Marx, he used categories whose underlying dimensions had to be elucidated by others. Party, class, and status groups were his key concepts. When these concepts are dimensionalized (reconstituted as variables), "party" is seen to be legitimate political influence, "class" is seen to express a hierarchical order of economic status, and the variable underlying "status groups" is seen to be their hierarchical order according to the degree of social honor. In other writings, Weber saw education as a stratification variable. In still others, he often wrote about authority, or legitimate superordinate and subordinate relations of power. Weber said nothing about how people are distributed in these dimensions or, of course, about how and why such distributions vary.
More thoroughly and precisely than Marx or Weber, Sorokin (1927) crafted the bases of modern theories of societal stratification. He distinguished political stratification, economic stratification, and occupational stratification. The first is a dimension of political power, and the second a dimension of the power of income and wealth. He left the dimensionality of occupational status unclear, sometimes implying that it was authority, sometimes privilege, and sometimes intelligence. Much of Sorokin's theory of societal stratification remains intact. First, he noted that all societies are stratified to some degree, a position widely accepted today. Second, empirical researchers continue to refine and elucidate his concepts of occupational status and occupational mobility. Third, in this connection he asked why occupational stratification exists and concluded that organized communalPage 2866 | Top of Articlelife requires mechanisms and people to coordinate essential activities and that such coordination demands and rewards unusual ability. This view, now called the functionalist hypothesis, has been elaborated and disputed ever since. Fourth, he held that the degree of stratification varies from society to society and over time within given society: Stratification, he said, is in "ceaseless fluctuation." Sorokin specified several ways in which stratification structures may vary. The whole structure may rise or fall; the top may rise or fall, changing the degree of inequality; and the "profile," or the shape of the distribution, may vary. Similarly, the rate of individual upward or downward mobility may vary, and whole strata may rise or fall.
Sorokin thus presented a theory that specified (1) the general dimensions by which people are stratified within a society, (2) some ways in which the distributions of people on those dimensions may vary, and (3) why stratification exists. Also, he held such structures to be in ceaseless change.
The latest work in the classical tradition is that of Lenski (1966). His key dimensions are power, privilege, and prestige, in that order of importance. Beyond this, Lenski offers three main ideas. First, both functional theory and conflict theory, its opposite, are partly right. Society's needs demand coordination, implying the existence of strata based on power or authority and implying a degree of consent on the part of many of those whose activities are organized by others. However, conflict results from that control: Authority is often abused and, even when it is not, may be misunderstood. Second, inequalities are mostly those of power, with inequalities of privilege and prestige following mostly as consequences of them. Third, the degree of inequality, which is seen as a single phenomenon encompassing the rate of mobility and the distance between strata, increased with the growing comprehensiveness and complexity of society until the Industrial Revolution, after which it declined. According to Lenski, the main forces driving change in the degree of inequality are the size of the surplus of production and, undergirding this, the march of technological efficiency.
Lenski is clearly in the classical tradition in his concern with power and privilege and dependence on historical evidence. To some extent, he echoes Sorokin's concern with variations in stratification structures through an emphasis on the degree of inequality. He provides a compelling treatment of the issue of conflict versus societal necessity in regard to the existence of stratification. He uses historical evidence effectively and systematically to mark variations of inequality in agrarian and horticultural societies. However, Lenski's emphasis on two main, all-encompassing aspects of stratification—power (his key criterion variable) and inequality (used to denote the way in which power and its concomitants are apportioned)—forces too many separately varying stratification phenomena into too few molds. This problem becomes critical in industrial societies, where stratification dimensions vary independently of one another.
HISTORY: THE EMPIRICAL TRADITIONAs has been noted, this tradition of research on stratification is concerned with the here and now. This line of research has developed excellence in the measurement of the hierarchical positions of small demographic units within larger stratification structures. Although newer than the classical tradition, it has a long history. Several more or less independent status-measurement devices were formulated in the 1920s and 1930s. Most were concerned with either the prestige of the breadwinner's occupation or the quality of the home. They tended to share certain assumptions: that stratification consists of a single hierarchy, in the early days usually called social class; that one or two different scales are sufficient to test hypotheses concerning social class; that social class positions can be distinguished by direct observation and/or interviews with someone who knows the status holders; that routines can be devised that allow one to assign valid and reliable numerical scores to each status holder on each of the scales used to measure social class; that the unit to be scored is the household, which can be one person or several persons living in a single home; and that it is the whole unit that is to be scored, whether with data on the home or data on the head of the household. Many of these devices became obsolete because they had to be recalibrated for each new community or type of community to which they were applied. Those that survived—education and occupational status—did so because they providePage 2867 | Top of Articlecomparable scores across large populations, such as nations.
Of the two main survivors, educational attainment is easy to measure: the exact number of school years successfully completed from none through sixteen, seventeen, eighteen, and so on. Measurement of occupational status is another matter. Two systems are currently in use. Occupational prestige ratings assume that each person in a given occupation shares the prestige most people attribute to that occupation. Occupational prestige scales have been constructed for many countries (Treiman 1977). Occupational socioeconomic status indices (SEI) are scales that use education and income to measure the status level of each occupation and then attribute to an individual the resulting score of her or his occupation. In the United States, Treiman's prestige scale and the SEI provide highly correlated occupational scores (Featherman and Hauser 1978).
Regardless of the original intent of such scales—to measure positions in what once was believed to be the only stratification hierarchy—the two variables educational attainment and occupational status are also appropriate for use with the classical theorists' multidimensional view of stratification.
A SYNTHESISThe current synthesis was carried out by stratification theorists who were both sensitive to the concerns of classical theorists with power and privilege and steeped in the empirical tradition. Thus, they brought the classical theorists' concern with political power, economic power, and social honor (Weber), including Sorokin's occupational status and Lenski's prestige, together with the empiricists' concern with education and occupational status (overlapping Weber, Sorokin, and Lenski) and with quantitative measurement and analysis.
Svalastoga's Social Differentiation (1965) appears to be the first statement of the synthesis. Svalastoga indicates the centrality of four dimensions of status: political, economic, social (mostly occupational), and informational (mostly educational). He calls attention to structural variations through his "parameters": the degree of inequality, the correlation among dimensions, and the degree of permeability (intergenerational circulation mobility or movement up and down the hierarchies). Duncan (1968) both accepted and clarified Svalastoga's synthesis. His list of "scales of reward or status" provides a good outline of the large number of variables that should be measured to achieve a full-scale determination of people's levels on each status dimension. Also, he divides three of Svalastoga's four dimensions into two categories each. He, like Svalastoga, then lists three ways in which the structure of stratification variable may vary. The first is the degree of inequality. The second is called "rigidity of inequality" or "status crystallization," which is the same as Svalastoga's "correlation." The third is "rigidity of stratification," which is Svalastoga's "permeability" turned upside down.
Like Sorokin's and others' positions, Haller's (1970) statement of the synthesis assumes that stratification to one degree or another exists in all societies at all times. Revised slightly in this article, this form of the synthesis holds that there are two classes of dimensions of stratification. The first are "content"— or power—dimensions, after Weber: the capability of a given unit to elicit from others behavior promoted by the first unit, with such power having been routinized by coercion or consent. Agreeing conceptually but not always terminologically with the classical writers, this expression of the synthesis posits political power, economic power, and the power of prestige as universal dimensions of power. For civilized societies, it adds the power of years of formal education.
This position thus posits legitimatized political influence (including authority) as the dimension underlying Weber's "party," Sorokin's "political stratification," Lenski's "power," and Svalastoga's "political status." It posits Weber's "class," Sorokin's "economic stratification," Lenski's "privilege," and Svalastoga's economic status as referring to the same set of hierarchical phenomena: access to goods and services—the economic dimension of a stratification structure. From Weber, it takes the variable of social honor; from Sorokin and modern occupational status researchers, that of occupational stratification; from Svalastoga, that of social status; and from Lenski, that of prestige. From the empirical tradition, it takes the measurement of occupational power ("status"). All these elements are seen as referring to a third homogeneous set of hierarchical phenomena:Page 2868 | Top of Articlethe power of respect or deference attributed to a unit because of that unit's participation in a social category (such as an occupation) that has a specific level of evaluation by a society—the prestigedimension of societal stratification. As has been indicated, from Svalastoga and Duncan, with much support from the empiricists and also some from Weber, it takes informational power as a content dimension of a stratification structure, with education as its main indicator.
At the general level, each power dimension is of course presumed to be applicable in some form to all human societies as far back as human communal life can be traced. It is the exact expression of each dimension and the relationship among the dimension that vary across time and place. For entire contemporary societies, the main expressions of each dimension seem to be the following: for the political power dimension, political power, a variable researchers cannot yet measure despite its centrality in classical theory; for the economic dimension, income (occasionally wealth), a variable of concern to those in the empirical tradition; for the prestige dimension, occupational status in either of its two main forms of occupational prestige ratings (Treiman 1977) and occupational socioeconomic index scores (Featherman and Hauser 1978); and for the informational power dimension, educational attainment level in terms of years of formal schooling successfully completed. Thus, in recent years it has become apparent that for today's societies, the main variables of the empirical tradition have central places among the content dimensions of the classical tradition. Income, occupational status, and education are the theoretically defensible variables most readily available to measure three of the four classical content dimensions.
Like Sorokin's, Svalastoga's, and Duncan's, Haller's formulation of the synthesis specifies several structural dimensions, with each one held to be applicable to every appropriate measure of each content dimension. The three structural dimensions of Svalastoga and Duncan are included: degree of inequality, status crystallization, and degree of status inheritance. Two others from Sorokin are included, although they are modified to fit today's understanding. One is the general level or central tendency, and the other is a division of Sorokin's concept of profile into two concepts: mode structure and skewness. Although calculated from data on small units, each structural dimension applies to the society as a whole. Although logically they are partly dependent on one another, each one makes a unique contribution to an understanding of stratification. Each appears to be amenable to statistical description. Each is applicable to every indicator of the standing of every small unit (say, family) in the society. Valid measures of each content dimension taken at one point in time on a generalizable sample of the population of small units of that society would provide a complete description of the stratification structure of that society at that time. Successive measures would provide a complete description of the evolution of that society's stratification structure over time, thus providing a general idea of the variations in the degree of stratification in that society. Each applies to comparisons over time or among societies.
General Level. As Sorokin realized, the levels of structural dimensions may rise and fall as wholes. That is, the average economic, political, prestige, and informational standing of small units changes over time. These rises and falls may be seen in changes in the central tendency—say, the arithmetic mean or the median value—of the standing of small units. The rises and falls of the central tendency of any one of these dimensions do not necessarily follow the same pattern as those of another. Average economic, prestige, and informational power may increase, for example, while average political influence falls. This could happen in a society where a development-oriented dictatorship reduces citizen political participation while increasing levels of income, raising prestige by upgrading the occupational structure, and increasing access to education. Indeed, the economic, prestige, and educational levels of the populations of the more developed democracies have increased almost consistently since World War II, though this may not always be said for dictatorships. Also, raising the level of the occupational structure is exactly what some researchers mean by upward structural mobility, the case in which almost everyone is carried upward by changes in the economy that eliminate low-skill jobs while adding specialized jobs.
Degree of Inequality. The distances among the small units of a society may increase or decreasePage 2869 | Top of Articleover time. This, so to speak, stretches the positions on the power dimensions apart or squeezes them together. The statistical term for this is the degree of dispersion. A number of measures of dispersion exist, such as the standard deviation (or its square, the variance), the range, the semi-interquantile (or quintile, decile, etc.) range, the share distributions, and the Gini, Theil, and Kuznets coefficients. There are two basic types of inequality: absolute and relative. Absolute conceptions assume that the metric on which the degree of inequality is measured is fixed so that as, say, real income per capita grows, the dollar difference between the mean of the top 10 percent and the mean of the bottom 10 percent of the small units may increase while each is rising above its previous level, with the slope of the top rising faster than is the slope of the bottom. For income, a proper description of these phenomena would be "changes in the size distribution of income." Absolute inequality and its changes are sometimes published. Much more often published are the share distributions of income. For any society at any time, share distributions take the total amount of, say, income as a constant 100 percent (or 1.00) and determine the degree to which the whole amount, regardless of its absolute size, is evenly or unevenly divided among the population. These distributions include the percentage of all income held by the top X percent and the bottom Y percent of the population. Or, as in the case of the Gini, Theil, and Kuznets coefficients, they use values ranging from 1.0 to zero, in which 1.00 is the maximum degree of inequality and zero is complete equality. Viewed at one point in time in a single society, measures of relative inequality are useful, but for comparison among societies or across time in the same society, they may be misleading. In fact, for many years the share distribution measures of the income of the American people remained essentially unchanged while the size distribution inequality increased dramatically (U.S. Department of Commerce 1980). This was the case because real per capita income was increasing rapidly. The greater the degree of inequality, the greater the degree of stratification.
Crystallization. It has long been recognized that a stratification structure may tend toward or away from monolithicity, in which the different power dimensions merge into a single hierarchy or tend to be in partially separate hierarchies. At one extreme, the position of a small unit on any one of the dimensions can be found by knowing its position on any other dimension. In other words, if the four content dimensions are perfectly correlated, those in lofty positions on one dimension also will be in lofty positions on all the other dimensions, while those in humble positions on one will be in similarly low positions on any other. At the opposite extreme, a unit's position on a given content dimension is irrelevant to its position on any other. In the real world, any two or three might be highly interrelated, all might be moderately intercorrelated, and so forth. For obvious reasons, Svalastoga called this structural dimension "correlation." Others have called it "status crystallization." Note that crystallization levels and forms may be summarized better by a method called factor analysis than by the correlations themselves. Factor analysis can show which sets of content variables tend to vary together in a population and which do not. It also can help determine which are the dominant dimensions and which are of lesser importance in a given stratification structure. For example, it appears that the former Soviet stratification structure was dominated by the political dimension; the American, by the economic dimension. Factor analysis of the correlations of the content dimensions could indicate whether these beliefs are true. The greater the degree of crystallization, the greater the degree of stratification.
Status Inheritance. Status inheritance is the degree to which people's level on a given content dimension is controlled by that of their parents. It is exactly the obverse of circulation mobility: A high degree of power position inheritance implies a low degree of circulation mobility. The basic statistical summary of this phenomenon is either the correlation coefficient (r) or the coefficient of determination (r2) of the power dimension positions of offspring and their parents. (The r2 tells how much one variable is determined by the others.) The greater the degree of status inheritance, the greater the degree of stratification.
Sorokin's Profile. Every variable has a socalled distribution, a shape that appears when the number of scores (the frequency) is plotted against the value of scores. Much statistical theory today assumes that real-world distributions conform to certain mathematical shapes. The bell-shaped "normal" curve is the one most often used. For distributionPage 2870 | Top of Articleof income, the "log normal" curve, with which the distribution of the natural logarithm of the individual amounts forms a normal curve, is often employed. Stratification researchers often take it for granted that the distributions of power dimensions are either normal or log normal, but there is no sociological reason to assume this. The shape of the distribution of a content dimension is precisely what Sorokin meant by his term "profile." Lacking the data and concepts to proceed further, he simply called the real-world shapes of these distributions their profiles. Today we can see that there are two aspects of each profile: mode structure and skewness.
In strikingly underdeveloped societies, almost everyone is concentrated at the very lowest values of economic, political, occupational, and educational power: extremely poor, utterly uninfluential, of low prestige, and illiterate. Above those people, their "betters" are arranged in rank order, with a wide range in which the few people who are above the bottom dwindle up the line to a handful of individuals of lofty standing. Each such distribution would have a very low mode (or distinct cluster of cases) and median (where half of the cases are higher and half are lower) and a higher arithmetic mean, with a sharply skewed tail. In somewhat more developed societies, such distributions, instead of yielding bell-shaped or log normal curves, might show multiple modes, with many people concentrated around a fairly low point, quite a few concentrated around a point a bit higher, a few concentrated toward the top, and after that a sharp skewing up to the very few at the top. The consequences of such forms for the lives of the people involved are no doubt great. For example, if in a certain society almost everyone is destitute, the few who are more or less well to do are highly visible. Even if the wealthy were really not far above the others, everybody would think of that society as being highly stratified. If in another society people are bunched together at several points along a hierarchy, thus forming multiple modes, or discrete classes, those in each mode might come to consider themselves members of a special class in opposition to those concentrated at another mode. Thus, the exact forms of profiles are essential to a description of a society's stratification structure. Theoretically, these forms have substantial consequences for many stratification-dependent behaviors.
Profile: Mode Structure. Mode structure refers to the number, size, and location of distinct modes on the distribution of each content variable. In polymodal structures, the more pronounced the modes, the greater the degree of stratification.
Profile: Skewness. Several statistical devices exist to mark the degree of skewness. The greater the level of skewness, the greater the degree of stratification.
ILLUSTRATIONSData by which to measure and compare stratification structures are exceedingly difficult to obtain. A complete description at a specific point in time requires well-measured, valid indicators of four power dimensions, one or more for each dimension. For each indicator, several measurements must be made: The average level, the degree of absolute and relative inequality, the degree and factor-analytic forms of the crystallization of the whole set of indicators of the power dimension, the degree of power position inheritance, and the distributions of each one must be plotted to indicate its mode structure and measure its skewness. Describing such an overall structure requires the construction of 24 or more different indicators of structural dimensions. These indicators have to be based on representative, societywide samples large enough to permit the recording of small differences, as in the case of the few people at the upper end of a skewed distribution. The study of variations in the structure of stratification demands that comparable measurements be taken on the same variable at different times and in different places. In itself, the requirement of comparability is extremely severe when one is making comparisons among societies with different cultures or over long periods of time within the same society.
Exploratory work of this sort has been conducted on data provided by Brazil. The data were collected on a national probability sample of households in 1973 and are available for all employed men and women in the households sampled. These people are the "small units" of the descriptive analysis presented below. Brazil is a particularly good place in which to conduct such exploratory research for two reasons: It is a large countryPage 2871 | Top of Articlewhose regions are markedly different from each other in terms of development, and it has only one language and culture. The first factor makes it feasible to test for structural variations of stratification associated with development levels, treating regions as societies; the second eases the problem of comparability.
As was indicated earlier, it is not currently feasible to obtain measures of the political power dimension in Brazil or anywhere else. However, there is widespread agreement that income is a proper measure of the economic status dimension, that occupational status instruments based on the average education and income of each occupation are proper measures of the prestige dimension, and that education is a similarly appropriate measure of the informational status dimension. These data are available for some of the parameters that would have to be assessed to obtain a complete description of the regional-development variations of the Brazilian stratification structure in 1973.
Here one is comparing sharply different development regions. The stratification structures of three of Brazil's socioeconomic development (SED) macroregions in 1970 were delineated by obtaining multiple-item, factor-weighted SED scores on that nation's 360 official continental microregions and plotting their levels on the map of Brazil (Haller 1983). This showed the following five macroregions: the Developed South (median SED = 78 on a scale of zero to 100), the South's Developing Periphery (median SED = 54), the Undeveloped Amazonia (median SED = 32.5), the Unevenly Developed Northeast (median SED = 31), and the Underdeveloped Middle North (median SED = 13).
Obviously, this article cannot reproduce each one of the structural dimensions for each SED macroregion for men and for women. Instead, it provides a few key illustrations for three of the regions: the Developed, the Developing, and the Underdeveloped.
Variables routinely used as indicators were formulated to measure three of the four stratification content dimensions: education in years successfully completed, occupational status scores (composed of canonically weighted scores based on the education and income of each occupation), and annual income in 1973 U.S. dollars.
The illustrations are based on regularly employed men and women 15 to 65 years of age. All such persons who lived in the three regions under comparison and were part of the sample have been included. The numbers of sample members vary sharply by region and by sex. The Developed South is much more populous than the other two regions, and about three times more men than women are employed. The largest of the six gender-by-region subsamples thus consists of men in the South: over 40,000 (see Table 1). The smallest consists of women in the South's Developing Periphery: over 2,500.
Let us begin with the profiles (see Figure 1), graphs that have been sketched to show the shape of the stratification structures for men and for women as they appear in the three regions. There are two reasons for paying close attention to these curves. First, they show power relations among the people. The presence of multiple modes shows the existence of discrete and potentially opposed classes. Both the mode structure and the marked skewing indicate a high degree of stratification for each sample. Second, the fact that these distributions diverge sharply from normal or log normal curves shows that the numbers, that is, the data presented in Tables 1 and 2, are at best approximate because the shapes of the distributions affect their meaning.
The curves show the following:
Multiple modes are exhibited by both men and women in 11 of the 12 graphs pertaining to the developed and developing regions. The exception is distribution of women's income in the developing region.
For the two most developed regions, comparable curves show just about the same mode structure. In these regions, education tends to be bi- or trimodal and occupational status tends to be at least trimodal. Among men and among women in the developing region, income also exhibits multiple modes. In the underdeveloped region, the shape of the curves is markedly different form that of the others. The curves in this region show a heavy concentration of both men and women at the bottom of each indicator variable,Page 2872 | Top of Articlethough some of the region's six graphs show the formation of small second and sometimes third modes at high status levels. The apparent conclusion is that the underdeveloped area exhibits a relatively high degree of equality at the very bottom of the Brazilian stratification structure. This is precisely the opposite of the thinking among many observers of Brazil, who believe that inequality is greater in the underdeveloped region (perhaps because of the glaring visibility of the tiny stratum at the top).
Each curve shows a high degree of skewness. That is, the highest positions are held by a tiny proportion of the people, and on the whole, as the tail of the distribution lengthens, the higher the level, the tinier the percentage of the people.
In every case, the main modes are the one or two at the bottom, where most people tend to be concentrated.
Almost every graph shows a tendency for one or two smaller modes to appear toward the middle of the distribution. For education, this occurs at around grade 12. For occupational status it is about 50 units, or the level of office clerks, primary school teachers, and the like. For income, it is about $2,000 to $3,000 per year, or a monthly wage between $160 and $250.
There may be a tiny mode near the top of the educational and occupational status distribution in the more developed regions.
For occupational status and income, women are more concentrated toward the bottom than are men.Page 2873 | Top of Article
![After reading the reading resources, please refer to the passage on "Law and Order" themes in society and politics. In 3 - 4 paragraphs, please illustrate an understanding of the past manipulation of 1]()
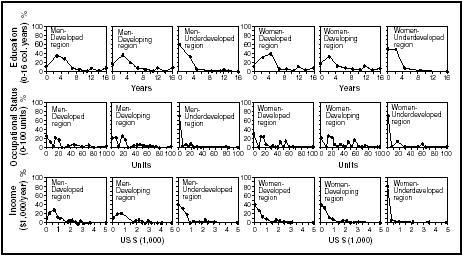
Figure 1. Illustrative Variations of Brazilian Regional Stratification Profiles, by Development, Employed Persons Age 15–65, 1973
SOURCE: See Table 1 for definitions and sample sizes.
Clearly, the main regional variations in profile are between the two more developed regions and the underdeveloped region.
In terms of mode structure, the more developed areas seem more stratified than does the underdeveloped area.
In terms of skewness, it appears that the underdeveloped area is more highly stratified.
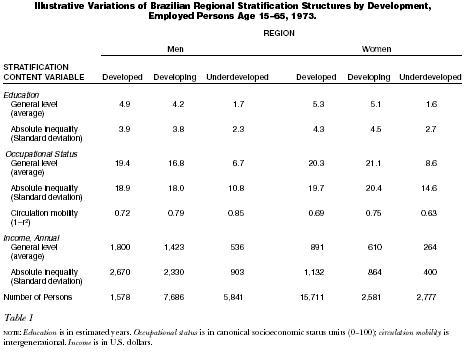
Table 1
| Table 1 | ||||||
| Illustrative Variations of Brazilian Regional Stratification Structures by Development, Employed Persons Age 15–65, 1973. | ||||||
|
| REGION | |||||
|
| Men | Women | ||||
| STRATIFICATION CONTENT VARIABLE | Developed | Developing | Underdeveloped | Developed | Developing | Underdeveloped |
| NOTE: Education is in estimated years. Occupational status is in canonical socioeconomic status units (0–100); circulation mobility is intergenerational. Income is in U.S. dollars. | ||||||
| Education | ||||||
| General level (average) | 4.9 | 4.2 | 1.7 | 5.3 | 5.1 | 1.6 |
| Absolute inequality (Standard deviation) | 3.9 | 3.8 | 2.3 | 4.3 | 4.5 | 2.7 |
| Occupational Status | ||||||
| General level (average) | 19.4 | 16.8 | 6.7 | 20.3 | 21.1 | 8.6 |
| Absolute inequality (Standard deviation) | 18.9 | 18.0 | 10.8 | 19.7 | 20.4 | 14.6 |
| Circulation mobility (1–r2) | 0.72 | 0.79 | 0.85 | 0.69 | 0.75 | 0.63 |
| Income, Annual | ||||||
| General level (average) | 1,800 | 1,423 | 536 | 891 | 610 | 264 |
| Absolute inequality (Standard deviation) | 2,670 | 2,330 | 903 | 1,132 | 864 | 400 |
| Number of Persons | 1,578 | 7,686 | 5,841 | 15,711 | 2,581 | 2,777 |
Data on the general levels and absolute inequality levels of the three content dimensions are presented in Table 1. For occupational status, the degree of circulation mobility also is presented. The general level rises with development for all three variables, except for the occupational levels of women in the developing region, whose status is slightly higher than that of women in the developed region. Again, with two exceptions among women in the developing region, the higher the level of development, the greater the degree of absolute inequality. Echoing what was gleaned from the graphs, the general level and the absolute inequality levels of the underdeveloped region are markedly lower than those in the other areas. Finally, among men, the higher the level of development, the lower the degree of circulation mobility. Women show no trend in this regard.
Evidence regarding structural crystallization is presented in Table 2. Among men, the higher the level of development, the higher the degree of crystallization. Among women, the same trend may be present in the data, but with one small inconsistency.
CONCLUSION This article has attempted to describe the contemporary synthesis of classical and empirical traditions of sociological thought concerning societal stratification, with special emphasis on what may be learned about ways to describe variations in stratification structures. It also presents some illustrations showing how indicators of some of the structural dimensions vary across development regions among employed men and women inPage 2874 | Top of Article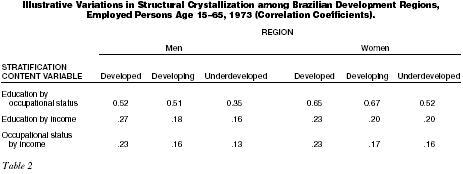
Table 2
| Table 2 | ||||||
| Illustrative Variations in Structural Crystallization among Brazilian Development Regions, Employed Persons Age 15–65, 1973 (Correlation Coefficients). | ||||||
|
| REGION | |||||
|
| Men | Women | ||||
| STRATIFICATION CONTENT VARIABLE | Developed | Developing | Underdeveloped | Developed | Developing | Underdeveloped |
| Education by occupational status | 0.52 | 0.51 | 0.35 | 0.65 | 0.67 | 0.52 |
| Education by income | .27 | .18 | .16 | .23 | .20 | .20 |
| Occupational status by income | .23 | .16 | .13 | .23 | .17 | .16 |
Brazil. In general, these indicators show that the more highly developed a region is, the more stratified it is.
Measuring stratification variations among societies is an immense task because of the number of variables that must be studied and because of differences in culture, language, and social organization among peoples. Still, at both the individual and societal levels, the effects of structural differences of stratification are among the most perplexing of this age and perhaps of all ages. For this reason, understanding how and why stratification structures vary and specifying the consequences of such differences are worth the considerable effort required.
Source Citation (MLA 8th Edition)
HALLER, ARCHIBALD O. "Societal Stratification." Encyclopedia of Sociology, 2nd ed., vol. 4, Macmillan Reference USA, 2001, pp. 2864-2874. Gale Virtual Reference Library, http://link.galegroup.com/apps/doc/CX3404400365/GVRL?u=umd_umuc&sid=GVRL&xid=f3374c36.
Marginalization
International Encyclopedia of the Social Sciences. Ed. William A. Darity, Jr.. Vol. 4. 2nd ed. Detroit, MI: Macmillan Reference USA, 2008. p598-599.
Copyright: COPYRIGHT 2008 Gale, Cengage Learning
Listen
Page 598
MarginalizationBIBLIOGRAPHY
Marginalization comprises those processes by which individuals and groups are ignored or relegated to the sidelines of political debate, social negotiation, and economic bargaining—and kept there. Homelessness, age, language, employment status, skill, race, and religion are some criteria historically used to marginalize. Marginalized groups tend to overlap; groups excluded in one arena, say in political life, tend to be excluded in other arenas, say in economic status. Concern with marginalization is relatively recent. As the advance of democratization and citizenship swell the ranks of those “included” in the social order, the plight of those with limited access to the franchise and without rights or at least enforceable claims to rights becomes problematic.
Our discussion focuses on two main issues. First, what are marginalizing processes and how do they operate? Second, why are so many of the same groups—women, ethnic groups, religious minorities—marginalized in a variety of situations and institutions? Major approaches to marginalization are represented by neoclassical economics, Marxism, social exclusion theory, and recent research that develops social exclusion theory findings.
Neoclassical economists trace marginalization to individual character flaws or to cultural resistance to individualism. Their explanations of poverty stress the notion of the residuum, defined as those “limp in both body and mind.” This residuum—the term was made famous by the Page 599 | Top of ArticleCambridge economist, Alfred Marshall—will only work when forced to do so. Generous social policies encourage its members to stay out of the labor force. To explain why some groups are found disproportionately in the residuum, economists sometimes cite the presence of a “culture of poverty,” which although adapted to alleviate the worst effects of poverty in fact reinforces it.
In contrast, Marxists see marginalization as a structural phenomenon endemic to capitalism. For Marx, the “reserve army of the proletariat,” a pool of unemployed or partially unemployed laborers, is used by employers to lower wages. Together with déclassé elements, the most impoverished elements from the “reserve army” form the bases for the lumpenproletariat—in Marx’s time, a motley conglomeration of beggars, discharged soldiers, prostitutes, and vagabonds. Marx also noted the presence of ethnic minorities, such as the Irish, in the “reserve army.” He attributed the composition of the reserve army of labor and thus the lumpenproletariat to capitalist efforts to divide the working class along ethnic lines.
Although strongly influenced by Marxism, contemporary social exclusion theory stresses the importance of social networks and symbolic boundaries. Studying the economic recovery of the late 1970s, French sociologists noted that some groups—particularly migrants and youth—benefited relatively little from renewed growth. They concluded that sustained unemployment leads to poverty, which in turn leads to social isolation, including the breakup of families and the financial inability to fully participate in popular culture. Shorn of kin ties and cultural associations, the unemployed have difficulty finding a job and eventually become unemployable.
Current research has led to modifications of social exclusion theory. States and kin networks can play a significant role in moderating the effects of prolonged unemployment. Generous Dutch and Danish welfare states keep the unemployed out of poverty. In Italy and Spain the tendency of all unmarried adult children, including unemployed adult children, to remain in households with members who have ties to labor markets moderates social isolation. Less generous welfare states and the relatively early departure of adult children from households leaves the unemployed in France, Germany, and the United Kingdom especially susceptible to social isolation. Everywhere, immigrant workers, who do not receive the full benefits of the welfare state and whose families are often not integrated into job markets, remain marginalized.
Recent work by American sociologist Charles Tilly further stresses the importance of economic structures and social networks to marginalization. For Tilly, capitalist control of jobs combined with included groups’ monopolization of job niches help explain why adult, native, white men are privileged in many different hierarchies, whereas nonadult, migrant, nonwhite women are invariably among the excluded. He emphasizes that new job hierarchies within capitalist industry tend to be filled according to already existing social distinctions; employers use old distinctions to justify and buttress new workplace distinctions and maintain harmony by endorsing distinctions that already divide the labor force. In so doing, employers and included groups perpetuate existing social distinctions and reinforce them, creating durable inequality.
Increasingly, modern interpretations stress marginalization’s collective character and the role of the state, elites, and entrenched groups in determining who is marginalized. But wherever it occurs, marginalization seldom begins afresh. Institutions typically fill new job hierarchies in line with existing social ranks. Groups marginalized in the past have the best chance of being marginalized in the future.
SEE ALSO Education, Unequal ; Inequality, Income ; Inequality, Political ; Lumpenproletariat ; Marxism; Social Exclusion ; Stratification
Michael Hanagan
Source Citation (MLA 8th Edition)
"Marginalization." International Encyclopedia of the Social Sciences, edited by William A. Darity, Jr., 2nd ed., vol. 4, Macmillan Reference USA, 2008, pp. 598-599. Gale Virtual Reference Library, http://link.galegroup.com/apps/doc/CX3045301449/GVRL?u=umd_umuc&sid=GVRL&xid=4b9c6d65.
Home Ownership/ Housing
Nathanel T. Lauster and Adam Matthew Easterbrook
Encyclopedia of the Life Course and Human Development. Ed. Deborah Carr. Vol. 2: Adulthood. Detroit, MI:Macmillan Reference USA, 2009. p202-207.
Copyright: COPYRIGHT 2009 Macmillan Reference USA, a part of Gale, Cengage Learning
Listen
Page 202
Home Ownership/ HousingHOUSING CHARACTERISTICS
HOUSING, SOCIAL STATUS, AND HISTORICAL TRENDS
HOUSING AND LIFE COURSE TRANSITIONS
Several key life course transitions, such as leaving home and beginning to cohabit with a partner, also can be considered household transitions because they involve movements between households, the creation of a new household, or the dissolution of a household. Because a household typically is defined as a group of individuals who share a dwelling space, these household transitions are also housing transitions for at least some of the individuals involved. Those persons relocate physically from one housing unit (e.g., an apartment, house, or mobile home) to another. They also may change their housing tenure, that is, whether they own the dwelling, pay rent to live there, or have another arrangement.
In addition to the close practical link between household transitions and housing transitions, housing has a reciprocal relationship with other life course transitions, such as having a child, in that a life course transition may require a change in housing (e.g., to get more space) or may not occur until appropriate housing has been secured. Finally, transitions between housing situations can be considered life course transitions in their own right because they enhance or limit people's opportunities.
HOUSING CHARACTERISTICSHousing circumstances are differentiated by a variety of characteristics that are influenced strongly by local and national housing policies. One distinction is between institutional or group housing (military barracks, college dormitories, jails, hospitals, monasteries, etc.) and housing that consists of private households. Transitions into and out of group housing can mark important events in the life course, but these transitions usually involve either relatively small proportions of the population or relatively short periods in the life course. In the North American context most housing transitions involve private households.
Tenure Housing consisting of private households can be differentiated by tenure, structure, and neighborhoodPage 203 | Top of Articlecharacteristics. Tenure reflects the social organization of property and establishes rights regarding housing. In North America tenure mostly is divided between rental housing and owner-occupied housing, though there are other categories, including cooperative housing. Those living in rental housing are tenants who pay rent to landlords in exchange for their housing. Depending on local regulations, renters often have limited rights with respect to privacy and few guarantees regarding the stability of their living quarters. However, moving between rental dwellings is relatively easy, leaving renters with more flexibility to move than owners have. Rental housing usually is controlled by the private sector in North America, with considerably smaller ownership by the public (government-run) and nonprofit sectors.
Households that live in owner-occupied housing serve as their own landlords; these owners typically have greater rights to privacy and more stability in their living circumstances than do renters. However, because buying and selling real estate is a much more involved process than renting, there are higher transaction costs associated with moving for owners and correspondingly less flexibility. In the North American context transitions into ownership usually are financed by arranging a loan, or mortgage, from a lender. The dwelling serves as collateral for the loan and may be repossessed if the owner falls behind on the payments (Lea, 1996). Mortgage payments are often higher than rental payments but eventually act as investments, whereas rent does not. As a result of building equity in their housing investment, home owners usually attain wealth faster than renters do. In the United States tax advantages are provided to home owners, further increasing their ability to accumulate wealth relative to renters (Chevan, 1989).
Structure Housing also can be differentiated by structure. Key distinctions based on structure typically relate to the number of households that share the same building and walls. Thus, housing can be detached (or single-family), with one household completely separated from all others; attached or semiattached (e.g., town houses, row houses, duplexes), where dwellings share walls but are otherwise freestanding with separate street-level entrances; or multi-unit (apartment buildings). Apartment buildings usually are differentiated into low-rise and high-rise buildings, depending on the number of floors they contain. Other aspects of housing structure also vary, including total floor space, number of bedrooms, number of bathrooms, age, state of repair, and presence and characteristics of kitchens. Some of these aspects, such as number of rooms, are particularly important for the measurement of household-level concepts such as residential crowding (Myers & Baer, 1996).
Neighborhood Housing also can be differentiated by neighborhood. Neighborhood location is a key factor in most housing decisions because neighborhoods differ in distance from work and availability of services and amenities (Dieleman & Mulder, 2002). The structure and costs of different types of housing vary by location, and housing transitions frequently involve movement between neighborhoods. Overall, housing structure is closely related to housing tenure in North America, so that most detached single-family housing is owner-occupied (Rossi & Weber, 1996). Structure of housing also is linked to neighborhood. Roomier single-family housing often dominates low-density rural and suburban neighborhoods, and smaller apartments in multiunit buildings typically predominate in higher-density urban neighborhoods (Rossi & Weber, 1996).
HOUSING, SOCIAL STATUS, AND HISTORICAL TRENDSHousing structure, tenure, and neighborhood are closely related to social status both in North America (Gans, 1967; Perin, 1977) and elsewhere (Rowlands & Gurney, 2000; Bourdieu, 2005). C. Perin (1977) remarked on the implicit existence of a housing ladder. Individuals are presumed to enter a rental market after leaving the parental home, thus starting at the base of the ladder. Then they gradually climb the ladder, building wealth and status as they obtain owner-occupied housing and move to more desirable neighborhoods. Owner occupation of a detached single-family home in a residential neighborhood is considered the most desirable housing situation (Rossi & Weber, 1996). Consequently, owners often are considered more trustworthy, stable, and responsible than renters (Rowlands & Gurney, 2000). Despite popular perceptions, a review by P. Rossi & E. Weber (1996) found few consistent social benefits (meaning benefits to society) to home ownership.
As a result of the associations between housing and social status, the transition into home ownership is significant for many people. It frequently is viewed as one of the transitions that define responsible adulthood (Hen-retta, 1984). Policymakers in a variety of contexts also have taken an interest in encouraging home ownership. In the United States tax policies and policies regulating the extension of credit have encouraged transitions into home ownership (Chevan, 1989). Nevertheless, sharp distinctions in access to home ownership remain, separating the economically advantaged from the disadvan-taged (Lauster, 2007).
Improvements in Housing Housing conditions and trends differ from place to place, but a few broad historical trends can be identified. Average household size hasPage 204 | Top of Articledeclined dramatically in North America and Europe over the long term, leaving fewer people sharing the same amount of housing space. According to U.S. Census data, average household size decreased from approximately 4.5 people per private household in 1900 to 2.5 in 2005 (Ruggles, Sobek, Alexander, Fitch, Goeken, Hall et al., 2004). In that period home ownership rose, with an estimated 46% of households owning in 1900, compared with 67% in 2005 (Ruggles et al., 2004). Most of the increase in home ownership in the United States occurred after World War II (Chevan, 1989). The proportion of households living in roomier dwellings and in detached dwellings also rose during that time (Lauster, 2007). All these trends suggest a gradual improvement in North American housing standards, with fewer people living in crowded housing and more people living at the top of the housing ladder.
Unequal Distribution of Housing Improvements in housing standards have not been distributed equally. In the market-dominated model of housing provision that prevails in North America, households with little savings or income have been left without access to more valued forms of housing. Several trends have combined to widen housing disparities since the 1970s. Rising income inequality coinciding with rising housing prices has contributed to widening disparities in access to housing (Piketty & Saez, 2003; Lauster, 2007). At the same time incentives for developers to build new rental housing largely have disappeared, leaving little new housing stock available to those at the lower end of the income range (Erikson. 1994). These trends, coupled with a movement toward deinstitutionalizing those with mental and physical disabilities, have led to a marked rise in substandard housing and homelessness for those marginalized by the market (Burt, 1991).
Estimates of the number of homeless in North America range from hundreds of thousands to several million (Erikson, 1994; Shlay & Rossi, 1992). As the number of homeless people has increased, the composition of the homeless population has changed (Rossi, 1989; Phelan & Link, 1999). Whereas the homeless once were mainly White middle-aged single men (Erikson, 1994; Swanstrom, 1989; Hoch & Slayton, 1989; Cohen & Sokolovsky, 1989), they have become more diverse and include women, children, and families of various ethnic backgrounds (Shlay & Rossi, 1992). The homeless are also more visible throughout cities (Rossi, 1989) as well as being poorer and younger and are affected by various medical, criminal, and social problems (Erikson, 1994; Gelberg & Linn, 1989; Lee & Schreck, 2005). Various life course events influence the likelihood of becoming homeless, but analysts emphasize that the primary cause is the inability of people to compete for housing in the face of a shrinking supply of low-cost housing (Erikson, 1994). The disadvantages created by homelessness, including loss of opportunities, feelings of helplessness, and general social stigma, have long-term implications for the life course of homeless individuals.
In addition to the ways in which the poor have been disadvantaged by the market provision of housing, other groups have been disadvantaged by direct discrimination. In the United States, historically, Black Americans in particular were often prevented from living outside designated Black neighborhoods. Black Americans also often were denied loans to purchase housing, the major route for building wealth in North America. The Fair Housing Act of 1968 penalized discrimination on the basis of “race, color, religion, or national origin,” but few means of enforcement were included in the act (Schill & Friedman, 1999). In 1988 a set of amendments strengthened the act and also barred discrimination against “families with children and … persons with physical or mental disabilities” (Schill & Friedman, 1999).
Despite efforts to reduce discrimination in housing in North America and elsewhere, neighborhood segregation is widespread, especially by ethnicity and race (Mas-sey & Demon, 1993; Wilkes & Iceland, 2004). L. Freeman (2000) provided three explanations for the persistence of segregation: the spatial assimilation model, which links segregation to impoverishment and broader lack of housing opportunities (Massey 1985); the place stratification model, which states that direct discrimination continues to limit opportunities for minority group members (Alba & Logan, 1993); and the residential preferences model, which argues that much of segregation can be explained by minority households choosing to live near one another (Schelling, 1971). Freeman found evidence for each of those models.
HOUSING AND LIFE COURSE TRANSITIONSHousing characteristics, including tenure, structure, and neighborhood, can influence a number of specific life transitions. These effects are often reciprocal, so that life course transitions also influence housing transitions (Mulder & Wagner, 1998; Lauster & Fransson, 2006).
Neighborhood effects on life course transitions have received increased attention (Sampson, Morenoff, & Gannon-Rowley, 2002). For example, neighborhoods influence the likelihood of risky behavior and exposure to violence (Kowaleski-Jones, 2000; Sampson et al., 2002), the timing of first sex (Baumer & South, 2001), and family formation (South & Crowder, 1999).
Life course events also can influence neighborhood choice. For instance, coming out in the life course of gays and lesbians often is accompanied by a choice to live inPage 205 | Top of Articlegay enclaves (Weston, 1991). These communities allow gays and lesbians to share stories and develop histories, feel accepted, exert political and social power, and meet others who are similar (LeVay & Nonas, 1995; Sutton, 1994; Weeks, Heaphy, & Donovan, 2001; Weston, 1991). This process is similar to the residential preference model of segregation discussed by Freeman (2000). In this case the gay community is not necessarily created to separate homosexuals and heterosexuals but is a method for protecting individuals' quality of life.
Similarly, having school-age children can influence neighborhood choice, at least for those with the ability to choose. In addition to neighborhood moves based on minimizing the risks children face, parents may move to further educational achievement and improve social status (Croft, 2004). As J. Holme (2002) noted, these moves often are based on social constructions of school status, combining perceptions of neighborhood class and racial composition with measurements of performance. In turn, neighborhood school status boosts the price of local housing (Kane, Staiger, & Samms, 2003; Croft. 2004), and that also limits neighborhood choice.
Research shows that access to housing, housing tenure, and housing structure are reciprocally related to life course transitions. Access to housing seems to influence both the likelihood that new households will be formed and the form new households take (Mutchler & Krivo, 1989; Hughes, 2003). Some authors argue that limited access to housing increases the likelihood of nontraditional living arrangements, including extended family living and nonmarital cohabitation (Mutchler & Krivo, 1989). Other authors have found evidence that securing high-quality housing serves as a culturally important prerequisite for both traditional (Hughes, 2003) and nontraditional (Lauster & Fransson, 2006) forms of family formation. Increased access to all forms of housing may allow more people to live alone (Kobrin, 1976; Lauster & Fransson, 2006). Securing access to a detached roomy dwelling also may be linked to childbearing in the United States (Lauster, 2007). Conversely, marrying or having children before owning a detached roomy dwelling makes individuals more likely to move to this type of housing (Chevan, 1989; Mulder & Wagner, 1998; Clark, Deurloo, & Dileman, 1997; Lauster & Fransson, 2006).
Although the overall level of mobility between dwellings varies widely across countries, the age pattern of moves is broadly the same (Dieleman & Mulder, 2002). Most housing transitions occur during young adulthood, reflecting the relative instability of the transition to adulthood and its many life course transitions. Rates of residential mobility begin to taper during middle age (Dieleman & Mulder, 2002). Nevertheless, important relationships between housing and later life course transitions remain.
Some researchers have provided evidence that home ownership reduces the risk of divorce, at least on the individual level, because ownership represents a shared investment in a marriage (Murphy, 1985). Others argue that the likelihood of separation is increased in contexts in which single-family homes dominate, preventing the development of supportive communities (Bratt, 2002; Lauster, 2005). Late in life transitions in housing circumstances usually reflect retirement or changes in caregiving arrangements (Dieleman & Mulder, 2002). The move from independent housing to retirement communities or assisted living facilities can be particularly traumatic (Adams, Sanders, & Auth, 2004), leaving many people to age in place (remain in their own homes as they age). However, aging in place may result in deterioration of the dwelling if individuals are unable to make repairs (Golant & LaGreca, 1994).
Housing transitions may lead to or result from a variety of household transitions. Housing serves as one of the key links between life course transitions and the economy. Access to housing is also heavily influenced by policy makers. As a result, housing policy can have large effects on how people proceed through a host of life course transitions. By placing individuals, housing also links the life course to neighborhoods and to the environment. This is important for understanding neighborhood effects on the life course as well as the impacts of life course transitions on the environment. Overall, although most housing transitions take place early in the life course, housing intersects with and shapes the life course at all ages.
SEE ALSO Volume 2: Consumption, Adulthood and Later Life ; Debt ; Homeless, Adults ; Neighborhood Context, Adulthood ; Residential Mobility, Adulthood ; Segregation, Residential ; Volume 3: Wealth .
Source Citation (MLA 8th Edition)
Lauster, Nathanel T., and Adam Matthew Easterbrook. "Home Ownership/ Housing." Encyclopedia of the Life Course and Human Development, edited by Deborah Carr, vol. 2: Adulthood, Macmillan Reference USA, 2009, pp. 202-207. Gale Virtual Reference Library, http://link.galegroup.com/apps/doc/CX3273000183/GVRL?u=umd_umuc&sid=GVRL&xid=4705d7b3.
Homelessness
International Encyclopedia of the Social Sciences. Ed. William A. Darity, Jr.. Vol. 3. 2nd ed. Detroit, MI: Macmillan Reference USA, 2008. p498-500.
Copyright: COPYRIGHT 2008 Gale, Cengage Learning
Listen
Page 498
HomelessnessBIBLIOGRAPHY
The National Law Center on Homelessness and Poverty indicates that, on any given day, approximately 840,000 people in the United States are homeless or living in temporary shelters. Approximately 3.5 million people in the United States will meet criteria for homelessness within a given year, and 1.35 million of them are children. It is estimated that 7.4 percent of U.S. residents, or as many as 13.5 million people in the United States, have been homeless at one point in their lives.
The majority of the homeless in urban areas are adult men of minority descent. In rural areas, however, the homeless are more likely to be Caucasian, and their genders and ages are less well known. Across both rural and urban settings, approximately 20 to 25 percent of the homeless adult population suffer from some type of severe and persistent mental illness. Although homelessness has been a historically significant phenomenon in the United States, it still remains difficult to cull reliable and comprehensive data about homeless individuals. Indeed given the difficulty of tracking and finding individuals who are homeless because of the variability in their locations, Page 499 | Top of Articlenational data may significantly underestimate the incidence and prevalence of this social condition.
In 1987 the Stewart B. McKinney Homeless Assistance Act marked the first time the U.S. government acknowledged homelessness as a national crisis, despite its prevalence for decades prior to this event. In addition to designating federal money to help research and solve the problem of homelessness, the McKinney Act also provided a clear definition of homeless. According to the legislation, a “homeless” individual is one who lacks a fixed, regular, and adequate nighttime residence or has a primary nighttime residence that is a supervised publicly or privately operated shelter, an institution that provides temporary residence for individuals who will be institutionalized, or a public or private place not ordinarily used as regular sleeping accommodations for human beings.
The term homeless is inapplicable to individuals who are imprisoned or detained under congressional or state law. The concept as understood in the United States is largely based on an individual’s physical living arrangements or accommodations. However, as the literature suggests, this definition may be inadequate and unable to capture the complexity of phenomena internationally. Indeed this U.S. definition of homelessness reduces the concept to an issue of “houselessness,” which is a critical caveat to achieving an international understanding of the phenomenon.
The United Nations Centre for Human Settlements (Habitat) has refined homelessness and developed a more globally appropriate and responsive definition. The center also recognizes that definitions of homelessness vary widely and are influenced by geographic and socioeconomic factors. Most of what is known about homelessness, including an accepted definition of the construct, is based on the limited statistics and information available from European and North American countries and from the developing country of India. From this perspective, commonly held conceptualizations of homelessness include a consideration of social and familial relationships and sociodemographic factors.
Globally it is estimated that between 100 million and one billion individuals are homeless. Notably, however, homelessness data from developing countries are particularly sparse and difficult to collect. Across developed and developing countries, homelessness is often understood through both the narrow lens of accommodations, or lack thereof, and broader perspectives in an effort to inform services and interventions for those affected. For example, while some countries employ a typology based on characteristics of housing quality or on the length of time an individual is homeless, other countries may use a typology based on risk or potential of facing houseless conditions.
There are some emerging cross-cultural categories for understanding homelessness in an international arena. For example, supplementation homelessness, whereby an individual is homeless in response to migration, is quite different from survival homelessness, whereby individuals are homeless because they are searching for improved opportunities. Crisis homelessness, a precipitant of homelessness produced by a crisis (such as a storm, earthquake, or war) is quite different from the previous two. These categories focus more on the etiology for homelessness rather than on factors directly associated with the homeless individuals’ culture, race, or premorbid socioeconomic status.
From a global perspective, much attention is given to homeless children and adolescents, often referred to as street children. It was estimated that there were 100 million street children worldwide in 1992, with 71 million of these children working and living on the streets full-time, 23 million working and living on the streets part-time, and approximately 7 to 8 million abandoned. While street children are considered among the homeless, the literature makes clear distinctions between homeless adults and homeless children. The most accepted definition of a street child is “any girl or boy for whom the street (in the widest sense of the word, including unoccupied dwellings, wasteland, etc.) has become his or her habitual abode and/or source of livelihood; and who is inadequately protected, supervised, or directed by responsible adults” (Glasser 1994, p. 54).
Such a definition addresses characteristics in addition to physical living arrangements with a broader consideration of a child’s basic needs (that is, need for security and socialization). Similar to the various typologies used to understand global homelessness among adults, a typology has been developed by UNICEF that differentiates street children who live at home and those who do not, which is particularly relevant given that the majority of street children have some contact with their families.
Specifically the literature has found that there are experiential differences between street children who are deemed at high risk of homelessness (that is, the child spends some time in the streets), street children who are in the streets (for example, they spend most of their time in the streets, usually working), and street children who are of the streets (that is, the street is the child’s home). As with the typologies used with homeless adults, these categories may be useful in determining the level and the type of services needed.
Homelessness is an international crisis. The understanding of who is most affected and under what conditions as well as the ability to programmatically remediate the social ills that promote this condition are further limited by the national definitions that are often internally valid but not well generalized internationally.
Source Citation (MLA 8th Edition)
"Homelessness." International Encyclopedia of the Social Sciences, edited by William A. Darity, Jr., 2nd ed., vol. 3, Macmillan Reference USA, 2008, pp. 498-500. Gale Virtual Reference Library, http://link.galegroup.com/apps/doc/CX3045301042/GVRL?u=umd_umuc&sid=GVRL&xid=b33f8863.
Homeless Families
IRENE GLASSER
International Encyclopedia of Marriage and Family. Ed. James J. Ponzetti. Vol. 2. 2nd ed. New York, NY:Macmillan Reference USA, 2003. p816-822.
Copyright: COPYRIGHT 2003 Macmillan Reference USA, COPYRIGHT 2006 Gale, COPYRIGHT 2007 Gale, Cengage Learning
Listen
Page 816
HOMELESS FAMILIESHomeless families are those that either lack shelter or have shelter that is so inadequate, temporary, or insecure that the situation threatens the social, psychological, or physical health of the family. Homeless families are a departure from the classic homeless image of the single male, detached from society and disaffiliated from kin, friends, and work.
Homeless families receive attention in large part because the presence of children among the homeless confronts society directly with its failure to guarantee a minimum standard of protection. The questions of who these families are, how they became homeless, and how their homelessness can be prevented and ameliorated carry an urgency that contrasts with more blaming attitudes towards the single homeless individual.
Prevalence of Family HomelessnessIt is difficult to ascertain the numbers of homeless families. Few countries systematically enumerate the homeless in their national censuses, and unless the families reside in a public shelter, they are difficult to locate. Homeless families may not want to be found for fear of involvement of child welfarePage 817 | Top of Articleauthorities. Furthermore, it is not known how many families are doubled up, sleep in vacant buildings, or separate due to lack of housing. At times the single female homeless person may be a woman who has recently lost custody of her children, and this may also mask the true prevalence of homeless families.
What proportion of the homeless population in the United States is comprised of families? Census 2000 counted 170,706 individuals living in emergency and transitional shelters for the homeless, out of a total US population of 281,421,906, or .6 percent of the population (Smith and Smith 2001). Of this number approximately 25.7 percent were under eighteen years old. The 1996 National Survey of Homeless Assistance Providers and Clients (NSHAPC) (Burt et al. 1999) gathered information on homelessness from a statistical sample of homeless-serving agencies in the US and found that 15 percent of all homeless households were families consisting of a homeless individual with one or more minor children with them. However, if one considers all homeless individuals including minor children, then 34 percent of homeless people found at homeless assistance program were members of homeless families. Of the minor children living with their homeless parent, 20 percent were infants and toddlers (up to age two), 22 percent were preschoolers (ages three to five), 33 percent were elementary school age (six to twelve) and 20 percent were adolescents (twelve to seventeen) (National Survey of Homeless Assistance Providers and Clients NSHAPC 1999).
Most research on homeless families is conducted in emergency shelters for families. This poses the question of whether we are actually studying the services for the homeless rather than the phenomenon itself. It then becomes necessary to ask, if many communities are more comfortable in providing services for homeless families than for single people, whether it is correct to conclude that a large proportion of the homeless population are living in families.
Worldwide, the United Nations estimates that one billion people live in conditions of inadequate shelter or literal homelessness. Most of these people are families who are driven to living in squatter settlements due to rural-to-urban migration, severe unemployment and underemployment, and the existence of large numbers of refugees and victims of disasters (United Nations Centre for Human Settlement 1990; Glasser 1994; Bascom 1993).
Causes of Family HomelessnessA major cause of family homelessness in the urban centers of North America and Western Europe is the shortage of affordable housing. Cities have been transformed from manufacturing to service-based economies, and offices, retail complexes, and luxury high-rise apartments have replaced low-rent housing. A widely used word for this process is gentrification, a term introduced by Glass (1964), to describe the phenomenon in the 1960s whereby the British gentry bought and renovated old buildings in London.
The problem of the dearth of affordable housing is compounded by the large percentage of family income that poor families spend on rent. According to the National Coalition for the Homeless (1999) and the National Low Income Housing Coalition (1998), a minimum wage earner would have to work eighty-seven hours per week in a median cost state in order to afford a two-bedroom apartment at the 30 percent of one's income that is considered affordable by the U.S. government. If a family receives the financial assistance program Temporary Assistance to Needy Families (TANF), the family will be at or below the federal poverty level and will therefore compete for the limited number of public housing or rent-subsidized housing units available.
One productive method of uncovering causes of family homelessness is to look for two similar societies that have very different rates of family homelessness. Working alone and together in Hartford, Connecticut, and Quebec City, Quebec, Irene Glasser, Louise Fournier, and André Costopolous (1999) found that although both cities have a homeless population, Quebec City has approximately one-tenth the number of people living in its short-term and long-term shelter beds as has Hartford, and no apparent family homelessness.
The most obvious explanation for the absence of family homelessness in Quebec is the larger number of safety net programs in the province of Quebec and in Canada in general. With the greater amount and availability of financial assistance, a family is able to find and keep its housing despitePage 818 | Top of Article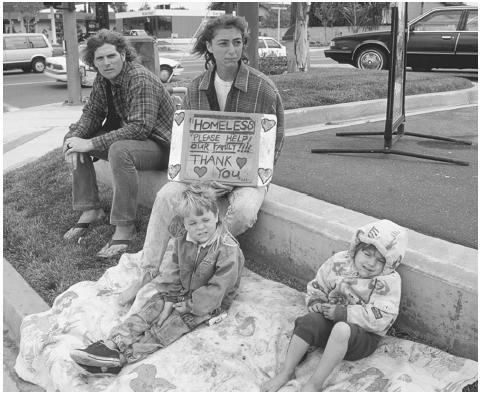
The presence of children among the homeless gives a sense of urgency to the problem of homelessness and calls attention to society's failure to guarantee adequate protection to families. TONY FREEMAN/PHOTOEDIT
emergencies such as the loss of a job or family separations. An alternative hypothesis is that families with severe problems are separated by the child protection authorities sooner and more frequently in Quebec, and therefore to do not present themselves as homeless families.
In addition to the structural problems of lack of affordable housing and very low income from welfare or work, families also face personal problems that may push them into homelessness. For example, fleeing domestic violence is one path to homelessness. A victim (most often a woman) may first take refuge in a domestic violence shelter, but when the crisis is resolved, and she still has no housing, she may have to move into a homeless shelter (Glasser and Zywiak 2000). Further, addiction to alcohol or drugs may affect parents, severely interfering with their ability to house their family. Moving into a shelter may be considered a first step in treatment, especially if the shelter has the ability to diagnose the addiction and facilitate treatment.
Adaptations to HomelessnessProbably the least researched but most common adaptation to homelessness is that of living with another poor family on a very temporary basis. This is referred to as doubling-up and is often a precursor to life on the streets, or in encampments and shelters. The U.S. Census Bureau estimatedPage 819 | Top of Articlethat in 1999 there were 1,428,000 unrelated subfamilies or .5 percent of the total family population. These subfamilies are generally thought to be the doubled-up. Their poverty rate was 39 percent in contrast to the 10 percent poverty rate of all families (U.S. Census Bureau 2000).
The pioneering work of Janet Fitchen (1996) on rural homelessness in New York State documented that a frequent response to poverty was to squeeze two families into a trailer or apartment that was already too small for one. These arrangements were often short-lived, as the strain of the situation made life unbearable. Doubling-up was associated with a worsening economy in rural areas due to the large loss of manufacturing jobs and the rise of single motherhood in which income (through work or welfare) was not adequate to pay rent. Fitchen (1992) also found that at times enforcing building codes on a family living in a crumbling farmhouse or a tarpaper-sided shack pushed a family from being a homeowner to being a renter of unaffordable apartments, and eventually, into homelessness.
Anna Lou Dehavenon (1996) documented the relationship between doubling-up and homelessness in New York City's Emergency Assistance Units (EAUs) program, which places homeless families in temporary shelters. The EAUs' policy was to send homeless families back into doubledup situations, from which 78 percent of them had just come. Although 92 percent of the guest families paid the host families rent, the guest families could not live together in these severely overcrowded conditions.
In the developing world the major adaptation to homelessness for hundreds of thousands of people is to live in squatter settlements. Squatting, as a generic term, refers to building a shelter of easily found materials on property to which one has no legal claim. These settlements are known by many terms, including bidonvilles (tin cities) in Africa, favelas in Brazil, and pueblos jovénes (young towns) in Peru, and pavement dwellers in India. The harsh realities of living in a Brazilian favela were documented by Carolina De Jesus in the now-classic Child of the Dark (1963), one of the few such first-person accounts.
Although squatter settlements were initially thought of as temporary, makeshift arrangements for new rural migrants to urban areas, by the late 1960s, squatter settlements were seen as rational alternatives to the housing shortage for low-income people (Turner 1976). Some governments shifted from a policy of demolishing the settlements to projects bringing them clean water, sanitation, electricity, and security of tenure. Critics of governmental encouragement of self-help point out that this absolves governments from committing significant amounts of money to housing their population and also reduces the wage requirements of workers by giving them access to low-cost housing.
In an in-depth study of the squatters of vacant public housing in and around Paris, Guy Boudimbou (1992) found that most of the squatters were Northern and West African immigrant families who faced significant housing discrimination. One form of adaptation was for a network of squatters to move from one vacant building to another, sometimes with the help of "managers," some of whom collected the rent but were not able to produce an apartment.
Contrasting the Poor-but-Housed with Homeless FamiliesFurther insight into homeless families comes from comparing them to poor-but-housed families. In a study of social relationships, 677 homeless mothers and 495 poor-but-housed mothers were interviewed in New York City (Shinn, Knickman, and Weitzman 1991). The homeless families were interviewed at the time of their request for shelter to avoid confusing characteristics caused by residence in the shelter with characteristics of the families themselves. A surprising finding was that the homeless respondents in fact were in greater touch with their social networks than their housed counterparts. However, the homeless respondents were less able to stay with relatives and friends, in large part because they had already worn out their welcome by having stayed with them previously.
Ellen L. Bassuk and John Buchner (1997) contrasted a sample of single mothers and their children living in shelters in Worcester, Massachusetts, with a sample of low-income single mothers who had never been homeless. Mothers of the homeless families were more likely to have been in foster-care placement and to have had a female caregiver who used drugs. In their adult lives theyPage 820 | Top of Articlehad lived in the area for a shorter period of time. They were also more likely to be African American or Puerto Rican. Factors that prevented homelessness for the poor families were linked with the mother's being a primary tenant (her name was on the lease), receiving monetary housing subsidies, and having a larger social network.
Programs that House Homeless FamiliesShelters. Shelters are low-barrier, easy access congregate living for families for a short period of time (two to three months). They are frequently administered by community organizations, and their major form of treatment is case management, which seeks to re-house the family. Family shelters are usually dry—no drug or alcohol use. They may require that the adults be involved in substance-abuse treatment, mental health counseling, education, or job training, or be employed. A real problem for families living in shelters is that many family shelters bar fathers and adolescent boys from staying with the families, in effect splitting up the family (Susser 1993; Friedman 2000).
Transitional and supportive housing. In the United States, by the mid-1980s, a pattern was developing in which at least some of the homeless population experienced repeated episodes of shelter living. Many people were not able to make the transition from shelter to apartment living and were in need of more support in order to maintain permanent housing. This support came in the form of transitional housing, which generally consists of housing with two years of services; and supportive housing, which is housing with the provision of services for an open-ended period of time. Transitional and supportive housing may be provided in one physical space, or they may be provided in scattered apartments in publicly or privately owned buildings, with services brought in to the families. In many communities, these programs are better tolerated than shelters, which are often viewed with fear and suspicion.
An interesting approach to transitional housing is finding foster families for homeless families. Utilizing their experience in providing foster care to children, and noting the lack of social support and sense of isolation that was found in homeless families, the Human Service Associates (HAS), a private, nonprofit, child-placing agency in St. Paul, Minnesota, placed thirty-four families with host families (Cornish 1992). An evaluation of the project found that 60 percent of the foster families coresided with the host family for a period of four to six months, then moved into their own housing, and were still in their own housing six months later.
Homesteading. As in the pioneer frontier days of the United States and Canada, urban homesteading represents one strategy for providing housing. An example of contemporary homesteading is Harding Park, located on the waterfront in the Bronx, New York, a twenty-acre community, which now has 250 small homes on it. The area, which had been a weekend campsite for apartment dwellers since the early 1900s, became a refuge for mostly Puerto Rican residents living in high-crime neighborhoods in the Bronx, who found a tract of dilapidated shacks at the water's edge. The area was reminiscent of the fishing villages of Puerto Rico, and through their own labor and materials, and with permission from the City of New York, these modern homesteaders turned the shacks into habitable houses (Glasser and Bridgman 1999).
Eviction prevention. One strategy that prevents homelessness among families is resolving landlord-tenant disputes to avoid evictions. An example is the Tenancy Settlement/Mediation Program in Passaic County, New Jersey, an area with a declining amount of residential housing, a deteriorating economic base, and high rates of poverty and public assistance. The program is staffed by social workers trained in mediation and serves sixteen municipalities with a combined population of 500,000 people. In 1990, approximately 1,300 tenancy disputes were successfully settled, which reflects an 89.5 percent success rate (Curcio 1992).
Community development of squatter settlements. Some developing countries have programs that enable squatter settlements to upgrade their housing, bring in essential services (potable water, sanitation, and electricity), and secure the individual's right to remain in the housing. The World Bank is one of the leaders in the lending of money for squatter upgrading projects, which usually feature a strong self-help component. In some parts of the world, households get together to build each other's houses; in others, the household hires people to work for them; in still others, the household builds the house on its own (Keare and Parris 1982).
One successful example of squatter upgrading has been the Kampung Improvement ProgrammePage 821 | Top of Articlein Jakarta, Indonesia. A kampung is a village, but in Jakarta it refers to urban settlements on swampy land, subject to serious flooding. The Kampung Improvement Programme provided eighty-seven kampungs (more than one million people) with clean water, canals to mitigate flooding, improved roads and concrete paths, communal sanitation, and a system of garbage disposal. A World Bank Loan in 1974 added schools and health clinics. One major finding of this project was that bringing these services to the community inspired individual householders to improve their dwellings (Oliver 1987).
ConclusionExamination of homeless families presents a tremendously diverse picture of the face of homelessness. The common thread is that families living in shelters, doubling-up, or in squatter settlements face enormous barriers to being able to nurture and educate their children adequately. Under these circumstances homeless families may eventually lose their ability to function as a family. Therefore, adequate and secure housing is essential in keeping families together; it is the anchor that underlies the very concept of family. Although the problem of homeless families remains substantial, creative approaches to providing permanent housing for families have been discovered in both the industrialized and the developing world. The best of these projects tap into the strengths and active participation of the families.
Source Citation (MLA 8th Edition)
GLASSER, IRENE. "Homeless Families." International Encyclopedia of Marriage and Family, edited by James J. Ponzetti, 2nd ed., vol. 2, Macmillan Reference USA, 2003, pp. 816-822. Gale Virtual Reference Library, http://link.galegroup.com/apps/doc/CX3406900209/GVRL?u=umd_umuc&sid=GVRL&xid=ec770249.


