What I need help on the most would be the following sections: This entire section is also in the attachment called Instructions 1. data management, 2. data analysis, 3. discussion. Just those parts
Running head: [Shortened Title up to 50 Characters] 0
Treatment Satisfaction
Student Name
Institution
Instructor
Treatment Satisfaction
[The body of your paper uses a half-inch first line indent and is double-spaced. APA style provides for up to five heading levels, shown in the paragraphs that follow. Note that the word Introduction should not be used as an initial heading, as it’s assumed that your paper begins with an introduction.]
Literature Review[The first two heading levels get their own paragraph, as shown here. Headings 3, 4, and 5 are run-in headings used at the beginning of the paragraph.]
Treatment Satisfaction[To add a table of contents (TOC), apply the appropriate heading style to just the heading text at the start of a paragraph and it will show up in your TOC. To do this, select the text for your heading. Then, on the Home tab, in the Styles gallery, click the style you need.]
Desire to Help.[Include a period at the end of a run-in heading. Note that you can include consecutive paragraphs with their own headings, where appropriate.]
Treatment Readiness[When using headings, don’t skip levels. If you need a heading 3, 4, or 5 with no text following it before the next heading, just add a period at the end of the heading and then start a new paragraph for the subheading and its text.] (Last Name, Year)
Treatment Participation[Like all sections of your paper, references start on their own page. The references page that follows is created using the Citations & Bibliography feature, available on the References tab. This feature includes a style option that formats your references for APA 6th Edition. You can also use this feature to add in-text citations that are linked to your source, such as those shown at the end of this paragraph and the preceding paragraph. To customize a citation, right-click it and then click Edit Citation.] (Last Name, Year)
Methodology
Model
Figure 1. Building Relationships
Desire for Help


Treatment Satisfaction (DV)
Treatment Participation


Treatment Readiness
Hypotheses
H1: There is an association between Desire for help and Treatment satisfaction
H2: There is an association between Treatment Participation and Treatment satisfaction.
H3: There is an association between Treatment Readiness and Treatment satisfaction.
H4: There is an association between Desire for Help and Treatment Participation.
H5: There is an association between Treatment readiness and Treatment participation
H6: There is an association between Desire for Help and Treatment Readiness
Data Management
Data Analysis
Findings
Univariate Findings
Table 1: No table yet
Table 2: No tables yet
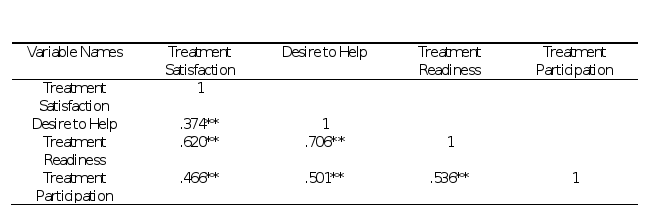
Bivariate Findings
Correlation Matrix
Multi Variate Findings
Table 4 t- Test
| Study Variables | Gender | ||
| Males (M/SD) | Females(M/SD) | ||
| Treatment Satisfaction | 21.83(SD=5.883) | 22.41(SD=5.339) | -1.976 |
| Desire to Help | 22.76(SD=4.377) | 25.18(SD=3.707) | -11.387 |
| Treatment Readiness | 13.46(SD=4.220) | 15.04(SD=3.603) | -7.733 |
| Treatment Participation | 48.75(SD=6.977) | 50.86(SD=5.659) | -6.257 |
Table 5: ANOVA
| Study variables | Very unhappy (M/SD) | Somewhat Unhappy (M/SD) | Not Sure (M/SD) | Somewhat Happy (M/SD) | Very Happy (M/SD) | |
| Treatment Satisfaction | 22.04(SD=6.140) | 22.32(SD=5.774) | 21.94(SD=5.540) | 22.43(SD=5.141) | 22.06(SD=6.047) | .385 |
| Desire to Help | 23.56(SD=4.855) | 24.93(SD=3.978) | 24.53(SD=4.347) | 24.08(SD=3.994) | 22.88(SD=4.367) | 8.544 |
| Treatment Readiness | 13.78(SD=4.526) | 14.85(SD3.797) | 14.30(SD=3.844) | 14.40(SD3.906) | 13.74(SD4.139) | 2.822 |
| Treatment Participation | 49.37 (SD=8.096) | 50.06(SD=7.002) | 49.23(SD=5.963) | 49.59(SD=6.039) | 49.91(SD=6.699) | .515 |
Regression
Table 6 : Regression with Treatment Satisfaction as the Dependent Variable
| Study Variable | Standardized Beta | Significance | |
| Desire to Help | -.173 | 5.892 | .000 |
| Treatment Readiness | .614 | 20.467 | .000 |
| Treatment Participation | .226 | 9.198 | .000 |
Discussion
Revised Model
Figure 2. Revised Model of Building Relationships
Desire for Help
Treatment Satisfaction (DV)
Treatment Participation
Treatment Readiness
References
Last Name, F. M. (Year). Article Title. Journal Title, Pages From - To.
Last Name, F. M. (Year). Book Title. City Name: Publisher Name.
Appendix A
Data Management Output
Ran the Frequencies
Frequencies
| Statistics | ||||||
| CEST006 TR need to stay in treatment | CEST013 TR solve problems in treatment | CEST014 TR treatment is not helping | CEST054 TR treatment gives you hope | CEST056 TR want to be in drug treatment | ||
| Valid | 1567 | 1567 | 1564 | 1565 | 1562 | |
| Missing | 22 | 22 | 25 | 24 | 27 | |
Frequency Table
| CEST006 TR need to stay in treatment | |||||||||
| Frequency | Percent | Valid Percent | Cumulative Percent | ||||||
| Valid | 1 Disagree Strongly | 351 | 22.1 | 22.4 | 22.4 | ||||
| 2 Disagree | 350 | 22.0 | 22.3 | 44.7 | |||||
| 3 Uncertain | 198 | 12.5 | 12.6 | 57.4 | |||||
| 4 Agree | 450 | 28.3 | 28.7 | 86.1 | |||||
| 5 Agree Strongly | 218 | 13.7 | 13.9 | 100.0 | |||||
| Total | 1567 | 98.6 | 100.0 | ||||||
| Missing | System | 22 | 1.4 | ||||||
| Total | 1589 | 100.0 | |||||||
| CEST013 TR solve problems in treatment | |||||||||
| Frequency | Percent | Valid Percent | Cumulative Percent | ||||||
| Valid | 1 Disagree Strongly | 121 | 7.6 | 7.7 | 7.7 | ||||
| 2 Disagree | 121 | 7.6 | 7.7 | 15.4 | |||||
| 3 Uncertain | 138 | 8.7 | 8.8 | 24.3 | |||||
| 4 Agree | 646 | 40.7 | 41.2 | 65.5 | |||||
| 5 Agree Strongly | 541 | 34.0 | 34.5 | 100.0 | |||||
| Total | 1567 | 98.6 | 100.0 | ||||||
| Missing | System | 22 | 1.4 | ||||||
| Total | 1589 | 100.0 | |||||||
| CEST014 TR treatment is not helping | |||||||||
| Frequency | Percent | Valid Percent | Cumulative Percent | ||||||
| Valid | 1 Disagree Strongly | 419 | 26.4 | 26.8 | 26.8 | ||||
| 2 Disagree | 548 | 34.5 | 35.0 | 61.8 | |||||
| 3 Uncertain | 293 | 18.4 | 18.7 | 80.6 | |||||
| 4 Agree | 169 | 10.6 | 10.8 | 91.4 | |||||
| 5 Agree Strongly | 135 | 8.5 | 8.6 | 100.0 | |||||
| Total | 1564 | 98.4 | 100.0 | ||||||
| Missing | System | 25 | 1.6 | ||||||
| Total | 1589 | 100.0 | |||||||
| CEST054 TR treatment gives you hope | |||||||||
| Frequency | Percent | Valid Percent | Cumulative Percent | ||||||
| Valid | 1 Disagree Strongly | 95 | 6.0 | 6.1 | 6.1 | ||||
| 2 Disagree | 96 | 6.0 | 6.1 | 12.2 | |||||
| 3 Uncertain | 177 | 11.1 | 11.3 | 23.5 | |||||
| 4 Agree | 601 | 37.8 | 38.4 | 61.9 | |||||
| 5 Agree Strongly | 596 | 37.5 | 38.1 | 100.0 | |||||
| Total | 1565 | 98.5 | 100.0 | ||||||
| Missing | System | 24 | 1.5 | ||||||
| Total | 1589 | 100.0 | |||||||
| CEST056 TR want to be in drug treatment | |||||||||
| Frequency | Percent | Valid Percent | Cumulative Percent | ||||||
| Valid | 1 Disagree Strongly | 238 | 15.0 | 15.2 | 15.2 | ||||
| 2 Disagree | 220 | 13.8 | 14.1 | 29.3 | |||||
| 3 Uncertain | 189 | 11.9 | 12.1 | 41.4 | |||||
| 4 Agree | 549 | 34.6 | 35.1 | 76.6 | |||||
| 5 Agree Strongly | 366 | 23.0 | 23.4 | 100.0 | |||||
| Total | 1562 | 98.3 | 100.0 | ||||||
| Missing | System | 27 | 1.7 | ||||||
| Total | 1589 | 100.0 | |||||||
FREQUENCIES VARIABLES=CEST007 CEST011 CEST020 CEST030 CEST080 CEST115 CEST122
/ORDER=ANALYSIS.
Frequencies
| Statistics | |||||||||||||||
| CEST007 TS time schedules convenient | CEST011 TS program expects responsibility/self-discipline | CEST020 TS program organized/run well | CEST030 TS satisfied with program | CEST080 TS staff efficient at job | CEST115 TS personal counseling at program | CEST122 TS location is convenient | |||||||||
| Valid | 1569 | 1578 | 1569 | 1572 | 1563 | 1561 | 1555 | ||||||||
| Missing | 20 | 11 | 20 | 17 | 26 | 28 | 34 | ||||||||
Frequency Table
| CEST007 TS time schedules convenient | |||||||||
| Frequency | Percent | Valid Percent | Cumulative Percent | ||||||
| Valid | 1 Disagree Strongly | 196 | 12.3 | 12.5 | 12.5 | ||||
| 2 Disagree | 246 | 15.5 | 15.7 | 28.2 | |||||
| 3 Uncertain | 221 | 13.9 | 14.1 | 42.3 | |||||
| 4 Agree | 716 | 45.1 | 45.6 | 87.9 | |||||
| 5 Agree Strongly | 190 | 12.0 | 12.1 | 100.0 | |||||
| Total | 1569 | 98.7 | 100.0 | ||||||
| Missing | System | 20 | 1.3 | ||||||
| Total | 1589 | 100.0 | |||||||
| CEST011 TS program expects responsibility/self-discipline | |||||||||
| Frequency | Percent | Valid Percent | Cumulative Percent | ||||||
| Valid | 1 Disagree Strongly | 46 | 2.9 | 2.9 | 2.9 | ||||
| 2 Disagree | 33 | 2.1 | 2.1 | 5.0 | |||||
| 3 Uncertain | 87 | 5.5 | 5.5 | 10.5 | |||||
| 4 Agree | 567 | 35.7 | 35.9 | 46.5 | |||||
| 5 Agree Strongly | 845 | 53.2 | 53.5 | 100.0 | |||||
| Total | 1578 | 99.3 | 100.0 | ||||||
| Missing | System | 11 | .7 | ||||||
| Total | 1589 | 100.0 | |||||||
| CEST020 TS program organized/run well | |||||||||
| Frequency | Percent | Valid Percent | Cumulative Percent | ||||||
| Valid | 1 Disagree Strongly | 333 | 21.0 | 21.2 | 21.2 | ||||
| 2 Disagree | 362 | 22.8 | 23.1 | 44.3 | |||||
| 3 Uncertain | 309 | 19.4 | 19.7 | 64.0 | |||||
| 4 Agree | 437 | 27.5 | 27.9 | 91.8 | |||||
| 5 Agree Strongly | 128 | 8.1 | 8.2 | 100.0 | |||||
| Total | 1569 | 98.7 | 100.0 | ||||||
| Missing | System | 20 | 1.3 | ||||||
| Total | 1589 | 100.0 | |||||||
| CEST030 TS satisfied with program | |||||||||
| Frequency | Percent | Valid Percent | Cumulative Percent | ||||||
| Valid | 1 Disagree Strongly | 262 | 16.5 | 16.7 | 16.7 | ||||
| 2 Disagree | 254 | 16.0 | 16.2 | 32.8 | |||||
| 3 Uncertain | 327 | 20.6 | 20.8 | 53.6 | |||||
| 4 Agree | 553 | 34.8 | 35.2 | 88.8 | |||||
| 5 Agree Strongly | 176 | 11.1 | 11.2 | 100.0 | |||||
| Total | 1572 | 98.9 | 100.0 | ||||||
| Missing | System | 17 | 1.1 | ||||||
| Total | 1589 | 100.0 | |||||||
| CEST080 TS staff efficient at job | |||||||||
| Frequency | Percent | Valid Percent | Cumulative Percent | ||||||
| Valid | 1 Disagree Strongly | 191 | 12.0 | 12.2 | 12.2 | ||||
| 2 Disagree | 297 | 18.7 | 19.0 | 31.2 | |||||
| 3 Uncertain | 306 | 19.3 | 19.6 | 50.8 | |||||
| 4 Agree | 610 | 38.4 | 39.0 | 89.8 | |||||
| 5 Agree Strongly | 159 | 10.0 | 10.2 | 100.0 | |||||
| Total | 1563 | 98.4 | 100.0 | ||||||
| Missing | System | 26 | 1.6 | ||||||
| Total | 1589 | 100.0 | |||||||
| CEST115 TS personal counseling at program | |||||||||
| Frequency | Percent | Valid Percent | Cumulative Percent | ||||||
| Valid | 1 Disagree Strongly | 264 | 16.6 | 16.9 | 16.9 | ||||
| 2 Disagree | 502 | 31.6 | 32.2 | 49.1 | |||||
| 3 Uncertain | 260 | 16.4 | 16.7 | 65.7 | |||||
| 4 Agree | 413 | 26.0 | 26.5 | 92.2 | |||||
| 5 Agree Strongly | 122 | 7.7 | 7.8 | 100.0 | |||||
| Total | 1561 | 98.2 | 100.0 | ||||||
| Missing | System | 28 | 1.8 | ||||||
| Total | 1589 | 100.0 | |||||||
| CEST122 TS location is convenient | |||||||||
| Frequency | Percent | Valid Percent | Cumulative Percent | ||||||
| Valid | 1 Disagree Strongly | 497 | 31.3 | 32.0 | 32.0 | ||||
| 2 Disagree | 361 | 22.7 | 23.2 | 55.2 | |||||
| 3 Uncertain | 160 | 10.1 | 10.3 | 65.5 | |||||
| 4 Agree | 387 | 24.4 | 24.9 | 90.4 | |||||
| 5 Agree Strongly | 150 | 9.4 | 9.6 | 100.0 | |||||
| Total | 1555 | 97.9 | 100.0 | ||||||
| Missing | System | 34 | 2.1 | ||||||
| Total | 1589 | 100.0 | |||||||
FREQUENCIES VARIABLES=CEST003 CEST032 CEST039 CEST065 CEST087 CEST116
/ORDER=ANALYSIS.
Frequencies
| Statistics | |||||||||||||
| CEST003 DH need help with drug use | CEST032 DH urgent help needed | CEST039 DH will give up friends to solve drug problems | CEST065 DH life out of control | CEST087 DM think of ways to solve problems | CEST116 DH want life straightened out | ||||||||
| Valid | 1569 | 1565 | 1562 | 1574 | 1559 | 1558 | |||||||
| Missing | 20 | 24 | 27 | 15 | 30 | 31 | |||||||
Frequency Table
| CEST003 DH need help with drug use | |||||||||
| Frequency | Percent | Valid Percent | Cumulative Percent | ||||||
| Valid | 1 Disagree Strongly | 161 | 10.1 | 10.3 | 10.3 | ||||
| 2 Disagree | 149 | 9.4 | 9.5 | 19.8 | |||||
| 3 Uncertain | 103 | 6.5 | 6.6 | 26.3 | |||||
| 4 Agree | 582 | 36.6 | 37.1 | 63.4 | |||||
| 5 Agree Strongly | 574 | 36.1 | 36.6 | 100.0 | |||||
| Total | 1569 | 98.7 | 100.0 | ||||||
| Missing | System | 20 | 1.3 | ||||||
| Total | 1589 | 100.0 | |||||||
| CEST032 DH urgent help needed | |||||||||
| Frequency | Percent | Valid Percent | Cumulative Percent | ||||||
| Valid | 1 Disagree Strongly | 178 | 11.2 | 11.4 | 11.4 | ||||
| 2 Disagree | 271 | 17.1 | 17.3 | 28.7 | |||||
| 3 Uncertain | 157 | 9.9 | 10.0 | 38.7 | |||||
| 4 Agree | 571 | 35.9 | 36.5 | 75.2 | |||||
| 5 Agree Strongly | 388 | 24.4 | 24.8 | 100.0 | |||||
| Total | 1565 | 98.5 | 100.0 | ||||||
| Missing | System | 24 | 1.5 | ||||||
| Total | 1589 | 100.0 | |||||||
| CEST039 DH will give up friends to solve drug problems | |||||||||
| Frequency | Percent | Valid Percent | Cumulative Percent | ||||||
| Valid | 1 Disagree Strongly | 71 | 4.5 | 4.5 | 4.5 | ||||
| 2 Disagree | 59 | 3.7 | 3.8 | 8.3 | |||||
| 3 Uncertain | 120 | 7.6 | 7.7 | 16.0 | |||||
| 4 Agree | 460 | 28.9 | 29.4 | 45.5 | |||||
| 5 Agree Strongly | 852 | 53.6 | 54.5 | 100.0 | |||||
| Total | 1562 | 98.3 | 100.0 | ||||||
| Missing | System | 27 | 1.7 | ||||||
| Total | 1589 | 100.0 | |||||||
| CEST065 DH life out of control | |||||||||
| Frequency | Percent | Valid Percent | Cumulative Percent | ||||||
| Valid | 1 Disagree Strongly | 222 | 14.0 | 14.1 | 14.1 | ||||
| 2 Disagree | 412 | 25.9 | 26.2 | 40.3 | |||||
| 3 Uncertain | 152 | 9.6 | 9.7 | 49.9 | |||||
| 4 Agree | 529 | 33.3 | 33.6 | 83.5 | |||||
| 5 Agree Strongly | 259 | 16.3 | 16.5 | 100.0 | |||||
| Total | 1574 | 99.1 | 100.0 | ||||||
| Missing | System | 15 | .9 | ||||||
| Total | 1589 | 100.0 | |||||||
| CEST116 DH want life straightened out | |||||||||
| Frequency | Percent | Valid Percent | Cumulative Percent | ||||||
| Valid | 1 Disagree Strongly | .6 | .6 | .6 | |||||
| 2 Disagree | .4 | .4 | 1.0 | ||||||
| 3 Uncertain | 38 | 2.4 | 2.4 | 3.5 | |||||
| 4 Agree | 387 | 24.4 | 24.8 | 28.3 | |||||
| 5 Agree Strongly | 1117 | 70.3 | 71.7 | 100.0 | |||||
| Total | 1558 | 98.0 | 100.0 | ||||||
| Missing | System | 31 | 2.0 | ||||||
| Total | 1589 | 100.0 | |||||||
FREQUENCIES VARIABLES=CEST019 CEST026 CEST031 CEST035 CEST037 CEST062 CEST066 CEST067 CEST077
CEST083 CEST104 CEST127
/ORDER=ANALYSIS.
Frequencies
| Statistics | |||||||||||||
| CEST019 TP willing to talk about feelings | CEST026 TP made progress with drug/ alcohol problems | CEST031 TP learned to solve problems | CEST035 TP made progress toward goals | CEST037 TP always attend scheduled counseling | CEST062 TP stopped or greatly reduced drug use | CEST066 TP participate in counseling | CEST067 TP progress with feelings and behavior | CEST077 TP improved relationships because of treatment | CEST083 TP progress with emotional/ psychological issues | CEST104 TP provide honest feedback | CEST127 TP following your counselors guidance | ||
| Valid | 1572 | 1567 | 1578 | 1566 | 1569 | 1555 | 1571 | 1572 | 1565 | 1565 | 1562 | 1566 | |
| Missing | 17 | 22 | 11 | 23 | 20 | 34 | 18 | 17 | 24 | 24 | 27 | 23 | |
Frequency Table
| CEST019 TP willing to talk about feelings | |||||||||
| Frequency | Percent | Valid Percent | Cumulative Percent | ||||||
| Valid | 1 Disagree Strongly | 66 | 4.2 | 4.2 | 4.2 | ||||
| 2 Disagree | 109 | 6.9 | 6.9 | 11.1 | |||||
| 3 Uncertain | 164 | 10.3 | 10.4 | 21.6 | |||||
| 4 Agree | 675 | 42.5 | 42.9 | 64.5 | |||||
| 5 Agree Strongly | 558 | 35.1 | 35.5 | 100.0 | |||||
| Total | 1572 | 98.9 | 100.0 | ||||||
| Missing | System | 17 | 1.1 | ||||||
| Total | 1589 | 100.0 | |||||||
| CEST026 TP made progress with drug/ alcohol problems | |||||||||
| Frequency | Percent | Valid Percent | Cumulative Percent | ||||||
| Valid | 1 Disagree Strongly | 41 | 2.6 | 2.6 | 2.6 | ||||
| 2 Disagree | 27 | 1.7 | 1.7 | 4.3 | |||||
| 3 Uncertain | 126 | 7.9 | 8.0 | 12.4 | |||||
| 4 Agree | 652 | 41.0 | 41.6 | 54.0 | |||||
| 5 Agree Strongly | 721 | 45.4 | 46.0 | 100.0 | |||||
| Total | 1567 | 98.6 | 100.0 | ||||||
| Missing | System | 22 | 1.4 | ||||||
| Total | 1589 | 100.0 | |||||||
| CEST031 TP learned to solve problems | |||||||||
| Frequency | Percent | Valid Percent | Cumulative Percent | ||||||
| Valid | 1 Disagree Strongly | 29 | 1.8 | 1.8 | 1.8 | ||||
| 2 Disagree | 54 | 3.4 | 3.4 | 5.3 | |||||
| 3 Uncertain | 143 | 9.0 | 9.1 | 14.3 | |||||
| 4 Agree | 928 | 58.4 | 58.8 | 73.1 | |||||
| 5 Agree Strongly | 424 | 26.7 | 26.9 | 100.0 | |||||
| Total | 1578 | 99.3 | 100.0 | ||||||
| Missing | System | 11 | .7 | ||||||
| Total | 1589 | 100.0 | |||||||
| CEST035 TP made progress toward goals | |||||||||
| Frequency | Percent | Valid Percent | Cumulative Percent | ||||||
| Valid | 1 Disagree Strongly | 26 | 1.6 | 1.7 | 1.7 | ||||
| 2 Disagree | 40 | 2.5 | 2.6 | 4.2 | |||||
| 3 Uncertain | 106 | 6.7 | 6.8 | 11.0 | |||||
| 4 Agree | 796 | 50.1 | 50.8 | 61.8 | |||||
| 5 Agree Strongly | 598 | 37.6 | 38.2 | 100.0 | |||||
| Total | 1566 | 98.6 | 100.0 | ||||||
| Missing | System | 23 | 1.4 | ||||||
| Total | 1589 | 100.0 | |||||||
| CEST037 TP always attend scheduled counseling | |||||||||
| Frequency | Percent | Valid Percent | Cumulative Percent | ||||||
| Valid | 1 Disagree Strongly | 27 | 1.7 | 1.7 | 1.7 | ||||
| 2 Disagree | 34 | 2.1 | 2.2 | 3.9 | |||||
| 3 Uncertain | 37 | 2.3 | 2.4 | 6.2 | |||||
| 4 Agree | 638 | 40.2 | 40.7 | 46.9 | |||||
| 5 Agree Strongly | 833 | 52.4 | 53.1 | 100.0 | |||||
| Total | 1569 | 98.7 | 100.0 | ||||||
| Missing | System | 20 | 1.3 | ||||||
| Total | 1589 | 100.0 | |||||||
| CEST062 TP stopped or greatly reduced drug use | |||||||||
| Frequency | Percent | Valid Percent | Cumulative Percent | ||||||
| Valid | 1 Disagree Strongly | 56 | 3.5 | 3.6 | 3.6 | ||||
| 2 Disagree | 28 | 1.8 | 1.8 | 5.4 | |||||
| 3 Uncertain | 65 | 4.1 | 4.2 | 9.6 | |||||
| 4 Agree | 307 | 19.3 | 19.7 | 29.3 | |||||
| 5 Agree Strongly | 1099 | 69.2 | 70.7 | 100.0 | |||||
| Total | 1555 | 97.9 | 100.0 | ||||||
| Missing | System | 34 | 2.1 | ||||||
| Total | 1589 | 100.0 | |||||||
| CEST066 TP participate in counseling | |||||||||
| Frequency | Percent | Valid Percent | Cumulative Percent | ||||||
| Valid | 1 Disagree Strongly | 22 | 1.4 | 1.4 | 1.4 | ||||
| 2 Disagree | 92 | 5.8 | 5.9 | 7.3 | |||||
| 3 Uncertain | 98 | 6.2 | 6.2 | 13.5 | |||||
| 4 Agree | 837 | 52.7 | 53.3 | 66.8 | |||||
| 5 Agree Strongly | 522 | 32.9 | 33.2 | 100.0 | |||||
| Total | 1571 | 98.9 | 100.0 | ||||||
| Missing | System | 18 | 1.1 | ||||||
| Total | 1589 | 100.0 | |||||||
| CEST067 TP progress with feelings and behavior | |||||||||
| Frequency | Percent | Valid Percent | Cumulative Percent | ||||||
| Valid | 1 Disagree Strongly | 23 | 1.4 | 1.5 | 1.5 | ||||
| 2 Disagree | 23 | 1.4 | 1.5 | 2.9 | |||||
| 3 Uncertain | 88 | 5.5 | 5.6 | 8.5 | |||||
| 4 Agree | 831 | 52.3 | 52.9 | 61.4 | |||||
| 5 Agree Strongly | 607 | 38.2 | 38.6 | 100.0 | |||||
| Total | 1572 | 98.9 | 100.0 | ||||||
| Missing | System | 17 | 1.1 | ||||||
| Total | 1589 | 100.0 | |||||||
| CEST077 TP improved relationships because of treatment | |||||||||
| Frequency | Percent | Valid Percent | Cumulative Percent | ||||||
| Valid | 1 Disagree Strongly | 94 | 5.9 | 6.0 | 6.0 | ||||
| 2 Disagree | 161 | 10.1 | 10.3 | 16.3 | |||||
| 3 Uncertain | 234 | 14.7 | 15.0 | 31.2 | |||||
| 4 Agree | 679 | 42.7 | 43.4 | 74.6 | |||||
| 5 Agree Strongly | 397 | 25.0 | 25.4 | 100.0 | |||||
| Total | 1565 | 98.5 | 100.0 | ||||||
| Missing | System | 24 | 1.5 | ||||||
| Total | 1589 | 100.0 | |||||||
| CEST083 TP progress with emotional/ psychological issues | |||||||||
| Frequency | Percent | Valid Percent | Cumulative Percent | ||||||
| Valid | 1 Disagree Strongly | 34 | 2.1 | 2.2 | 2.2 | ||||
| 2 Disagree | 70 | 4.4 | 4.5 | 6.6 | |||||
| 3 Uncertain | 172 | 10.8 | 11.0 | 17.6 | |||||
| 4 Agree | 808 | 50.8 | 51.6 | 69.3 | |||||
| 5 Agree Strongly | 481 | 30.3 | 30.7 | 100.0 | |||||
| Total | 1565 | 98.5 | 100.0 | ||||||
| Missing | System | 24 | 1.5 | ||||||
| Total | 1589 | 100.0 | |||||||
| CEST104 TP provide honest feedback | |||||||||
| Frequency | Percent | Valid Percent | Cumulative Percent | ||||||
| Valid | 1 Disagree Strongly | 18 | 1.1 | 1.2 | 1.2 | ||||
| 2 Disagree | 52 | 3.3 | 3.3 | 4.5 | |||||
| 3 Uncertain | 109 | 6.9 | 7.0 | 11.5 | |||||
| 4 Agree | 847 | 53.3 | 54.2 | 65.7 | |||||
| 5 Agree Strongly | 536 | 33.7 | 34.3 | 100.0 | |||||
| Total | 1562 | 98.3 | 100.0 | ||||||
| Missing | System | 27 | 1.7 | ||||||
| Total | 1589 | 100.0 | |||||||
| CEST127 TP following your counselors guidance | |||||||||
| Frequency | Percent | Valid Percent | Cumulative Percent | ||||||
| Valid | 1 Disagree Strongly | 57 | 3.6 | 3.6 | 3.6 | ||||
| 2 Disagree | 96 | 6.0 | 6.1 | 9.8 | |||||
| 3 Uncertain | 228 | 14.3 | 14.6 | 24.3 | |||||
| 4 Agree | 863 | 54.3 | 55.1 | 79.4 | |||||
| 5 Agree Strongly | 322 | 20.3 | 20.6 | 100.0 | |||||
| Total | 1566 | 98.6 | 100.0 | ||||||
| Missing | System | 23 | 1.4 | ||||||
| Total | 1589 | 100.0 | |||||||
3. Computations of Variables
Frequencies
| Statistics | ||
| TR_C | ||
| Valid | 1513 | |
| Missing | 76 | |
| TR_C | |||||
| Frequency | Percent | Valid Percent | Cumulative Percent | ||
| Valid | .2 | .2 | .2 | ||
| .1 | .1 | .3 | |||
| .4 | .4 | .7 | |||
| 10 | .6 | .7 | 1.3 | ||
| 51 | 3.2 | 3.4 | 4.7 | ||
| 10 | 30 | 1.9 | 2.0 | 6.7 | |
| 11 | 37 | 2.3 | 2.4 | 9.1 | |
| 12 | 65 | 4.1 | 4.3 | 13.4 | |
| 13 | 94 | 5.9 | 6.2 | 19.6 | |
| 14 | 109 | 6.9 | 7.2 | 26.8 | |
| 15 | 110 | 6.9 | 7.3 | 34.1 | |
| 16 | 164 | 10.3 | 10.8 | 44.9 | |
| 17 | 156 | 9.8 | 10.3 | 55.3 | |
| 18 | 184 | 11.6 | 12.2 | 67.4 | |
| 19 | 174 | 11.0 | 11.5 | 78.9 | |
| 20 | 158 | 9.9 | 10.4 | 89.4 | |
| 21 | 123 | 7.7 | 8.1 | 97.5 | |
| 22 | 20 | 1.3 | 1.3 | 98.8 | |
| 23 | .6 | .6 | 99.4 | ||
| 24 | .3 | .3 | 99.7 | ||
| 25 | .3 | .3 | 100.0 | ||
| Total | 1513 | 95.2 | 100.0 | ||
| Missing | System | 76 | 4.8 | ||
| Total | 1589 | 100.0 | |||
Frequencies
| Statistics | ||
| TS_c | ||
| Valid | 1502 | |
| Missing | 87 | |
| TS_c | |||||
| Frequency | Percent | Valid Percent | Cumulative Percent | ||
| Valid | .4 | .5 | .5 | ||
| .1 | .1 | .5 | |||
| 15 | .9 | 1.0 | 1.5 | ||
| 10 | 20 | 1.3 | 1.3 | 2.9 | |
| 11 | 25 | 1.6 | 1.7 | 4.5 | |
| 12 | 22 | 1.4 | 1.5 | 6.0 | |
| 13 | 32 | 2.0 | 2.1 | 8.1 | |
| 14 | 44 | 2.8 | 2.9 | 11.1 | |
| 15 | 50 | 3.1 | 3.3 | 14.4 | |
| 16 | 39 | 2.5 | 2.6 | 17.0 | |
| 17 | 53 | 3.3 | 3.5 | 20.5 | |
| 18 | 84 | 5.3 | 5.6 | 26.1 | |
| 19 | 76 | 4.8 | 5.1 | 31.2 | |
| 20 | 90 | 5.7 | 6.0 | 37.2 | |
| 21 | 91 | 5.7 | 6.1 | 43.2 | |
| 22 | 88 | 5.5 | 5.9 | 49.1 | |
| 23 | 119 | 7.5 | 7.9 | 57.0 | |
| 24 | 120 | 7.6 | 8.0 | 65.0 | |
| 25 | 85 | 5.3 | 5.7 | 70.6 | |
| 26 | 88 | 5.5 | 5.9 | 76.5 | |
| 27 | 82 | 5.2 | 5.5 | 82.0 | |
| 28 | 88 | 5.5 | 5.9 | 87.8 | |
| 29 | 69 | 4.3 | 4.6 | 92.4 | |
| 30 | 38 | 2.4 | 2.5 | 94.9 | |
| 31 | 23 | 1.4 | 1.5 | 96.5 | |
| 32 | 20 | 1.3 | 1.3 | 97.8 | |
| 33 | 12 | .8 | .8 | 98.6 | |
| 34 | .6 | .6 | 99.2 | ||
| 35 | 12 | .8 | .8 | 100.0 | |
| Total | 1502 | 94.5 | 100.0 | ||
| Missing | System | 87 | 5.5 | ||
| Total | 1589 | 100.0 | |||
FREQUENCIES VARIABLES=DH_C
/ORDER=ANALYSIS.
Frequencies
| Statistics | ||
| DH_C | ||
| Valid | 1509 | |
| Missing | 80 | |
| DH_C | |||||
| Frequency | Percent | Valid Percent | Cumulative Percent | ||
| Valid | .1 | .1 | .1 | ||
| .1 | .1 | .2 | |||
| .2 | .2 | .4 | |||
| 10 | .4 | .4 | .8 | ||
| 11 | .3 | .3 | 1.1 | ||
| 12 | .4 | .5 | 1.5 | ||
| 13 | .4 | .4 | 1.9 | ||
| 14 | 13 | .8 | .9 | 2.8 | |
| 15 | 17 | 1.1 | 1.1 | 3.9 | |
| 16 | 40 | 2.5 | 2.7 | 6.6 | |
| 17 | 35 | 2.2 | 2.3 | 8.9 | |
| 18 | 53 | 3.3 | 3.5 | 12.4 | |
| 19 | 52 | 3.3 | 3.4 | 15.8 | |
| 20 | 74 | 4.7 | 4.9 | 20.7 | |
| 21 | 83 | 5.2 | 5.5 | 26.2 | |
| 22 | 91 | 5.7 | 6.0 | 32.3 | |
| 23 | 121 | 7.6 | 8.0 | 40.3 | |
| 24 | 147 | 9.3 | 9.7 | 50.0 | |
| 25 | 148 | 9.3 | 9.8 | 59.8 | |
| 26 | 160 | 10.1 | 10.6 | 70.4 | |
| 27 | 137 | 8.6 | 9.1 | 79.5 | |
| 28 | 113 | 7.1 | 7.5 | 87.0 | |
| 29 | 103 | 6.5 | 6.8 | 93.8 | |
| 30 | 93 | 5.9 | 6.2 | 100.0 | |
| Total | 1509 | 95.0 | 100.0 | ||
| Missing | System | 80 | 5.0 | ||
| Total | 1589 | 100.0 | |||
FREQUENCIES VARIABLES=TP_C
/ORDER=ANALYSIS.
Frequencies
| Statistics | ||
| TP_C | ||
| Valid | 1487 | |
| Missing | 102 | |
| TP_C | |||||
| Frequency | Percent | Valid Percent | Cumulative Percent | ||
| Valid | 12 | .1 | .1 | .1 | |
| 13 | .1 | .1 | .2 | ||
| 19 | .1 | .1 | .3 | ||
| 22 | .1 | .1 | .3 | ||
| 24 | .1 | .1 | .4 | ||
| 25 | .1 | .1 | .5 | ||
| 28 | .2 | .2 | .7 | ||
| 29 | .1 | .1 | .9 | ||
| 30 | .3 | .3 | 1.2 | ||
| 31 | .2 | .2 | 1.4 | ||
| 32 | .1 | .1 | 1.5 | ||
| 33 | .4 | .4 | 2.0 | ||
| 34 | .6 | .6 | 2.6 | ||
| 35 | .4 | .4 | 3.0 | ||
| 36 | 12 | .8 | .8 | 3.8 | |
| 37 | 14 | .9 | .9 | 4.7 | |
| 38 | 19 | 1.2 | 1.3 | 6.0 | |
| 39 | .5 | .5 | 6.5 | ||
| 40 | 15 | .9 | 1.0 | 7.5 | |
| 41 | 20 | 1.3 | 1.3 | 8.9 | |
| 42 | 29 | 1.8 | 2.0 | 10.8 | |
| 43 | 40 | 2.5 | 2.7 | 13.5 | |
| 44 | 55 | 3.5 | 3.7 | 17.2 | |
| 45 | 49 | 3.1 | 3.3 | 20.5 | |
| 46 | 70 | 4.4 | 4.7 | 25.2 | |
| 47 | 92 | 5.8 | 6.2 | 31.4 | |
| 48 | 124 | 7.8 | 8.3 | 39.7 | |
| 49 | 118 | 7.4 | 7.9 | 47.7 | |
| 50 | 96 | 6.0 | 6.5 | 54.1 | |
| 51 | 97 | 6.1 | 6.5 | 60.7 | |
| 52 | 92 | 5.8 | 6.2 | 66.8 | |
| 53 | 76 | 4.8 | 5.1 | 72.0 | |
| 54 | 58 | 3.7 | 3.9 | 75.9 | |
| 55 | 63 | 4.0 | 4.2 | 80.1 | |
| 56 | 63 | 4.0 | 4.2 | 84.3 | |
| 57 | 66 | 4.2 | 4.4 | 88.8 | |
| 58 | 62 | 3.9 | 4.2 | 92.9 | |
| 59 | 48 | 3.0 | 3.2 | 96.2 | |
| 60 | 57 | 3.6 | 3.8 | 100.0 | |
| Total | 1487 | 93.6 | 100.0 | ||
| Missing | System | 102 | 6.4 | ||
| Total | 1589 | 100.0 | |||
FACTOR
2.Factor Analysis
| Communalities | ||
| Initial | Extraction | |
| CEST006 TR need to stay in treatment | 1.000 | .468 |
| CEST013 TR solve problems in treatment | 1.000 | .676 |
| CEST014 TR treatment is not helping | 1.000 | .583 |
| CEST054 TR treatment gives you hope | 1.000 | .672 |
| CEST056 TR want to be in drug treatment | 1.000 | .625 |
| Extraction Method: Principal Component Analysis. | ||
| Total Variance Explained | |||||||
| Component | Initial Eigenvalues | Extraction Sums of Squared Loadings | |||||
| Total | % of Variance | Cumulative % | Total | % of Variance | Cumulative % | ||
| 3.025 | 60.495 | 60.495 | 3.025 | 60.495 | 60.495 | ||
| .812 | 16.237 | 76.732 | |||||
| .431 | 8.627 | 85.359 | |||||
| .390 | 7.791 | 93.150 | |||||
| .342 | 6.850 | 100.000 | |||||
| Extraction Method: Principal Component Analysis. | |||||||
| Component Matrixa | |
| Component | |
| CEST006 TR need to stay in treatment | .684 |
| CEST013 TR solve problems in treatment | .822 |
| CEST014 TR treatment is not helping | -.764 |
| CEST054 TR treatment gives you hope | .820 |
| CEST056 TR want to be in drug treatment | .791 |
| Extraction Method: Principal Component Analysis. | |
| a. 1 components extracted. | |
| Rotated Component Matrixa |
| a. Only one component was extracted. The solution cannot be rotated. |
Alter Type
| Altered Types | ||
| Interview Date | A33 | AMIN |
| Date started current treatment program | A33 | AMIN |
DATASET NAME DataSet1 WINDOW=FRONT.
Factor Analysis
| Notes | ||
| Output Created | 16-JUL-2019 10:51:50 | |
| Comments | ||
| Input | Data | C:\Users\pgibson\AppData\Local\Packages\Microsoft.MicrosoftEdge_8wekyb3d8bbwe\TempState\Downloads\Cathys data.sav |
| Active Dataset | DataSet1 | |
| Filter | <none> | |
| Weight | <none> | |
| Split File | <none> | |
| N of Rows in Working Data File | 1589 | |
| Missing Value Handling | Definition of Missing | MISSING=EXCLUDE: User-defined missing values are treated as missing. |
| Cases Used | LISTWISE: Statistics are based on cases with no missing values for any variable used. | |
| Syntax | FACTOR /VARIABLES CEST006 CEST013 CEST014 CEST054 CEST056 /MISSING LISTWISE /ANALYSIS CEST006 CEST013 CEST014 CEST054 CEST056 /PRINT INITIAL EXTRACTION ROTATION /CRITERIA MINEIGEN(1) ITERATE(25) /EXTRACTION PC /CRITERIA ITERATE(25) /ROTATION VARIMAX /METHOD=CORRELATION. | |
| Resources | Processor Time | 00:00:00.02 |
| Elapsed Time | 00:00:00.02 | |
| Maximum Memory Required | 4248 (4.148K) bytes | |
[DataSet1] C:\Users\pgibson\AppData\Local\Packages\Microsoft.MicrosoftEdge_8wekyb3d8bbwe\TempState\Downloads\Cathys data.sav
| Communalities | ||
| Initial | Extraction | |
| CEST006 TR need to stay in treatment | 1.000 | .468 |
| CEST013 TR solve problems in treatment | 1.000 | .676 |
| CEST014 TR treatment is not helping | 1.000 | .583 |
| CEST054 TR treatment gives you hope | 1.000 | .672 |
| CEST056 TR want to be in drug treatment | 1.000 | .625 |
| Extraction Method: Principal Component Analysis. | ||
| Total Variance Explained | |||||||
| Component | Initial Eigenvalues | Extraction Sums of Squared Loadings | |||||
| Total | % of Variance | Cumulative % | Total | % of Variance | Cumulative % | ||
| 3.025 | 60.495 | 60.495 | 3.025 | 60.495 | 60.495 | ||
| .812 | 16.237 | 76.732 | |||||
| .431 | 8.627 | 85.359 | |||||
| .390 | 7.791 | 93.150 | |||||
| .342 | 6.850 | 100.000 | |||||
| Extraction Method: Principal Component Analysis. | |||||||
| Component Matrixa | |
| Component | |
| CEST006 TR need to stay in treatment | .684 |
| CEST013 TR solve problems in treatment | .822 |
| CEST014 TR treatment is not helping | -.764 |
| CEST054 TR treatment gives you hope | .820 |
| CEST056 TR want to be in drug treatment | .791 |
| Extraction Method: Principal Component Analysis. | |
| a. 1 components extracted. | |
| Rotated Component Matrixa |
| a. Only one component was extracted. The solution cannot be rotated. |
Factor Analysis
| Communalities | ||
| Initial | Extraction | |
| CEST007 TS time schedules convenient | 1.000 | .366 |
| CEST011 TS program expects responsibility/self-discipline | 1.000 | .318 |
| CEST020 TS program organized/run well | 1.000 | .696 |
| CEST030 TS satisfied with program | 1.000 | .711 |
| CEST080 TS staff efficient at job | 1.000 | .621 |
| CEST115 TS personal counseling at program | 1.000 | .469 |
| CEST122 TS location is convenient | 1.000 | .089 |
| Extraction Method: Principal Component Analysis. | ||
| Total Variance Explained | |||||||
| Component | Initial Eigenvalues | Extraction Sums of Squared Loadings | |||||
| Total | % of Variance | Cumulative % | Total | % of Variance | Cumulative % | ||
| 3.271 | 46.729 | 46.729 | 3.271 | 46.729 | 46.729 | ||
| .993 | 14.187 | 60.915 | |||||
| .758 | 10.827 | 71.742 | |||||
| .713 | 10.187 | 81.929 | |||||
| .562 | 8.031 | 89.960 | |||||
| .425 | 6.068 | 96.028 | |||||
| .278 | 3.972 | 100.000 | |||||
| Extraction Method: Principal Component Analysis. | |||||||
| Component Matrixa | |
| Component | |
| CEST007 TS time schedules convenient | .605 |
| CEST011 TS program expects responsibility/self-discipline | .564 |
| CEST020 TS program organized/run well | .834 |
| CEST030 TS satisfied with program | .843 |
| CEST080 TS staff efficient at job | .788 |
| CEST115 TS personal counseling at program | .685 |
| CEST122 TS location is convenient | .298 |
| Extraction Method: Principal Component Analysis. | |
| a. 1 components extracted. | |
| Rotated Component Matrixa |
| a. Only one component was extracted. The solution cannot be rotated. |
Factor Analysis
| Communalities | ||
| Initial | Extraction | |
| CEST003 DH need help with drug use | 1.000 | .673 |
| CEST032 DH urgent help needed | 1.000 | .636 |
| CEST039 DH will give up friends to solve drug problems | 1.000 | .559 |
| CEST065 DH life out of control | 1.000 | .566 |
| CEST086 DH tired of problems caused by drugs | 1.000 | .628 |
| CEST116 DH want life straightened out | 1.000 | .656 |
| Extraction Method: Principal Component Analysis. | ||
| Total Variance Explained | |||||||||||
| Component | Initial Eigenvalues | Extraction Sums of Squared Loadings | Rotation Sums of Squared Loadings | ||||||||
| Total | % of Variance | Cumulative % | Total | % of Variance | Cumulative % | Total | % of Variance | Cumulative % | |||
| 2.610 | 43.501 | 43.501 | 2.610 | 43.501 | 43.501 | 1.926 | 32.097 | 32.097 | |||
| 1.108 | 18.459 | 61.960 | 1.108 | 18.459 | 61.960 | 1.792 | 29.862 | 61.960 | |||
| .740 | 12.337 | 74.296 | |||||||||
| .584 | 9.734 | 84.031 | |||||||||
| .536 | 8.928 | 92.958 | |||||||||
| .422 | 7.042 | 100.000 | |||||||||
| Extraction Method: Principal Component Analysis. | |||||||||||
| Component Matrixa | ||
| Component | ||
| CEST003 DH need help with drug use | .736 | .363 |
| CEST032 DH urgent help needed | .719 | .346 |
| CEST039 DH will give up friends to solve drug problems | .684 | -.302 |
| CEST065 DH life out of control | .470 | .587 |
| CEST086 DH tired of problems caused by drugs | .700 | -.371 |
| CEST116 DH want life straightened out | .611 | -.532 |
| Extraction Method: Principal Component Analysis. | ||
| a. 2 components extracted. | ||
| Rotated Component Matrixa | ||
| Component | ||
| CEST003 DH need help with drug use | .298 | .764 |
| CEST032 DH urgent help needed | .297 | .740 |
| CEST039 DH will give up friends to solve drug problems | .709 | .238 |
| CEST065 DH life out of control | -.049 | .750 |
| CEST086 DH tired of problems caused by drugs | .767 | .199 |
| CEST116 DH want life straightened out | .810 | .020 |
| Extraction Method: Principal Component Analysis. Rotation Method: Varimax with Kaiser Normalization. | ||
| a. Rotation converged in 3 iterations. | ||
| Component Transformation Matrix | ||
| Component | ||
| .738 | .675 | |
| -.675 | .738 | |
| Extraction Method: Principal Component Analysis. Rotation Method: Varimax with Kaiser Normalization. | ||
Factor Analysis
| Communalities | ||
| Initial | Extraction | |
| CEST019 TP willing to talk about feelings | 1.000 | .415 |
| CEST026 TP made progress with drug/ alcohol problems | 1.000 | .459 |
| CEST031 TP learned to solve problems | 1.000 | .500 |
| CEST035 TP made progress toward goals | 1.000 | .566 |
| CEST037 TP always attend scheduled counseling | 1.000 | .538 |
| CEST062 TP stopped or greatly reduced drug use | 1.000 | .245 |
| CEST066 TP participate in counseling | 1.000 | .572 |
| CEST067 TP progress with feelings and behavior | 1.000 | .576 |
| CEST077 TP improved relationships because of treatment | 1.000 | .435 |
| CEST083 TP progress with emotional/ psychological issues | 1.000 | .496 |
| CEST104 TP provide honest feedback | 1.000 | .514 |
| CEST127 TP following your counselors guidance | 1.000 | .366 |
| Extraction Method: Principal Component Analysis. | ||
| Total Variance Explained | |||||||||||
| Component | Initial Eigenvalues | Extraction Sums of Squared Loadings | Rotation Sums of Squared Loadings | ||||||||
| Total | % of Variance | Cumulative % | Total | % of Variance | Cumulative % | Total | % of Variance | Cumulative % | |||
| 4.678 | 38.980 | 38.980 | 4.678 | 38.980 | 38.980 | 3.375 | 28.126 | 28.126 | |||
| 1.004 | 8.370 | 47.350 | 1.004 | 8.370 | 47.350 | 2.307 | 19.224 | 47.350 | |||
| .977 | 8.138 | 55.488 | |||||||||
| .803 | 6.688 | 62.175 | |||||||||
| .695 | 5.796 | 67.971 | |||||||||
| .680 | 5.664 | 73.635 | |||||||||
| .627 | 5.228 | 78.862 | |||||||||
| .580 | 4.829 | 83.692 | |||||||||
| .540 | 4.503 | 88.195 | |||||||||
| 10 | .526 | 4.384 | 92.580 | ||||||||
| 11 | .476 | 3.970 | 96.550 | ||||||||
| 12 | .414 | 3.450 | 100.000 | ||||||||
| Extraction Method: Principal Component Analysis. | |||||||||||
| Component Matrixa | ||
| Component | ||
| CEST019 TP willing to talk about feelings | .644 | -.017 |
| CEST026 TP made progress with drug/ alcohol problems | .646 | -.203 |
| CEST031 TP learned to solve problems | .631 | -.318 |
| CEST035 TP made progress toward goals | .736 | -.154 |
| CEST037 TP always attend scheduled counseling | .494 | .543 |
| CEST062 TP stopped or greatly reduced drug use | .395 | .298 |
| CEST066 TP participate in counseling | .639 | .404 |
| CEST067 TP progress with feelings and behavior | .752 | -.104 |
| CEST077 TP improved relationships because of treatment | .590 | -.294 |
| CEST083 TP progress with emotional/ psychological issues | .645 | -.282 |
| CEST104 TP provide honest feedback | .635 | .333 |
| CEST127 TP following your counselors guidance | .603 | .057 |
| Extraction Method: Principal Component Analysis. | ||
| a. 2 components extracted. | ||
| Rotated Component Matrixa | ||
| Component | ||
| CEST019 TP willing to talk about feelings | .528 | .370 |
| CEST026 TP made progress with drug/ alcohol problems | .640 | .222 |
| CEST031 TP learned to solve problems | .696 | .121 |
| CEST035 TP made progress toward goals | .683 | .315 |
| CEST037 TP always attend scheduled counseling | .073 | .730 |
| CEST062 TP stopped or greatly reduced drug use | .140 | .475 |
| CEST066 TP participate in counseling | .273 | .705 |
| CEST067 TP progress with feelings and behavior | .666 | .364 |
| CEST077 TP improved relationships because of treatment | .649 | .115 |
| CEST083 TP progress with emotional/ psychological issues | .686 | .158 |
| CEST104 TP provide honest feedback | .312 | .646 |
| CEST127 TP following your counselors guidance | .450 | .405 |
| Extraction Method: Principal Component Analysis. Rotation Method: Varimax with Kaiser Normalization. | ||
| a. Rotation converged in 3 iterations. | ||
| Component Transformation Matrix | ||
| Component | ||
| .803 | .595 | |
| -.595 | .803 | |
| Extraction Method: Principal Component Analysis. Rotation Method: Varimax with Kaiser Normalization. | ||
4. Reliability Anlysis
Scale: ALL VARIABLES
| Case Processing Summary | ||||
| Cases | Valid | 1513 | 95.2 | |
| Excludeda | 76 | 4.8 | ||
| Total | 1589 | 100.0 | ||
| a. Listwise deletion based on all variables in the procedure. | ||||
| Reliability Statistics | |
| Cronbach's Alpha | N of Items |
| .413 | |
Reliability
Scale: ALL VARIABLES
| Case Processing Summary | ||||
| Cases | Valid | 1513 | 95.2 | |
| Excludeda | 76 | 4.8 | ||
| Total | 1589 | 100.0 | ||
| a. Listwise deletion based on all variables in the procedure. | ||||
| Reliability Statistics | |
| Cronbach's Alpha | N of Items |
| .413 | |
| Item-Total Statistics | ||||
| Scale Mean if Item Deleted | Scale Variance if Item Deleted | Corrected Item-Total Correlation | Cronbach's Alpha if Item Deleted | |
| CEST006 TR need to stay in treatment | 13.61 | 6.268 | .532 | .048 |
| CEST013 TR solve problems in treatment | 12.64 | 7.477 | .467 | .162 |
| CEST014 TR treatment is not helping | 14.13 | 16.359 | -.602 | .804 |
| CEST054 TR treatment gives you hope | 12.55 | 7.643 | .480 | .164 |
| CEST056 TR want to be in drug treatment | 13.14 | 5.947 | .610 | -.033a |
| a. The value is negative due to a negative average covariance among items. This violates reliability model assumptions. You may want to check item codings. | ||||
Reliability
Scale: ALL VARIABLES
| Case Processing Summary | ||||
| Cases | Valid | 1502 | 94.5 | |
| Excludeda | 87 | 5.5 | ||
| Total | 1589 | 100.0 | ||
| a. Listwise deletion based on all variables in the procedure. | ||||
| Reliability Statistics | |
| Cronbach's Alpha | N of Items |
| .786 | |
| Item-Total Statistics | ||||
| Scale Mean if Item Deleted | Scale Variance if Item Deleted | Corrected Item-Total Correlation | Cronbach's Alpha if Item Deleted | |
| CEST007 TS time schedules convenient | 18.77 | 24.756 | .466 | .768 |
| CEST011 TS program expects responsibility/self-discipline | 17.70 | 27.537 | .404 | .779 |
| CEST020 TS program organized/run well | 19.28 | 21.969 | .692 | .721 |
| CEST030 TS satisfied with program | 18.98 | 21.960 | .703 | .719 |
| CEST080 TS staff efficient at job | 18.92 | 23.173 | .634 | .735 |
| CEST115 TS personal counseling at program | 19.31 | 23.811 | .547 | .752 |
| CEST122 TS location is convenient | 19.51 | 26.794 | .217 | .822 |
Reliability
Scale: ALL VARIABLES
| Case Processing Summary | ||||
| Cases | Valid | 1509 | 95.0 | |
| Excludeda | 80 | 5.0 | ||
| Total | 1589 | 100.0 | ||
| a. Listwise deletion based on all variables in the procedure. | ||||
| Reliability Statistics | |
| Cronbach's Alpha | N of Items |
| .715 | |
| Item-Total Statistics | ||||
| Scale Mean if Item Deleted | Scale Variance if Item Deleted | Corrected Item-Total Correlation | Cronbach's Alpha if Item Deleted | |
| CEST003 DH need help with drug use | 20.01 | 11.410 | .589 | .627 |
| CEST032 DH urgent help needed | 20.37 | 11.393 | .562 | .638 |
| CEST039 DH will give up friends to solve drug problems | 19.56 | 13.620 | .453 | .675 |
| CEST065 DH life out of control | 20.70 | 13.182 | .331 | .724 |
| CEST086 DH tired of problems caused by drugs | 19.35 | 14.612 | .472 | .678 |
| CEST116 DH want life straightened out | 19.17 | 15.947 | .388 | .703 |
Reliability
Scale: ALL VARIABLES
| Case Processing Summary | ||||
| Cases | Valid | 1487 | 93.6 | |
| Excludeda | 102 | 6.4 | ||
| Total | 1589 | 100.0 | ||
| a. Listwise deletion based on all variables in the procedure. | ||||
| Reliability Statistics | |
| Cronbach's Alpha | N of Items |
| .848 | 12 |
| Item-Total Statistics | ||||
| Scale Mean if Item Deleted | Scale Variance if Item Deleted | Corrected Item-Total Correlation | Cronbach's Alpha if Item Deleted | |
| CEST019 TP willing to talk about feelings | 45.67 | 34.574 | .546 | .835 |
| CEST026 TP made progress with drug/ alcohol problems | 45.39 | 35.893 | .557 | .834 |
| CEST031 TP learned to solve problems | 45.60 | 36.777 | .525 | .836 |
| CEST035 TP made progress toward goals | 45.45 | 35.648 | .643 | .829 |
| CEST037 TP always attend scheduled counseling | 45.24 | 37.964 | .405 | .844 |
| CEST062 TP stopped or greatly reduced drug use | 45.14 | 37.921 | .320 | .851 |
| CEST066 TP participate in counseling | 45.56 | 36.038 | .544 | .835 |
| CEST067 TP progress with feelings and behavior | 45.40 | 35.965 | .657 | .829 |
| CEST077 TP improved relationships because of treatment | 45.94 | 34.651 | .495 | .840 |
| CEST083 TP progress with emotional/ psychological issues | 45.62 | 35.837 | .545 | .835 |
| CEST104 TP provide honest feedback | 45.50 | 36.685 | .539 | .836 |
| CEST127 TP following your counselors guidance | 45.82 | 35.777 | .512 | .837 |
Frequencies
| Statistics | ||
| TreatmentSatisfaction COMPUTE TreatmentSatisfaction=CEST007 + CEST011 + CEST020 + CEST030 + CEST080 + CEST115 + CEST122 | ||
| Valid | 1502 | |
| Missing | 87 | |
| TreatmentSatisfaction COMPUTE TreatmentSatisfaction=CEST007 + CEST011 + CEST020 + CEST030 + CEST080 + CEST115 + CEST122 | |||||
| Frequency | Percent | Valid Percent | Cumulative Percent | ||
| Valid | .4 | .5 | .5 | ||
| .1 | .1 | .5 | |||
| 15 | .9 | 1.0 | 1.5 | ||
| 10 | 20 | 1.3 | 1.3 | 2.9 | |
| 11 | 25 | 1.6 | 1.7 | 4.5 | |
| 12 | 22 | 1.4 | 1.5 | 6.0 | |
| 13 | 32 | 2.0 | 2.1 | 8.1 | |
| 14 | 44 | 2.8 | 2.9 | 11.1 | |
| 15 | 50 | 3.1 | 3.3 | 14.4 | |
| 16 | 39 | 2.5 | 2.6 | 17.0 | |
| 17 | 53 | 3.3 | 3.5 | 20.5 | |
| 18 | 84 | 5.3 | 5.6 | 26.1 | |
| 19 | 76 | 4.8 | 5.1 | 31.2 | |
| 20 | 90 | 5.7 | 6.0 | 37.2 | |
| 21 | 91 | 5.7 | 6.1 | 43.2 | |
| 22 | 88 | 5.5 | 5.9 | 49.1 | |
| 23 | 119 | 7.5 | 7.9 | 57.0 | |
| 24 | 120 | 7.6 | 8.0 | 65.0 | |
| 25 | 85 | 5.3 | 5.7 | 70.6 | |
| 26 | 88 | 5.5 | 5.9 | 76.5 | |
| 27 | 82 | 5.2 | 5.5 | 82.0 | |
| 28 | 88 | 5.5 | 5.9 | 87.8 | |
| 29 | 69 | 4.3 | 4.6 | 92.4 | |
| 30 | 38 | 2.4 | 2.5 | 94.9 | |
| 31 | 23 | 1.4 | 1.5 | 96.5 | |
| 32 | 20 | 1.3 | 1.3 | 97.8 | |
| 33 | 12 | .8 | .8 | 98.6 | |
| 34 | .6 | .6 | 99.2 | ||
| 35 | 12 | .8 | .8 | 100.0 | |
| Total | 1502 | 94.5 | 100.0 | ||
| Missing | System | 87 | 5.5 | ||
| Total | 1589 | 100.0 | |||
5. Computations
Frequencies
| Statistics | ||
| TreatmentReadiness COMPUTE TreatmentReadiness=CEST006 + CEST013 + CEST014 + CEST054 + CEST056 | ||
| Valid | 1513 | |
| Missing | 76 | |
| TreatmentReadiness COMPUTE TreatmentReadiness=CEST006 + CEST013 + CEST014 + CEST054 + CEST056 | |||||
| Frequency | Percent | Valid Percent | Cumulative Percent | ||
| Valid | .2 | .2 | .2 | ||
| .1 | .1 | .3 | |||
| .4 | .4 | .7 | |||
| 10 | .6 | .7 | 1.3 | ||
| 51 | 3.2 | 3.4 | 4.7 | ||
| 10 | 30 | 1.9 | 2.0 | 6.7 | |
| 11 | 37 | 2.3 | 2.4 | 9.1 | |
| 12 | 65 | 4.1 | 4.3 | 13.4 | |
| 13 | 94 | 5.9 | 6.2 | 19.6 | |
| 14 | 109 | 6.9 | 7.2 | 26.8 | |
| 15 | 110 | 6.9 | 7.3 | 34.1 | |
| 16 | 164 | 10.3 | 10.8 | 44.9 | |
| 17 | 156 | 9.8 | 10.3 | 55.3 | |
| 18 | 184 | 11.6 | 12.2 | 67.4 | |
| 19 | 174 | 11.0 | 11.5 | 78.9 | |
| 20 | 158 | 9.9 | 10.4 | 89.4 | |
| 21 | 123 | 7.7 | 8.1 | 97.5 | |
| 22 | 20 | 1.3 | 1.3 | 98.8 | |
| 23 | .6 | .6 | 99.4 | ||
| 24 | .3 | .3 | 99.7 | ||
| 25 | .3 | .3 | 100.0 | ||
| Total | 1513 | 95.2 | 100.0 | ||
| Missing | System | 76 | 4.8 | ||
| Total | 1589 | 100.0 | |||
Frequencies
| Statistics | ||
| DesiretoHelp COMPUTE DesiretoHelp=CEST003 + CEST032 + CEST039 + CEST065 + CEST086 + CEST116 | ||
| Valid | 1509 | |
| Missing | 80 | |
| DesiretoHelp COMPUTE DesiretoHelp=CEST003 + CEST032 + CEST039 + CEST065 + CEST086 + CEST116 | |||||
| Frequency | Percent | Valid Percent | Cumulative Percent | ||
| Valid | .1 | .1 | .1 | ||
| .1 | .1 | .2 | |||
| .2 | .2 | .4 | |||
| 10 | .4 | .4 | .8 | ||
| 11 | .3 | .3 | 1.1 | ||
| 12 | .4 | .5 | 1.5 | ||
| 13 | .4 | .4 | 1.9 | ||
| 14 | 13 | .8 | .9 | 2.8 | |
| 15 | 17 | 1.1 | 1.1 | 3.9 | |
| 16 | 40 | 2.5 | 2.7 | 6.6 | |
| 17 | 35 | 2.2 | 2.3 | 8.9 | |
| 18 | 53 | 3.3 | 3.5 | 12.4 | |
| 19 | 52 | 3.3 | 3.4 | 15.8 | |
| 20 | 74 | 4.7 | 4.9 | 20.7 | |
| 21 | 83 | 5.2 | 5.5 | 26.2 | |
| 22 | 91 | 5.7 | 6.0 | 32.3 | |
| 23 | 121 | 7.6 | 8.0 | 40.3 | |
| 24 | 147 | 9.3 | 9.7 | 50.0 | |
| 25 | 148 | 9.3 | 9.8 | 59.8 | |
| 26 | 160 | 10.1 | 10.6 | 70.4 | |
| 27 | 137 | 8.6 | 9.1 | 79.5 | |
| 28 | 113 | 7.1 | 7.5 | 87.0 | |
| 29 | 103 | 6.5 | 6.8 | 93.8 | |
| 30 | 93 | 5.9 | 6.2 | 100.0 | |
| Total | 1509 | 95.0 | 100.0 | ||
| Missing | System | 80 | 5.0 | ||
| Total | 1589 | 100.0 | |||
Frequencies
| Statistics | ||
| TreatmentParticipation COMPUTE TreatmentParticipation=CEST019 + CEST026 + CEST031 + CEST035 + CEST037 + CEST062 + CEST066 + CEST067 + CEST077 + CEST083 + CEST104 + CEST127 | ||
| Valid | 1487 | |
| Missing | 102 | |
| TreatmentParticipation COMPUTE TreatmentParticipation=CEST019 + CEST026 + CEST031 + CEST035 + CEST037 + CEST062 + CEST066 + CEST067 + CEST077 + CEST083 + CEST104 + CEST127 | |||||
| Frequency | Percent | Valid Percent | Cumulative Percent | ||
| Valid | 12 | .1 | .1 | .1 | |
| 13 | .1 | .1 | .2 | ||
| 19 | .1 | .1 | .3 | ||
| 22 | .1 | .1 | .3 | ||
| 24 | .1 | .1 | .4 | ||
| 25 | .1 | .1 | .5 | ||
| 28 | .2 | .2 | .7 | ||
| 29 | .1 | .1 | .9 | ||
| 30 | .3 | .3 | 1.2 | ||
| 31 | .2 | .2 | 1.4 | ||
| 32 | .1 | .1 | 1.5 | ||
| 33 | .4 | .4 | 2.0 | ||
| 34 | .6 | .6 | 2.6 | ||
| 35 | .4 | .4 | 3.0 | ||
| 36 | 12 | .8 | .8 | 3.8 | |
| 37 | 14 | .9 | .9 | 4.7 | |
| 38 | 19 | 1.2 | 1.3 | 6.0 | |
| 39 | .5 | .5 | 6.5 | ||
| 40 | 15 | .9 | 1.0 | 7.5 | |
| 41 | 20 | 1.3 | 1.3 | 8.9 | |
| 42 | 29 | 1.8 | 2.0 | 10.8 | |
| 43 | 40 | 2.5 | 2.7 | 13.5 | |
| 44 | 55 | 3.5 | 3.7 | 17.2 | |
| 45 | 49 | 3.1 | 3.3 | 20.5 | |
| 46 | 70 | 4.4 | 4.7 | 25.2 | |
| 47 | 92 | 5.8 | 6.2 | 31.4 | |
| 48 | 124 | 7.8 | 8.3 | 39.7 | |
| 49 | 118 | 7.4 | 7.9 | 47.7 | |
| 50 | 96 | 6.0 | 6.5 | 54.1 | |
| 51 | 97 | 6.1 | 6.5 | 60.7 | |
| 52 | 92 | 5.8 | 6.2 | 66.8 | |
| 53 | 76 | 4.8 | 5.1 | 72.0 | |
| 54 | 58 | 3.7 | 3.9 | 75.9 | |
| 55 | 63 | 4.0 | 4.2 | 80.1 | |
| 56 | 63 | 4.0 | 4.2 | 84.3 | |
| 57 | 66 | 4.2 | 4.4 | 88.8 | |
| 58 | 62 | 3.9 | 4.2 | 92.9 | |
| 59 | 48 | 3.0 | 3.2 | 96.2 | |
| 60 | 57 | 3.6 | 3.8 | 100.0 | |
| Total | 1487 | 93.6 | 100.0 | ||
| Missing | System | 102 | 6.4 | ||
| Total | 1589 | 100.0 | |||
Frequencies
| Statistics | ||
| TreatmentReadiness COMPUTE Treatmentreadiness=CEST006 + CEST013 + CEST054 + CEST056 | ||
| Valid | 1523 | |
| Missing | 66 | |
| TreatmentReadiness COMPUTE Treatmentreadiness=CEST006 + CEST013 + CEST054 + CEST056 | |||||
| Frequency | Percent | Valid Percent | Cumulative Percent | ||
| Valid | 38 | 2.4 | 2.5 | 2.5 | |
| 20 | 1.3 | 1.3 | 3.8 | ||
| 27 | 1.7 | 1.8 | 5.6 | ||
| 37 | 2.3 | 2.4 | 8.0 | ||
| 49 | 3.1 | 3.2 | 11.2 | ||
| 44 | 2.8 | 2.9 | 14.1 | ||
| 10 | 66 | 4.2 | 4.3 | 18.5 | |
| 11 | 89 | 5.6 | 5.8 | 24.3 | |
| 12 | 101 | 6.4 | 6.6 | 30.9 | |
| 13 | 129 | 8.1 | 8.5 | 39.4 | |
| 14 | 111 | 7.0 | 7.3 | 46.7 | |
| 15 | 128 | 8.1 | 8.4 | 55.1 | |
| 16 | 189 | 11.9 | 12.4 | 67.5 | |
| 17 | 153 | 9.6 | 10.0 | 77.5 | |
| 18 | 137 | 8.6 | 9.0 | 86.5 | |
| 19 | 109 | 6.9 | 7.2 | 93.7 | |
| 20 | 96 | 6.0 | 6.3 | 100.0 | |
| Total | 1523 | 95.8 | 100.0 | ||
| Missing | System | 66 | 4.2 | ||
| Total | 1589 | 100.0 | |||
Appendix B
Data Analysis Output
Frequencies
| Statistics Univariate Analysis | |||||||||||||
| CSEX Client Gender | LIVEHAPY Happy with spouse or primary partner | TreatmentSatisfaction COMPUTE TreatmentSatisfaction=CEST007 + CEST011 + CEST020 + CEST030 + CEST080 + CEST115 + CEST122 | TreatmentReadiness COMPUTE Treatmentreadiness=CEST006 + CEST013 + CEST054 + CEST056 | DesiretoHelp COMPUTE DesiretoHelp=CEST003 + CEST032 + CEST039 + CEST065 + CEST086 + CEST116 | TreatmentParticipation COMPUTE TreatmentParticipation=CEST019 + CEST026 + CEST031 + CEST035 + CEST037 + CEST062 + CEST066 + CEST067 + CEST077 + CEST083 + CEST104 + CEST127 | ||||||||
| Valid | 1586 | 1392 | 1502 | 1523 | 1509 | 1487 | |||||||
| Missing | 197 | 87 | 66 | 80 | 102 | ||||||||
| Mean | 1.44 | 3.62 | 22.08 | 14.15 | 23.83 | 49.67 | |||||||
| Median | 1.00 | 4.00 | 23.00 | 15.00 | 24.00 | 50.00 | |||||||
| Mode | 24 | 16 | 26 | 48 | |||||||||
| Std. Deviation | .496 | 1.333 | 5.650 | 4.038 | 4.267 | 6.514 | |||||||
| Minimum | 12 | ||||||||||||
| Maximum | 35 | 20 | 30 | 60 | |||||||||
Frequency Table
| CSEX Client Gender | |||||
| Frequency | Percent | Valid Percent | Cumulative Percent | ||
| Valid | 1 Male | 891 | 56.1 | 56.2 | 56.2 |
| 2 Female | 695 | 43.7 | 43.8 | 100.0 | |
| Total | 1586 | 99.8 | 100.0 | ||
| Missing | -8 Blank | .2 | |||
| Total | 1589 | 100.0 | |||
| LIVEHAPY Happy with spouse or primary partner | |||||
| Frequency | Percent | Valid Percent | Cumulative Percent | ||
| Valid | 1 very unhappy | 174 | 11.0 | 12.5 | 12.5 |
| 2 somewhat unhappy | 131 | 8.2 | 9.4 | 21.9 | |
| 3 not sure | 168 | 10.6 | 12.1 | 34.0 | |
| 4 somewhat happy | 500 | 31.5 | 35.9 | 69.9 | |
| 5 very happy | 419 | 26.4 | 30.1 | 100.0 | |
| Total | 1392 | 87.6 | 100.0 | ||
| Missing | -8 blank | 197 | 12.4 | ||
| Total | 1589 | 100.0 | |||
| TreatmentSatisfaction COMPUTE TreatmentSatisfaction=CEST007 + CEST011 + CEST020 + CEST030 + CEST080 + CEST115 + CEST122 | |||||
| Frequency | Percent | Valid Percent | Cumulative Percent | ||
| Valid | .4 | .5 | .5 | ||
| .1 | .1 | .5 | |||
| 15 | .9 | 1.0 | 1.5 | ||
| 10 | 20 | 1.3 | 1.3 | 2.9 | |
| 11 | 25 | 1.6 | 1.7 | 4.5 | |
| 12 | 22 | 1.4 | 1.5 | 6.0 | |
| 13 | 32 | 2.0 | 2.1 | 8.1 | |
| 14 | 44 | 2.8 | 2.9 | 11.1 | |
| 15 | 50 | 3.1 | 3.3 | 14.4 | |
| 16 | 39 | 2.5 | 2.6 | 17.0 | |
| 17 | 53 | 3.3 | 3.5 | 20.5 | |
| 18 | 84 | 5.3 | 5.6 | 26.1 | |
| 19 | 76 | 4.8 | 5.1 | 31.2 | |
| 20 | 90 | 5.7 | 6.0 | 37.2 | |
| 21 | 91 | 5.7 | 6.1 | 43.2 | |
| 22 | 88 | 5.5 | 5.9 | 49.1 | |
| 23 | 119 | 7.5 | 7.9 | 57.0 | |
| 24 | 120 | 7.6 | 8.0 | 65.0 | |
| 25 | 85 | 5.3 | 5.7 | 70.6 | |
| 26 | 88 | 5.5 | 5.9 | 76.5 | |
| 27 | 82 | 5.2 | 5.5 | 82.0 | |
| 28 | 88 | 5.5 | 5.9 | 87.8 | |
| 29 | 69 | 4.3 | 4.6 | 92.4 | |
| 30 | 38 | 2.4 | 2.5 | 94.9 | |
| 31 | 23 | 1.4 | 1.5 | 96.5 | |
| 32 | 20 | 1.3 | 1.3 | 97.8 | |
| 33 | 12 | .8 | .8 | 98.6 | |
| 34 | .6 | .6 | 99.2 | ||
| 35 | 12 | .8 | .8 | 100.0 | |
| Total | 1502 | 94.5 | 100.0 | ||
| Missing | System | 87 | 5.5 | ||
| Total | 1589 | 100.0 | |||
| TreatmentReadiness COMPUTE Treatmentreadiness=CEST006 + CEST013 + CEST054 + CEST056 | |||||
| Frequency | Percent | Valid Percent | Cumulative Percent | ||
| Valid | 38 | 2.4 | 2.5 | 2.5 | |
| 20 | 1.3 | 1.3 | 3.8 | ||
| 27 | 1.7 | 1.8 | 5.6 | ||
| 37 | 2.3 | 2.4 | 8.0 | ||
| 49 | 3.1 | 3.2 | 11.2 | ||
| 44 | 2.8 | 2.9 | 14.1 | ||
| 10 | 66 | 4.2 | 4.3 | 18.5 | |
| 11 | 89 | 5.6 | 5.8 | 24.3 | |
| 12 | 101 | 6.4 | 6.6 | 30.9 | |
| 13 | 129 | 8.1 | 8.5 | 39.4 | |
| 14 | 111 | 7.0 | 7.3 | 46.7 | |
| 15 | 128 | 8.1 | 8.4 | 55.1 | |
| 16 | 189 | 11.9 | 12.4 | 67.5 | |
| 17 | 153 | 9.6 | 10.0 | 77.5 | |
| 18 | 137 | 8.6 | 9.0 | 86.5 | |
| 19 | 109 | 6.9 | 7.2 | 93.7 | |
| 20 | 96 | 6.0 | 6.3 | 100.0 | |
| Total | 1523 | 95.8 | 100.0 | ||
| Missing | System | 66 | 4.2 | ||
| Total | 1589 | 100.0 | |||
| DesiretoHelp COMPUTE DesiretoHelp=CEST003 + CEST032 + CEST039 + CEST065 + CEST086 + CEST116 | |||||
| Frequency | Percent | Valid Percent | Cumulative Percent | ||
| Valid | .1 | .1 | .1 | ||
| .1 | .1 | .2 | |||
| .2 | .2 | .4 | |||
| 10 | .4 | .4 | .8 | ||
| 11 | .3 | .3 | 1.1 | ||
| 12 | .4 | .5 | 1.5 | ||
| 13 | .4 | .4 | 1.9 | ||
| 14 | 13 | .8 | .9 | 2.8 | |
| 15 | 17 | 1.1 | 1.1 | 3.9 | |
| 16 | 40 | 2.5 | 2.7 | 6.6 | |
| 17 | 35 | 2.2 | 2.3 | 8.9 | |
| 18 | 53 | 3.3 | 3.5 | 12.4 | |
| 19 | 52 | 3.3 | 3.4 | 15.8 | |
| 20 | 74 | 4.7 | 4.9 | 20.7 | |
| 21 | 83 | 5.2 | 5.5 | 26.2 | |
| 22 | 91 | 5.7 | 6.0 | 32.3 | |
| 23 | 121 | 7.6 | 8.0 | 40.3 | |
| 24 | 147 | 9.3 | 9.7 | 50.0 | |
| 25 | 148 | 9.3 | 9.8 | 59.8 | |
| 26 | 160 | 10.1 | 10.6 | 70.4 | |
| 27 | 137 | 8.6 | 9.1 | 79.5 | |
| 28 | 113 | 7.1 | 7.5 | 87.0 | |
| 29 | 103 | 6.5 | 6.8 | 93.8 | |
| 30 | 93 | 5.9 | 6.2 | 100.0 | |
| Total | 1509 | 95.0 | 100.0 | ||
| Missing | System | 80 | 5.0 | ||
| Total | 1589 | 100.0 | |||
| TreatmentParticipation COMPUTE TreatmentParticipation=CEST019 + CEST026 + CEST031 + CEST035 + CEST037 + CEST062 + CEST066 + CEST067 + CEST077 + CEST083 + CEST104 + CEST127 | |||||
| Frequency | Percent | Valid Percent | Cumulative Percent | ||
| Valid | 12 | .1 | .1 | .1 | |
| 13 | .1 | .1 | .2 | ||
| 19 | .1 | .1 | .3 | ||
| 22 | .1 | .1 | .3 | ||
| 24 | .1 | .1 | .4 | ||
| 25 | .1 | .1 | .5 | ||
| 28 | .2 | .2 | .7 | ||
| 29 | .1 | .1 | .9 | ||
| 30 | .3 | .3 | 1.2 | ||
| 31 | .2 | .2 | 1.4 | ||
| 32 | .1 | .1 | 1.5 | ||
| 33 | .4 | .4 | 2.0 | ||
| 34 | .6 | .6 | 2.6 | ||
| 35 | .4 | .4 | 3.0 | ||
| 36 | 12 | .8 | .8 | 3.8 | |
| 37 | 14 | .9 | .9 | 4.7 | |
| 38 | 19 | 1.2 | 1.3 | 6.0 | |
| 39 | .5 | .5 | 6.5 | ||
| 40 | 15 | .9 | 1.0 | 7.5 | |
| 41 | 20 | 1.3 | 1.3 | 8.9 | |
| 42 | 29 | 1.8 | 2.0 | 10.8 | |
| 43 | 40 | 2.5 | 2.7 | 13.5 | |
| 44 | 55 | 3.5 | 3.7 | 17.2 | |
| 45 | 49 | 3.1 | 3.3 | 20.5 | |
| 46 | 70 | 4.4 | 4.7 | 25.2 | |
| 47 | 92 | 5.8 | 6.2 | 31.4 | |
| 48 | 124 | 7.8 | 8.3 | 39.7 | |
| 49 | 118 | 7.4 | 7.9 | 47.7 | |
| 50 | 96 | 6.0 | 6.5 | 54.1 | |
| 51 | 97 | 6.1 | 6.5 | 60.7 | |
| 52 | 92 | 5.8 | 6.2 | 66.8 | |
| 53 | 76 | 4.8 | 5.1 | 72.0 | |
| 54 | 58 | 3.7 | 3.9 | 75.9 | |
| 55 | 63 | 4.0 | 4.2 | 80.1 | |
| 56 | 63 | 4.0 | 4.2 | 84.3 | |
| 57 | 66 | 4.2 | 4.4 | 88.8 | |
| 58 | 62 | 3.9 | 4.2 | 92.9 | |
| 59 | 48 | 3.0 | 3.2 | 96.2 | |
| 60 | 57 | 3.6 | 3.8 | 100.0 | |
| Total | 1487 | 93.6 | 100.0 | ||
| Missing | System | 102 | 6.4 | ||
| Total | 1589 | 100.0 | |||
Correlations
| Correlations | |||||||||
| TreatmentSatisfaction COMPUTE TreatmentSatisfaction=CEST007 + CEST011 + CEST020 + CEST030 + CEST080 + CEST115 + CEST122 | TreatmentReadiness COMPUTE Treatmentreadiness=CEST006 + CEST013 + CEST054 + CEST056 | DesiretoHelp COMPUTE DesiretoHelp=CEST003 + CEST032 + CEST039 + CEST065 + CEST086 + CEST116 | TreatmentParticipation COMPUTE TreatmentParticipation=CEST019 + CEST026 + CEST031 + CEST035 + CEST037 + CEST062 + CEST066 + CEST067 + CEST077 + CEST083 + CEST104 + CEST127 | ||||||
| TreatmentSatisfaction COMPUTE TreatmentSatisfaction=CEST007 + CEST011 + CEST020 + CEST030 + CEST080 + CEST115 + CEST122 | Pearson Correlation | .620** | .374** | .466** | |||||
| Sig. (2-tailed) | .000 | .000 | .000 | ||||||
| 1502 | 1465 | 1466 | 1445 | ||||||
| TreatmentReadiness COMPUTE Treatmentreadiness=CEST006 + CEST013 + CEST054 + CEST056 | Pearson Correlation | .620** | .706** | .536** | |||||
| Sig. (2-tailed) | .000 | .000 | .000 | ||||||
| 1465 | 1523 | 1476 | 1456 | ||||||
| DesiretoHelp COMPUTE DesiretoHelp=CEST003 + CEST032 + CEST039 + CEST065 + CEST086 + CEST116 | Pearson Correlation | .374** | .706** | .501** | |||||
| Sig. (2-tailed) | .000 | .000 | .000 | ||||||
| 1466 | 1476 | 1509 | 1456 | ||||||
| TreatmentParticipation COMPUTE TreatmentParticipation=CEST019 + CEST026 + CEST031 + CEST035 + CEST037 + CEST062 + CEST066 + CEST067 + CEST077 + CEST083 + CEST104 + CEST127 | Pearson Correlation | .466** | .536** | .501** | |||||
| Sig. (2-tailed) | .000 | .000 | .000 | ||||||
| 1445 | 1456 | 1456 | 1487 | ||||||
| **. Correlation is significant at the 0.01 level (2-tailed). | |||||||||
T-Test
| Group Statistics | |||||
| CSEX Client Gender | Mean | Std. Deviation | Std. Error Mean | ||
| TreatmentSatisfaction COMPUTE TreatmentSatisfaction=CEST007 + CEST011 + CEST020 + CEST030 + CEST080 + CEST115 + CEST122 | 1 Male | 831 | 21.83 | 5.883 | .204 |
| 2 Female | 669 | 22.41 | 5.339 | .206 | |
| TreatmentReadiness COMPUTE Treatmentreadiness=CEST006 + CEST013 + CEST054 + CEST056 | 1 Male | 852 | 13.46 | 4.220 | .145 |
| 2 Female | 669 | 15.04 | 3.603 | .139 | |
| DesiretoHelp COMPUTE DesiretoHelp=CEST003 + CEST032 + CEST039 + CEST065 + CEST086 + CEST116 | 1 Male | 838 | 22.76 | 4.377 | .151 |
| 2 Female | 669 | 25.18 | 3.707 | .143 | |
| TreatmentParticipation COMPUTE TreatmentParticipation=CEST019 + CEST026 + CEST031 + CEST035 + CEST037 + CEST062 + CEST066 + CEST067 + CEST077 + CEST083 + CEST104 + CEST127 | 1 Male | 833 | 48.75 | 6.977 | .242 |
| 2 Female | 652 | 50.86 | 5.659 | .222 | |
| Independent Samples Test | ||||||||||
| Levene's Test for Equality of Variances | t-test for Equality of Means | |||||||||
| Sig. | df | Sig. (2-tailed) | Mean Difference | Std. Error Difference | 95% Confidence Interval of the Difference | |||||
| Lower | Upper | |||||||||
| TreatmentSatisfaction COMPUTE TreatmentSatisfaction=CEST007 + CEST011 + CEST020 + CEST030 + CEST080 + CEST115 + CEST122 | Equal variances assumed | 7.311 | .007 | -1.976 | 1498 | .048 | -.580 | .293 | -1.155 | -.004 |
| Equal variances not assumed | -1.997 | 1476.642 | .046 | -.580 | .290 | -1.149 | -.010 | |||
| TreatmentReadiness COMPUTE Treatmentreadiness=CEST006 + CEST013 + CEST054 + CEST056 | Equal variances assumed | 26.138 | .000 | -7.733 | 1519 | .000 | -1.582 | .205 | -1.984 | -1.181 |
| Equal variances not assumed | -7.881 | 1508.375 | .000 | -1.582 | .201 | -1.976 | -1.188 | |||
| DesiretoHelp COMPUTE DesiretoHelp=CEST003 + CEST032 + CEST039 + CEST065 + CEST086 + CEST116 | Equal variances assumed | 19.900 | .000 | -11.387 | 1505 | .000 | -2.417 | .212 | -2.833 | -2.000 |
| Equal variances not assumed | -11.599 | 1499.706 | .000 | -2.417 | .208 | -2.825 | -2.008 | |||
| TreatmentParticipation COMPUTE TreatmentParticipation=CEST019 + CEST026 + CEST031 + CEST035 + CEST037 + CEST062 + CEST066 + CEST067 + CEST077 + CEST083 + CEST104 + CEST127 | Equal variances assumed | 11.879 | .001 | -6.257 | 1483 | .000 | -2.104 | .336 | -2.764 | -1.445 |
| Equal variances not assumed | -6.417 | 1481.114 | .000 | -2.104 | .328 | -2.748 | -1.461 | |||
ONEWAY TreatmentSatisfaction TreatmentReadiness DesiretoHelp TreatmentParticipation BY LIVEHAPY
/STATISTICS DESCRIPTIVES
/MISSING ANALYSIS.
Oneway
| Descriptives | |||||||||
| Mean | Std. Deviation | Std. Error | 95% Confidence Interval for Mean | Minimum | Maximum | ||||
| Lower Bound | Upper Bound | ||||||||
| TreatmentSatisfaction COMPUTE TreatmentSatisfaction=CEST007 + CEST011 + CEST020 + CEST030 + CEST080 + CEST115 + CEST122 | 1 very unhappy | 163 | 22.04 | 6.140 | .481 | 21.09 | 22.99 | 35 | |
| 2 somewhat unhappy | 121 | 22.32 | 5.774 | .525 | 21.28 | 23.36 | 34 | ||
| 3 not sure | 164 | 21.94 | 5.540 | .433 | 21.08 | 22.79 | 10 | 35 | |
| 4 somewhat happy | 482 | 22.43 | 5.141 | .234 | 21.97 | 22.89 | 35 | ||
| 5 very happy | 387 | 22.06 | 6.047 | .307 | 21.46 | 22.67 | 35 | ||
| Total | 1317 | 22.20 | 5.648 | .156 | 21.90 | 22.51 | 35 | ||
| TreatmentReadiness COMPUTE Treatmentreadiness=CEST006 + CEST013 + CEST054 + CEST056 | 1 very unhappy | 162 | 13.78 | 4.526 | .356 | 13.08 | 14.49 | 20 | |
| 2 somewhat unhappy | 127 | 14.85 | 3.797 | .337 | 14.18 | 15.52 | 20 | ||
| 3 not sure | 164 | 14.30 | 3.844 | .300 | 13.71 | 14.90 | 20 | ||
| 4 somewhat happy | 488 | 14.40 | 3.906 | .177 | 14.05 | 14.75 | 20 | ||
| 5 very happy | 394 | 13.74 | 4.139 | .209 | 13.33 | 14.15 | 20 | ||
| Total | 1335 | 14.16 | 4.049 | .111 | 13.94 | 14.38 | 20 | ||
| DesiretoHelp COMPUTE DesiretoHelp=CEST003 + CEST032 + CEST039 + CEST065 + CEST086 + CEST116 | 1 very unhappy | 160 | 23.56 | 4.855 | .384 | 22.80 | 24.31 | 30 | |
| 2 somewhat unhappy | 124 | 24.93 | 3.978 | .357 | 24.22 | 25.63 | 30 | ||
| 3 not sure | 163 | 24.53 | 4.347 | .340 | 23.86 | 25.20 | 11 | 30 | |
| 4 somewhat happy | 484 | 24.08 | 3.994 | .182 | 23.73 | 24.44 | 10 | 30 | |
| 5 very happy | 391 | 22.88 | 4.367 | .221 | 22.45 | 23.32 | 30 | ||
| Total | 1322 | 23.80 | 4.308 | .118 | 23.57 | 24.03 | 30 | ||
| TreatmentParticipation COMPUTE TreatmentParticipation=CEST019 + CEST026 + CEST031 + CEST035 + CEST037 + CEST062 + CEST066 + CEST067 + CEST077 + CEST083 + CEST104 + CEST127 | 1 very unhappy | 159 | 49.37 | 8.096 | .642 | 48.10 | 50.64 | 12 | 60 |
| 2 somewhat unhappy | 121 | 50.06 | 7.002 | .637 | 48.80 | 51.32 | 13 | 60 | |
| 3 not sure | 160 | 49.23 | 5.963 | .471 | 48.29 | 50.16 | 33 | 60 | |
| 4 somewhat happy | 475 | 49.59 | 6.039 | .277 | 49.05 | 50.14 | 22 | 60 | |
| 5 very happy | 391 | 49.91 | 6.699 | .339 | 49.25 | 50.58 | 19 | 60 | |
| Total | 1306 | 49.66 | 6.596 | .183 | 49.30 | 50.02 | 12 | 60 | |
| ANOVA | |||||||||||
| Sum of Squares | df | Mean Square | Sig. | ||||||||
| TreatmentSatisfaction COMPUTE TreatmentSatisfaction=CEST007 + CEST011 + CEST020 + CEST030 + CEST080 + CEST115 + CEST122 | Between Groups | 49.285 | 12.321 | .385 | .819 | ||||||
| Within Groups | 41936.990 | 1312 | 31.964 | ||||||||
| Total | 41986.275 | 1316 | |||||||||
| TreatmentReadiness COMPUTE Treatmentreadiness=CEST006 + CEST013 + CEST054 + CEST056 | Between Groups | 184.026 | 46.007 | 2.822 | .024 | ||||||
| Within Groups | 21683.026 | 1330 | 16.303 | ||||||||
| Total | 21867.052 | 1334 | |||||||||
| DesiretoHelp COMPUTE DesiretoHelp=CEST003 + CEST032 + CEST039 + CEST065 + CEST086 + CEST116 | Between Groups | 620.066 | 155.016 | 8.544 | .000 | ||||||
| Within Groups | 23895.814 | 1317 | 18.144 | ||||||||
| Total | 24515.880 | 1321 | |||||||||
| TreatmentParticipation COMPUTE TreatmentParticipation=CEST019 + CEST026 + CEST031 + CEST035 + CEST037 + CEST062 + CEST066 + CEST067 + CEST077 + CEST083 + CEST104 + CEST127 | Between Groups | 89.827 | 22.457 | .515 | .724 | ||||||
| Within Groups | 56681.226 | 1301 | 43.567 | ||||||||
| Total | 56771.054 | 1305 | |||||||||
Regression
| Variables Entered/Removeda | |||
| Model | Variables Entered | Variables Removed | Method |
| TreatmentParticipation COMPUTE TreatmentParticipation=CEST019 + CEST026 + CEST031 + CEST035 + CEST037 + CEST062 + CEST066 + CEST067 + CEST077 + CEST083 + CEST104 + CEST127, DesiretoHelp COMPUTE DesiretoHelp=CEST003 + CEST032 + CEST039 + CEST065 + CEST086 + CEST116, TreatmentReadiness COMPUTE Treatmentreadiness=CEST006 + CEST013 + CEST054 + CEST056b | Enter | ||
| a. Dependent Variable: TreatmentSatisfaction COMPUTE TreatmentSatisfaction=CEST007 + CEST011 + CEST020 + CEST030 + CEST080 + CEST115 + CEST122 | |||
| b. All requested variables entered. | |||
| Model Summary | ||||
| Model | R Square | Adjusted R Square | Std. Error of the Estimate | |
| .645a | .417 | .415 | 4.285 | |
| a. Predictors: (Constant), TreatmentParticipation COMPUTE TreatmentParticipation=CEST019 + CEST026 + CEST031 + CEST035 + CEST037 + CEST062 + CEST066 + CEST067 + CEST077 + CEST083 + CEST104 + CEST127, DesiretoHelp COMPUTE DesiretoHelp=CEST003 + CEST032 + CEST039 + CEST065 + CEST086 + CEST116, TreatmentReadiness COMPUTE Treatmentreadiness=CEST006 + CEST013 + CEST054 + CEST056 | ||||
| ANOVAa | ||||||
| Model | Sum of Squares | df | Mean Square | Sig. | ||
| Regression | 18293.523 | 6097.841 | 332.067 | .000b | ||
| Residual | 25616.820 | 1395 | 18.363 | |||
| Total | 43910.343 | 1398 | ||||
| a. Dependent Variable: TreatmentSatisfaction COMPUTE TreatmentSatisfaction=CEST007 + CEST011 + CEST020 + CEST030 + CEST080 + CEST115 + CEST122 | ||||||
| b. Predictors: (Constant), TreatmentParticipation COMPUTE TreatmentParticipation=CEST019 + CEST026 + CEST031 + CEST035 + CEST037 + CEST062 + CEST066 + CEST067 + CEST077 + CEST083 + CEST104 + CEST127, DesiretoHelp COMPUTE DesiretoHelp=CEST003 + CEST032 + CEST039 + CEST065 + CEST086 + CEST116, TreatmentReadiness COMPUTE Treatmentreadiness=CEST006 + CEST013 + CEST054 + CEST056 | ||||||
| Coefficientsa | ||||||||||||||
| Model | Unstandardized Coefficients | Standardized Coefficients | Sig. | |||||||||||
| Std. Error | Beta | |||||||||||||
| (Constant) | 5.559 | .959 | 5.798 | .000 | ||||||||||
| TreatmentReadiness COMPUTE Treatmentreadiness=CEST006 + CEST013 + CEST054 + CEST056 | .865 | .042 | .614 | 20.467 | .000 | |||||||||
| DesiretoHelp COMPUTE DesiretoHelp=CEST003 + CEST032 + CEST039 + CEST065 + CEST086 + CEST116 | -.229 | .039 | -.173 | -5.892 | .000 | |||||||||
| TreatmentParticipation COMPUTE TreatmentParticipation=CEST019 + CEST026 + CEST031 + CEST035 + CEST037 + CEST062 + CEST066 + CEST067 + CEST077 + CEST083 + CEST104 + CEST127 | .196 | .021 | .226 | 9.198 | .000 | |||||||||
| a. Dependent Variable: TreatmentSatisfaction COMPUTE TreatmentSatisfaction=CEST007 + CEST011 + CEST020 + CEST030 + CEST080 + CEST115 + CEST122 | ||||||||||||||


