please follow this
UV0339
Rev. Apr. 21, 2017
Six Sigma at Academic Medical Hospital (A)
Introduction
Jane McCrea was excited about the improvement results she had reviewed for an upcoming meeting. Her Foundations Team had just completed a month-long pilot study of the impact of the numerous new patient- flow process steps and communications protocols in the Emergency Department (ED) at Academic Medical Hospital (AMH).1 The ED Wait Time Project was one of the first of Six Sigma improvement projects underway at AMH led by Black Belts, who, like McCrea, were full-time project leaders and experts in Six Sigma methodology and statistical tool application. Lobby wait times had been reduced to comply with the team’s established service time. Physician wait time had also improved but was not yet exhibiting significant change. Preliminary feedback from staff members and some physicians about the trial patient-flow-process changes and the day-to-day service time results was positive.
Nevertheless, as McCrea prepared to brief the members of her Foundations Team on the results of the pilot, she was concerned. The statistical aspects of the ED project had gone well overall but had not been without missteps that she thought would always be part of Six Sigma. She knew that the team would want to dig into the pilot results to examine their statistical significance at the next team meeting. Although McCrea agreed that the data analyses and pilot design challenges were important considerations, she still thought that, at this point, it was more essential to focus on another component of the project where success was of critical importance to the long-term outcome of the project: stakeholder acceptance and ED Wait Time Project sponsorship.
At the start of the ED Wait Time Project, many of the emergency medicine physicians were reluctant to agree to a Six Sigma initiative in emergency care. Some believed that the patient care environment simply did not lend itself to process experimentation, not even in the walk-in/wheelchair patient care area that was the main focus of the ED project. Now at the beginning of the final phase of the team’s work, McCrea knew that its project sponsor had not been successful in garnering the necessary physician support and acceptance that would be critical for sustaining the new process once the ED Foundations Team completed its next final phase of work. Furthermore, there were many other aspects of ED patient care that McCrea and the ED staff believed needed to be addressed in the spirit of continuous improvement, even after the Foundations Team had completed this particular project.

1 The case has been disguised to provide confidentiality. Academic Medical Hospital (AMH) is a blend of similar university-based hospitals. The characters in this case setting are fictitious, although their experiences have been shared by numerous health care physicians and professionals in these institutions.
This case was prepared by Dee C. San, MBA/RN, and Robert D. Landel, Henry E. McWane Professor of Business Administration. It was written as a basis for class discussion rather than to illustrate effective or ineffective handling of an administrative situation. Copyright 2002 by the University of Virginia Darden School Foundation, Charlottesville, VA. All rights reserved. To order copies, send an e-mail to [email protected]. No part of this publication may be reproduced, stored in a retrieval system, used in a spreadsheet, or transmitted in any form or by any means—electronic, mechanical, photocopying, recording, or otherwise—without the permission of the Darden School Foundation.
Academic Medical Hospital and Six Sigma
AMH was a teaching hospital associated with the medical school of a state university located in a small rural community. As the largest employer in the area, AMH was also an important contributor to the community, and, although the hospital had a positive reputation in the community, life inside the hospital was not without turmoil and problems.
The portal of entry for a majority of AMH patients was the ED where AMH Chief of Staff Gerry Elbridge had struggled for 10 years to streamline processes to reduce ED patient wait time. Although long wait times seemed to be readily excused by many ED physicians owing to the complexity of emergency room processes, Dr. Elbridge was frustrated with the situation: “This is absolutely unacceptable. Patients with potentially life-threatening injuries or illnesses are waiting for over an hour for treatment. And that’s far too long,” he said.
Over the years, streamlining emergency care processes to reduce patient wait time had become Dr. Elbridge’s obsession. His first efforts to improve the situation utilized a 10-Step Quality Assurance Program, but he had encountered resistance from doctors who were unwilling to change their habits and routines based on long experience, believing that their emergency care processes ensured the best ED medical treatment.
In the 1990s, the quality programs at AMH had been geared toward finding out what kind of service patients wanted, but often these programs were not supported by the facts-based, root-cause-analysis methodologies that generate improvement. In 2000, Dr. Elbridge was invited to an introductory seminar with
U.S. corporate executives and introduced to Six Sigma. From that introduction, he became convinced that Six Sigma had the statistical rigor and change-management elements lacking in past programs tried at AMH. Dr. Elbridge spearheaded the introduction of Six Sigma at AMH and chaired a kick-off session that was attended by 80 of the university’s top administrators, executives, and medical staff members from both AMH and the medical school.
These leaders were uniformly enthusiastic about the Six Sigma approach, and they developed a preliminary draft for implementing Six Sigma at AMH, picking talented AMH staff members who were not physicians to serve as Six Sigma Black Belts. Following an introductory training session in May 2001, each phase of the rigorous Six Sigma methodology was taught to the selected Black Belts and Green Belts, who were trained in a subset of the Six Sigma methodology and usually worked with projects having a more limited scope. The leadership at AMH and the medical school had selected six training projects as the first wave of improvement activities: ED Wait Time, Discharge Cycle Time, Operating Room Case Carts Accuracy, MRI Turnaround Time, Orthopedic Clinic Access, and Physician Coding. AMH intended to add more Six Sigma projects as the process became the cornerstone of a cultural change at AMH. Six Sigma Foundations Teams were established, and each undertook an application practicum on an assigned AMH project with corporate trainers acting as coaches.
Dr. Elbridge expressed the consensus of the senior executive leadership group at AMH:
Six Sigma methodology appears to have all the elements of a very comprehensive and systematic approach. It has the foundations of statistics to support it, as well as the structure and oversight necessary for us to not only understand and improve our processes but also to achieve long-term gains by focusing on the acceptance of change. That is where we have historically dropped the ball in the past.
This leadership group agreed on the following objectives for instituting Six Sigma at AMH:
Creating a safer environment for patients and staff by reducing medical errors, and improving patient and staff satisfaction;
Becoming the Best Place to Care for health care professionals demonstrated by increased retention and reduced turnover;
Becoming the preferred place to receive care demonstrated by increased market share both regionally and nationally;
Continuing to reduce variability and waste in processes.
Understanding Six Sigma Roles and Responsibilities for the ED Wait Time Project
There were critical roles and responsibilities that ensured Six Sigma methodologies became ingrained in everyday work. These roles applied to the entire Six Sigma process—project selection to full implementation and assessment of lessons learned. Each improvement project was organized with the same structure. In addition to strict adherence to this structure, it was vitally important that an organization have unwavering support and commitment from the executive leadership when implementing Six Sigma. (See Appendix 1.)
A Six Sigma program, Champion, created the vision for the Six Sigma initiative, defined the strategic goals and metrics of the organization, established business targets, and created an environment within the organization that promoted the use of Six Sigma methodology and tools. As program Champion, Dr. Elbridge’s support for Six Sigma was unwavering, and his influence as a physician leader helped open the door to communication with the medical school community. But the segregated reporting relationships between the AMH and the medical school clinical departments lessened his authority with attending physicians2 and residents3 working in AMH. And, like all pioneers of Six Sigma implementation, Dr. Elbridge was unaware of some of the pitfalls related to rolling out the program throughout the entire institution.
The project Sponsor was a local leader, who was generally the requestor of the project and committed to its solution(s). The Sponsor identified project goals, objectives, and scope; removed barriers and aligned resources; served as a key communicator of project progress and status; and approved final recommendations. But for each project in the first wave of Six Sigma projects at AMH, the Sponsor was not the project requestor. In the case of the ED Wait Time Project, Dr. Terry Hamilton was recruited as the project Sponsor. Dr. Hamilton, a busy vice-chair of the medical school’s Emergency Medicine department, was active in several other departmental initiatives and responsibilities, as well as an involved father and husband. Dr. Hamilton had been solicited by Dr. Elbridge to serve as the project Sponsor of the ED Wait Time Project, but Dr. Hamilton was reluctant from the onset.
The project Owner was a local operations leader who, as a member of the Foundations Team, participated in implementation and was accountable for sustaining long-term gains. Nancy Jenkins, a long-time ED Patient Care manager, was selected as project Owner. Clinically, she was an exceptionally competent care provider and performed well as an operations manager but the implementation of significant process and behavior changes was not her strength.
2 An attending physician or an attending is a physician who oversees and provides emergency medical care in the AMH, as well as supervising resident physicians. Emergency Medicine Attendings are faculty members of the Medical School’s Emergency Medicine Department and contracted employees of the hospital assigned to the ED. Their three primary responsibilities include education, research, and patient care. Attendings report to the Chair of Emergency Medicine who reports to the Medical School Dean.
3 A resident is a physician in training who rotates through various departments during their medical education. ED residents provide primary patient care in the ED under the supervision of Emergency Medicine Attendings.
Black Belts were full-time project leaders who were experts in Six Sigma methodology and statistical tool applications. For example, Jane McCrea had a 25-year career history of nursing leadership roles and had significant work experience in the industry. Project management, quantitative analysis, team facilitation, and building relationships with clinical staffs were her strengths. Like Dr. Elbridge, she was a great proponent of Six Sigma.
Green Belts were trained in a subset of Six Sigma methodology and usually worked with projects having limited scope, generally in their respective work area. They also partnered on a project led by a Black Belt, as was the case on the ED Wait Time Project. Dr. James Wilson, whose medical practice involved a high degree of interaction with the ED, served as the project’s Green Belt. An AMH physician leader in clinical process improvement and a faculty member of the medical school’s Surgery department, Dr. Wilson was a natural choice. His own clinical commitments in surgery at AMH limited his availability for a high level of project involvement. Still, he consistently interacted with the ED physician as needed per McCrea’s request. Dr. Wilson was also a long-time, personal friend of Dr. Hamilton.
The Foundations Team was a group of local experts who participated in project communication/education, problem analysis, and improvement design and implementation. Originally, seven team members from both the ED management and clinical staff ranks were selected and trained. Two dropped out owing to scheduling constraints and interest levels, however, and one resigned from AMH. The four remaining team members included Nancy Jenkins, Patient Care manager:4 Georgia Williams, ED Registration Manager,5 Bill Barber, Senior Clinician,6 and Steve Small, Senior Clinician and Quality Improvement Coordinator.7 All these individuals had a strong commitment to quality and performance improvement, but their previous efforts to effect change in the ED environment had not been successful.
Applying Six Sigma DMAIC Methodology to the ED at AMH
The Six Sigma methodology was a project-focused, step-by-step approach to improvement realization. There were five phases in the DMAIC methodology: Define, Measure, Analyze, Improve, and Control. (See Appendix 2.)
Six Sigma projects were defined from a business, operational, and customer-needs basis. Often, as was the case with AMH, projects were selected and defined by their link to an organization’s strategic plan. Dr. Elbridge and the Foundations Team narrowed the Wait Time Project to a manageable scope by limiting the study to Priority Level II walk-in and wheelchair patients. They defined the start and end points of wait time as being from the initiation of triage (preliminary patient care prioritization) until the first interaction with an ED resident and/or an attending. The total wait time was referred to as the “Y” or “what you are measuring.”
4 A Patient Care Manager is responsible for both business management as well as clinical care management of nursing and support staff members. The person in this function managed the department’s operational/staffing and capital budgets. The person oversaw daily operational management of the ED and was responsible for maintaining internal and external (regulatory) patient care standards. All ED staff, with the exception of attendings and residents reported to the Patient Care Manager.
5 The ED Registration Manager is responsible for all registration staff and ED patient admission and discharge documentation related to demographics, insurance, and coding information. Registration staff members also perform a variety of clerical support functions in the ED.
6 A Senior Clinician is a senior registered nurse who has several years of experience in the ED, serves as a preceptor/trainer for other nurses, assumes lead positions within the department (i.e., charge nurse), participates on various committees and tasks forces to enhance patient care services, and is viewed as an expert resource person for nurses, support staff, and physician colleagues.
7 A Quality Improvement Coordinator is a senior registered nurse who has the expanded role responsibility of overseeing quality monitoring for the ED based on established internal and external performance expectations. This clinician produces and analyses quality data/reports and contributes to staff and faculty education. The QI Coordinator also participates in and/or leads improvement initiatives.
In the Define phase, the team identified such expected benefits of the ED Wait Time Project as expedited emergency medical care delivery, improved patient satisfaction, reduced patient complaints, increased patient capacity, and improved operational efficiency. Moreover, the potential existed for operating margin gains for the ED via operational efficiencies as well as patient census growth that could be fueled from achieving and sustaining the expected benefits.
The next phase was Measure, in which the team determined the baseline measures and target performance of the ED process, defined the input/output variables of the process, and validated measurement systems. The process flow for patients arriving at the ED as a walk-in or a wheelchair patient is described in Exhibit 1.
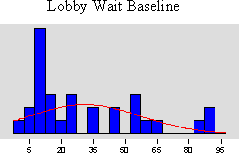
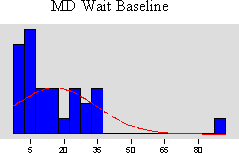
The Foundations Team collected the initial baseline study data for a thirty-patient sample while simultaneously conducting a patient-satisfaction survey. The survey determined that most patients were either very satisfied or very dissatisfied, thus confirming that there was definitely a need for improvement. Based on this patient survey, as well as clinician input and external benchmark data, acceptable maximum wait times were established for each of the seven process steps (from beginning of Patient Triage to start of Physician Assessment as identified in Exhibit 1). The team also established an upper specification limit (USL) of 37.1 minutes for the Y—the total wait time for a patient at the ED (the sum of the maximum wait time for each of the seven process steps). Any occurrence of total ED wait time greater than 37.1 minutes was considered a quality defect. Acceptable (upper limit value) Lobby wait time was set at 15 minutes and acceptable (upper limit value) medical doctor (MD) wait time was set at 8 minutes.
The baseline study statistical mean for total wait time incurred in the seven process steps was 62.5 minutes, with a standard deviation of 39.66 minutes. McCrea reported to Dr. Elbridge, “The team counted 210 opportunities for a defect to occur within the seven process steps and found that the ED was operating at a 38.6% ‘defects per opportunity’ performance.” And Elbridge told the Foundations Team: “The data doesn’t lie. This is a no-brainer. We can do better.”
The team analyzed the baseline study data to statistically determine that 98.8% of the variation in wait time was related to two of the seven steps of the process: Lobby Wait Time (time from postregistration to being transferred to an exam room) and MD Wait Time (time from completion of nursing assessment in the examination room to start of physician interaction). This focused the team’s effort solely on the most influential steps of the process.
When McCrea showed the ED attending physicians the results of the baseline study data analyses, reactions were mixed and somewhat uninspiring to the team (see Lobby Wait Time and MD Wait Time: Study 1 in Exhibit 2). The primary concern was the small sample size of thirty patients. As a result, the team decided to make a larger, more detailed data collection effort. This second phase of data collection coincided with the Analyze phase. The Analyze phase used raw study data to establish the key process inputs that affected the process output Y. The Foundations Team used a Fishbone Diagram to help it brainstorm and display critical process factors (referred to as Xs) that were thought to be possible drivers of excessive wait times. Twenty-three X causal factors were selected for further study in the second round of data collection (Exhibit 3). This second baseline survey, with a more satisfactory sample size of 129, validated the original baseline results (see Lobby Wait Time and MD Wait Time Study 2 in Exhibit 2) and helped the team statistically identify the likely root causes of excessive wait time.
The team then began the Improve phase of its project. During this phase of the project, improvements were identified to optimize the outputs and eliminate/reduce defects and variation. The Foundations Team selected critical process variables (Xs) that were controllable and determined the statistical relationships to the Y performance measure.
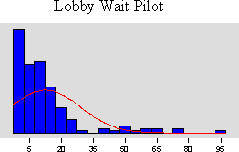
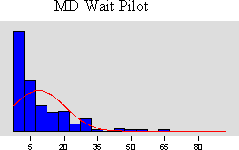
The ED Wait Time Foundations Team designed recommendations to improve the ED processes, and it conducted a pilot study comprised of 172 patients over a period of thirty days for 10 hours per day during the busiest times of the day and for the specified patient population (Exhibit 4). The three general categories of the ED process changes included:
Patient Flow—Changes in how Priority Level II patients were moved through the system, which resulted in most patients by-passing the waiting room and instead proceeding directly to an examination room following registration.
Care Team Communication—Changes to patient care team communications through modifications of assignments by ED zones, and utilization of new communication boards.
Streamlined Order Entry and Results Retrieval Process—Central clerk support for entering orders and retrieving results of all patient medical testing that was done. This change reduced the amount of time physicians and nurses were occupied on computer terminals and thus unavailable to provide patient care.
Project results from Study 1, Study 2, and the pilot are shown in Exhibit 2 for the Lobby Wait Time and MD Wait Time. Now beginning the Control phase, the team assessed the success of the pby comparing the before and after distributions of performance. The statistical analyses performed by McCrea revealed the pilot Lobby Wait Time mean value came in under the acceptable target of 15 minutes, and the MD Wait Time measure was improving (pilot mean was 8.9 minutes against a Study 1 baseline of 16.1 minutes and a Study 2 baseline of 11.2 minutes). The MD Wait Time acceptable target had been set at 8.0 minutes.
McCrea felt the pilot study had a few statistical limitations that the team needed to discuss as it reviewed the comparison results. She prepared the Mood’s Median statistical significance tests and analyses summary for the team, described in Exhibit 5, which produced the following outcomes:
Pilot Lobby Wait Times were better than the established 15 minute target, the defect rate dropped, and the 95% confidence interval test on the Study 1 median and Study 2 median versus the pilot median validated statistical significance of the improvement in wait times.
Results for MD Wait Times were statistically significant in one of two Mood’s Median tests (Study 1 versus pilot). Positive trending was demonstrated in the comparison of Study 2 to the pilot.
It was noted by McCrea that the Hawthorne Effect came into play, particularly in the Study 2 data collection activities. Owing to unreliable automated data-gathering procedures in the ED’s information systems and the need to use intradepartmental manual data surveyors, the presence of bias was recognized. With the pilot study nearing completion, the team needed to decide whether to redo some aspects of its work in the Improve phase.
In the Six Sigma Control phase, the team ensured the new standard operating procedures for moving patients through the ED were maintained. The team next designed metric dashboards and accountability reporting to track and monitor progress. The building blocks for the Control phase were (a) setting guidelines and assigning responsibility for the implementation of such guidelines; (b) instituting data review, accountability and reporting techniques to ensure that the new standard operating procedures are tracked and monitored, and (c) developing methods of communication and recognition for updating the staff and executives on the progress. This was an aspect of improvement initiatives where AMH had been historically weak, and successful execution of the Control phase required much attention and effort from the team.
Change Acceleration Process: Creating Change through Building Relationships
The equation, Q × A = E, was the cornerstone of successful Six Sigma improvement implementation. It inferred that the Quality of process solutions multiplied by the Acceptance level of stakeholders was equal to the Effectiveness of results. The key was that the strength of the A influences the power of Q and vice versa. The Q came from the team’s problem analysis skills, design creativity and the statistical rigor of the Six Sigma tools. But no matter which solutions resulted from the analysis, even if the absolute answer to a problem was identified, the potential for success was limited without the Acceptance of the people affected and involved (those people who need to “own” the changes). For example, if the Q was rated as 10 out of 10, but Acceptance level was only 2, the Effectiveness rating would be 20. But if a less than optimal solution was recommended (Q = 6), but Acceptance level was 6, the Effectiveness rating would be an improved 36. Thus a less effective solution option would have a better opportunity for successful implementation if it was more widely and vigorously accepted by stakeholders then the best solution alternative.
Acceptance was the component that previous quality programs at AMH had lacked and an aspect of Six Sigma that Dr. Elbridge anticipated would have the greatest impact on implementing change and discovering additional improvements. Exerting influence over physicians, who are typically the teachers of residents and the medical community “influencers,” however, was not going to be easy. This approach represented a significant culture change for AMH and other medical centers.
To address the Acceptance factor, Six Sigma tools and techniques utilized were collectively referred to as The Change Acceleration Process or CAP. Rather than one individual process, CAP was a tool kit for preparing the corporate culture to accept change. CAP employs a variety of methods that helps the organization understand what needs to be changed, how, and why. CAP dovetails with Six Sigma’s five statistical phases (DMAIC) throughout the lifespan of a project. Different tools were used at different stages in order to measure, monitor, and influence Acceptance. CAP was always, ultimately, found to be necessary to secure Acceptance of implemented changes. Most importantly, these tools assisted teams in clearly identifying key stakeholders (both in the formal and informal networks); understanding each stakeholder’s level of Acceptance and how they could be influenced; and understanding stakeholder concerns and needs and how these can be incorporated into the implementation plan. If the statistical methodology of Six Sigma problem analysis was the bolt, then CAP was the nut that held it in place throughout the project’s duration.
Change happens not solely because data statistically validates via a pilot what should be done, but because people as a whole commit to making changes. Listening and responding to stakeholders’ needs, fears, desires, and concerns about change improved the Acceptance level and consequently raised the Effectiveness rating.
Several CAP techniques were used throughout the ED Wait Time Project:
Process Mapping: Helped the team consider all elements of the work flow and information of the process, including activities, decisions and measurement points and setting clear boundaries of where the overall process begins and ends.
Elevator Speech: A two-minute pitch for a change that links the need for the change with the vision of the future and was used whenever a Foundations Team member had an opportunity to sell the project to a key constituent.
Extensive and Creative Communications Plans: These were used throughout the project to provide progress reports, status updates, and feedback opportunities for staff.
Page 8 UV0339
The Stakeholder/Resistance Analysis: This tool was used to identify key stakeholders and analyze how they felt about the change initiative. Actions were usually taken to gain strong commitment from key constituents and eliminate or lessen resistance from the more resistant stakeholders.
Managing Doctors Is Not Easy
Getting people to embrace Six Sigma reforms in the ED was going to be an uphill battle. Part of the problem was the nature of the medical profession as a whole. “Influencing the ED physicians will be our biggest challenge,” Dr. Elbridge, the program Champion, remarked in his first Six Sigma meeting with McCrea. He emphasized the challenge presented by the duality of the reporting structure, with doctors holding academic positions in the medical school and ED clinical appointments in the AMH. Along with their academic professional activities, they had regularly scheduled rotational assignments as attending physicians in the ED. Elbridge explained:
There’s no doubt that our ED physicians want to do the right thing, which is to see emergency patients as quickly as possible, but they need to be the source of the solutions. The beauty of Six Sigma is that’s exactly how it works. If we can get them to participate in the activities, they will find the answers within the framework of Six Sigma methodology. I believe this improvement model presents us with the best opportunity for success that we’ve ever had. The fact that physicians are not hospital employees, but independent contractors of a sort from the Medical School, results in a complex reporting relationship where even I, as the AMH Chief of Staff, cannot make them comply with hospital programs. In fact, there is almost a disincentive to participate since their incentives lie with research, education, and patient care specialty. Some will say, “Ah, but this project is patient care.” And the end results can positively contribute not only to improved patient care outcomes, but also smoother workflow for ED physicians and staff once processes are streamlined and made more efficient. Not to mention the impact that satisfied patients and family members can have on your day as a physician. That’s the angle we have to present.
Jane McCrea remained committed and positive about the team’s work and Six Sigma, and she always was inspired after talking to Dr. Elbridge, but she still had to deal with Dr. Hamilton, who was recruited by Dr. Elbridge as the project’s Sponsor. Dr. Hamilton was hesitant to get involved. Even setting up a first informational meeting with Dr. Hamilton became a challenge for McCrea. She recalled, “Dr. Hamilton seems to be looking to avoid me in the halls, and often takes a long time to return phone calls and e-mails. His first reaction to Six Sigma was ‘here we go again.’”
It was only after much persuasion that Dr. Hamilton reluctantly agreed to give Six Sigma a try. It was hardly the ringing endorsement Elbridge and McCrea had hoped for, and Hamilton wondered if this wasn’t just another flavor of the month project that wasn’t worth the trouble. “I understand that I am going to act merely as a resource person,” Hamilton said. But McCrea pointed out that Hamilton wasn’t expected to be a resource; he was expected to be a leader.
“You know I can’t make anybody do anything they don’t want to do,” Hamilton complained. “True, but you can persuade, influence, and encourage,” answered McCrea.
Page 9 UV0339
Creating a Six Sigma Culture
The data needed for any Six Sigma project was substantial, and after McCrea evaluated the ED’s automated information collection systems, she found them to be inaccurate and incomplete. And so the quest for data became a labor-intensive effort requiring the participation of ED staff and physicians. Limited staffing resources became a critical barrier as shifting staff hours from patient care to data collection activities was not an option. The ED administrator agreed that the only way to achieve the level of necessary survey hours would be to pay staff overtime. This led to discussion that resulted in a unique pathway to their desired destination.
A critical mile marker of progress, related to project support, focused on the Emergency Medicine department chair, Dr. George Calhoun, who had remained at arm’s length throughout the team’s work. As department chair, Dr. Calhoun was responsible for overseeing the work of the faculty and residents related to their primary activities including education, research, and patient care. In this role, Dr. Calhoun was in a position of influence over faculty and long-term changes that could result from the ED Wait Time Project. McCrea learned that Dr. Calhoun’s interests and incentives were linked to achieving national emergency medicine program recognition and publications.
McCrea and Dr. Wilson recognized that another way to influence attending physicians was to leverage the ED clinical staff’s support. Once the clinical staff members were committed to Six Sigma, they would in turn influence the attendings and residents. McCrea had observed this influence during the 30-day pilot as physicians saw the Six Sigma changes being embraced by the staff. Some like Dr. Hamilton came along slowly, even grudgingly. ED Patient Care Manager Nancy Jenkins was more exuberant, exclaiming, “These changes are great! They really help us communicate better as a patient care team in the ED, and that makes my job easier.”
McCrea still was anxious in spite of the fanfare about the pilot results because she continued to hear about pockets of negativity and skepticism. She knew that a portion of the pilot’s success was a by-product of the team’s commitment and enthusiasm during the project, especially in the pilot activities. Without this level of oversight, McCrea feared that the results would not be sustained for the Priority Level II patient population, much less to other areas of the ED, but she remained hopeful. “This becomes infectious after a while. We have a small minority of physicians in the AMH community who are leading the change and suggesting other Six Sigma projects. This is the beginning of a culture change.”
The Meeting
On her way to the team meeting, McCrea pondered the future of the project, thinking about the wisdom of the Six Sigma cornerstone equation, Q × A = E. The statistical limitations the team had encountered with the pilot results, and its eagerness to start the Control phase and to continue to work with stakeholders to influence the sustainability of the project were on her mind. As the Black Belt for the ED Project, she was organized about how to proceed in some areas, which she would share and discuss with her team. Likewise, she hoped the team would brainstorm and offer suggestions about how to shape and manage the project from this point forward. Although she regularly interacted with Dr. Elbridge, and he was well aware of the project’s dilemmas, McCrea wondered if this was a juncture where she needed to ask him to become more actively involved. If so, she needed to decide what specifically she expected of him in his role as program Champion.
Exhibit 1
Six Sigma at Academic Medical Hospital (A)
Seven Process Steps and Activities for Level II Patients at the ED

The level II patient arrives through the main entrance of the ED as a walk-in or a wheelchair case.
The patient is directed to the Triage area where a nurse completes a preliminary assessment of the patient’s condition and ranks his criticality accordingly. There may be a queue for triage access.
Following the triage assessment, the patient is directed to Registration where demographic and insurance information are obtained. There may be a queue at the registration window.
Once registration is completed, the patient’s information is entered into a computer-based tracking system where locations and wait times can be viewed on monitors throughout the department.
Following registration, the patient is directed to the lobby/waiting room.
Registration staff compile the patient’s chart. Once completed, the chart is placed in the rack at the main nurse’s station.
Generally, the nursing team manager or any staff nurse decides when to take the next patient back to a treatment room. This is primarily based on an acuity coding system (sickest patients are to be seen first), but it is also influenced by the current nurse/patient ratio and individual nurse patient load acuity. A certain amount of negotiation regularly occurs as to which nurse takes the next patient.
A nurse generally goes to the lobby, calls the patient by name and escorts him/her to a treatment room. The nurse completes a nursing assessment.
The nurse drags/drops the patients name into a specified room on the tracking system and also attaches his/her name as the assigned nurse. The cell is color coded to alert a physician that a patient is in the room and has been seen by a nurse.
The nurse may initiate standing testing orders (generally lab draws or EKGs).
The nurse enters the orders into the information system (IS) terminal.
Lab draws and EKGs may be done by a nurse or a patient care technician.
Lab draws are completed and labeled. Specimens are placed in a bin or refrigerator.
A transmittal is generated, attached to specimens, and tubed to the lab.
Exhibit 1 (continued)
A physician, generally a resident when available, examines the patient and completes a medical assessment. There is no standard assignment process by which a resident sees the next patient. There may be a delay before a resident decides to pick-up his/her patient. For example, if a resident has seen several similar diagnoses recently, she may not pick up the next patient to be seen but instead see patients out of the sequential acuity order.
The resident drags/drops his/her name to the patient’s room, which again changes color to alert an attending that the patient has been seen by a resident.
At some point, an attending physician from the Medical School Emergency Medicine Department will examine the patient to validate the resident’s medical assessment.
The attending physician and resident may confer before or after the attending’s visit.
The resident initiates testing orders by entering them into an IS terminal. The number of screens completing an order request, the formatting of the screens, and the lack of an interface between lab and radiology order screens resulted in test ordering being a lengthy process that detracts from the amount of time physicians can spend in direct patient care activities.
Nurses/technicians complete testing preparation and/or transportation. The team observed that the communication between physicians and nurses regarding testing orders was inconsistent and that such lack of communication and/or miscommunication led to delays.
Once testing is completed, nurses and/or physicians look for results in the information system. The team observed that there was no flagging system to notify clinicians when test results were available. Clinicians therefore were wasting time either checking too soon or not checking soon enough, resulting in further delays. STAT testing results were routinely phoned to the department.
Team observation: It is important to note that any delays in completing medical assessments, entering orders, completing orders, or retrieving results leads to extended wait time for subsequent patients. The longer patients are in beds on the ED floor, the longer subsequent patients spend in the lobby, potentially with deteriorating conditions.
Source: Created by case writer.
Exhibit 2
Six Sigma at Academic Medical Hospital (A)
ED Project Results for Study 1, Study 2, Pilot Lobby Wait Time, and Physician Wait Time
| Lobby WT | Lobby WT | Lobby WT | MD WT | MD WT | MD WT | |
| Study 1 | Study 2 | Pilot | Study 1 | Study 2 | Pilot | |
| N =30 | N = 129 | N = 172 | N = 30 | N = 127 | N = 172 | |
| Mean Time (min.) | 31.2 | 34.5 | 12.6 | 16.1 | 11.2 | 8.9 |
| Standard Deviation | 26.65 | 16.02 | 11.69 | 18.70 | 46.76 | 16.68 |
| % Defect >USL | 56.7% | 51.2% | 22.8% | 55% | 42% | 34.9% |
Source: Six Sigma Quick CAP Kit (General Electric).
Exhibit 3
Six Sigma at Academic Medical Hospital (A)
Fishbone Diagram for Critical Xs
AnalyzeEnvironment
People
Materials

Materials
People
Environment
ED patient volume ED patient acuity
Influx of squad patients
Referral volume Clinics schedules
OR volume Hospital patient volume
ED tx room limits/facility constraints
Staffing levels Experience & skill level Resident specialty Volunteer/greeter utilization
Family needs Role clarification
Match of skill sets and assignments
Variation of practice
Availability of supplies
Availability of diagnostic equipment Availability of trams, pumps, etc. Non-optimization of Tracking system
Inadequate IS system for tracking/trending No Physician Prescription Writing system No Integrated, on-line charting system
Machines
Triage process Registration/Chart prep process
Charting procedures Communication
Utilization of minor emergency unit
Ancillary services levels Specialty testing delays
ED used as admissions unit Ed discharge practice
Hospital discharge process/timing Consult responsiveness/practices
Use of Ed for boarding Segmentation/delineation
Sequential care vs. parallel processes
Quality of Measurement Are we measuring the right things? What do we do with what we measure? Need to do more than “track” Feedback systems to quality auditing Need for Improved flow sheet format Lack of on-line charting system for
automated monitoring
MethodsMeasure
Improvement implementation/maintenance ownership
23 variables & 18 time stamps Analyzed via 2nd wave of data collection
Patient Volume-Related: 10
Staffing Volume-Related: 5
Staffing Mix-Related: 5
Misc: 3
Source: Six Sigma Quick CAP Kit (General Electric).
Page 14 UV0339
Exhibit 4
Six Sigma at Academic Medical Hospital (A)
ED Pilot Design
The second round of data collection and its Fishbone Diagram discussions helped the ED Wait Time Foundations Team identify the likely root causes of excessive wait time. The team crafted process changes to improve these excessive wait times, and a pilot was conducted as the project moved into the Improve phase.
The pilot was conducted over a period of 30 days for 10 hours per day, during the busiest times of the day and for the specified patient population. The three general categories of process changes included:
How patients were moved through the system:
During less busy periods, when there were open ED beds, a direct-to-bed flow with bedside registration was consistently utilized. That means that patients skipped the registration process and did not wait in the lobby. Instead, after their initial assessment by the triage nurse, they were escorted directly to a treatment bed, and all activities (included registration) were conducted at bedside.
During busy periods, when ED beds were full, appropriate patients (i.e., stable patients waiting for test results, or discharge instructions) were moved out of private ED beds to alternative waiting areas in order to open beds for waiting patients.
A dedicated Flow Facilitator was in place and served as an air traffic controller, orchestrating all patient movement.
Changes were made to improve care team communication:
A modified zoning plan was used. That is, physicians, nurses, and technicians were consistently assigned the same block of beds and worked as a team.
A dry marker communication board was activated and used for order status and other communication that was important to the care team.
Several clinical protocols for specific common diagnoses were also used as a means to expand standing orders for standard treatments of common illnesses and expedite the typically time consuming testing process.
Recommended Information System (IS) design changes could not be made quickly enough to support the pilot, but these would be pursued if the pilot proved successful. As a result, in lieu of an immediate IS solution, a central clerk was assigned to order entry and results retrieval. This freed the clinicians from using an information system that was not efficient or user friendly. This was immensely popular and successful with the care team.
Source: Created by case writer.
Exhibit 5
Six Sigma at Academic Medical Hospital (A)
ED Pilot Study and Statistical Assessment of Results
Results and Mood’s Median Tests
Pilot Lobby Wait Times were better than the established 15 minute acceptable target, the defect rate tumbled, and the Confidence Interval tests validated statistical significance of the improvement in wait times in comparison to both Study 1 and Study 2.
Results for MD Wait Times (baseline studies compared to Pilot results) were statistically significant in one of two Mood’s Median tests (Study 1 vs. Pilot). Positive trending was demonstrated in the comparison of Study 2 to the Pilot.
P-value: The probability of being wrong if there is a difference between two data sets. A “P value” of <0 .05 signifies a statistical difference between the two data set results.
Comparative Tests of Median Wait Times
| P-value | 95% Confidence Interval (minutes) | |
| Lobby WT Study 1 to pilot | 0.001 | 2.7 to 31.8 |
| Lobby WT Study 2 to pilot | 0.000 | 4.8 to 13.2 |
| MD WT Study 1 to pilot | 0.016 | 1.0 to 16.0 |
| MD WT Study 2 to pilot | 0.772 | -2.00 to 3.00 |
Mood’s Median Test
Mood’s median test can be used to test the equality of medians from two or more populations. Specifically, it tests:
H0: the population medians of the data sets are all equal versus H1: the medians are not all equal.
An assumption of Mood’s median test is that the data from each population are independent random samples, and the population distributions have the same shape. Mood’s median test is robust against outliers and errors in data and is particularly appropriate in the preliminary stages of analysis.
Source: Six Sigma Quick CAP Kit (General Electric).
Appendix 1
Six Sigma at Academic Medical Hospital (A)
Academic Medical Hospital and Academic University Organizational Chart (partial)
Source: Created by case writer.
Page 17 UV0339
Appendix 2
Six Sigma at Academic Medical Hospital (A)
The Five Phases of Six Sigma
DEFINE MEASURE ANALYZE IMPROVE CONTROL 
Define the Y - what are you measuring?
•Define the Y - what are you measuring?
•Define a defect- W hat is considered an error?
•Estimate the cost savings of the project
•Ensure that you have the appropriate
Sponsor for the project- W ho can
ensure that the changes will stick?
•Identify the project Owner- W ho will be accountable for the implementation of the proposed changes?
•Evaluate buy-in from project Owner
•D•Defeifnine eththe eYY- w- whhatat araree yoyuoummeaesasuurirning?g?
•D•Defefinine ea adedfeecfect-t-WWhhatat isiscocnosinsdiedreerdedananerrerroor?r?
•E•Eststimimatatee ththe ecocostst sasvaviinngsgsooff ththe epprorojjectect
•E•Ennssurure eththatatyoyuouhhavave e ththe eapappproroppriraitate e
SpSpoonsnsoor rfofor rththe e
prproojecject-t-WWhhoocacnan enensusurereththatatththe echchananggeses wwillillsticstick?k?
•I•dIdententifiyfyththe eprporojjecect t OwOwnnere-r-WWhohowwillillbbe e accoaccuountabntablle efoforr ththe e imimplplememenentattaitoionnoof fthethe ppropropososededchchanangegse?s?
•E•Evvaaluluataetebbuuy-yi-ninfrformom
prproojecject tOwOwnnerer
Define a defect- W hat is considered an error?
Estimate the cost savings of the project
Ensure that you have the appropriate Sponsor for the project- Who can
ensure that the changes will stick?
Identify the project Owner- W ho will be accountable for the implementation of the proposed changes?
Evaluate buy-in from project Owner
Identify spec limits and validate these with data
Ensure that the data measurement system is accurate (reliable and reproducible)
Obtain a baseline measurement: Probability (defect) and Z-score
Estimate the cost of a defect
Identify the customer CTQs (Critical To Quality): W hat elements are important to your customer?
Develop a process flow chart
•Brainstorm a list of all possible drivers of defects (Xs)
•Define the statistical problem: Y = f(X1, X2, X 3…)
•Identify spec limits and validate these with data
•Ensure that the data measurement system is accurate (reliable and reproducible)
•Obtain a baseline measurement: Probability (defect) and Z-score
•Estimate the cost of a defect
•Identify the customer CTQs (Critical To Quality): W hat elements are important to your customer?
•Develop a process flow chart
•Brainstorm a list of all possible drivers of defects (Xs)
•Define the statistical problem: Y = f(X 1, X 2, X 3…)
•Compare where you are to where you want to be
•Collect all Xs Data
•Create a cause and effect diagram
•Assess the shape of distribution curve: W ill the solution require a mean shift, reduction in variability, or both?
•I•Iddentenitfiyfyspecspeclilimm ititss ananddvvalailiddateateththeseesewwitithh dadatata
•E•Ennsusurereththatatththe eddatataa mmeasueasuremremenent tsyssytsetmemisis acacccuurarteate(r(erelliaibableleanandd rereprpodroduucicbible)le)
•O•Obtbaitainna abasbaselelinine e mmeasueasruemremenent:t: PProrbobababilitilityy (d(defeefcet)ct) ananddZZ--scsorcore e
•E•Eststimimatatee ththe ecocoststofofa a dedefecfect t
•I•dIdenentiftiyfyththe ecucustsotmomerer CTQCTQs s(C(CritiriticcalalTToo QQuaulitality):y):WWhhatat eleemlemenentstsareareimimpoportartannt t totoyouyour rcucsutsomtomere?r?
•D•Deveelveoplopa approrocecsesss floflowwchchartart
•B•Brarinainstsotormrma alislist tofofallall poposssisbilbeledrdriverivers sofof dedfeefectcsts(Xs(Xs) )
•D•Definefine eththe estsatatististiticcalal prprobloblemem: :YY==f(Xf(X1, X, X2, , XX3…)…) 1 2
3
•C•Comompaparerewwheherereyoyuouaraere totowwhhereereyoyouuwwanatnttotobbe e
•C•CololellectctallallXsXsDaDatata
•C•Creraetate ea acaucasueseanandd efeffefectctddiaiagrgraamm
•A•Assessessss thteheshshapape eoof f disdistribtributioutionncucurvrve:e:WWillill ththe esosolulutiotionnrerqequuirire ea a mmeaenanshshiiftf,t,rerdeduuctcitoionninin
vavrairiababililiityt,y,ororbbooth?th?
Compare where you are to where you want to be
•Collect all Xs Data
Create a cause and effect diagram
Assess the shape of distribution curve: W ill the solution require a mean shift, reduction in variability, or both?
•Use statistics to identify
critical Xs
•Identify which critical Xs are in the span of your control
•Identify which Xs will provide biggest impact with least effort
Develop an improve solution
Identify the financial benefits of your planned changes
•Pilot proposed changes with appropriate sample size
Identify what learnings can be transferred across the organization
Compare before and after distributions
Construct a control plan for the vital Xs: How are you going to ensure that the problem does not return?
•Use statistics to identify
critical Xs
•Identify which critical Xs are in the span of your control
•Identify which Xs will provide biggest impact with least effort
•Develop an improve solution
•Identify the financial benefits of your planned changes
•Pilot proposed changes with appropriate sample size
•Identify what learnings can be transferred across the organization
•Compare before and after distributions
•Construct a control plan for the vital Xs: How are you going to ensure that the problem does not return?
•W rite plan for transferring learnings across the organization
•Determine financial implications of the change that was actually made
•Identify spin-off projects
•Identify lessons learned
•U•Usesestastatististictics stotoididenentitfiyfy
crcritiitciacall XXs s
•I•Iddenentitfiyfywwhichichhcriticriticaclal XsXsaraereininthethespspananofof yoyoururcocntontrolrol
•I•IddenentitfiyfywwhichichhXXs swwillill prporviovdide ebibggigegsetstimimppacatct wwitihthlelaeaststeffoefforrt t
•D•Deveeveloplopananimimprproovve e sosluolutiotionn
•I•deIdentnitfiyfythethefifnainanncciailal bebnenefeiftistsofofyoyurourplpalnannneded chchanangeges s
•P•Piloiltotpproroppoossededchchananggeses wwitihthapappprrooppriariteatesasammplple e sisizeze
•I•dIdententifiyfywwhahat tlealearnirninngsgs cacannbebetrtarnanssfefrerrerdedacracorsoss s ththe eoorrgaganniziaztioationn
•C•Comompaparerebebeforfore eandand afatfetrerdidistsrtirbibututioionsns
•C•Cononstsrtucruct ta aconcontrtorol lpplalnan fofor rththe evvititalalXsXs: :HHoowwaraere yoyouugoigoinnggtotoensensurure eththatat ththee prporobblelmemdodoesesnonott reretuturnrn? ?
•W•Writeritepplalnanfofor r
trtanransfsfeerrrirningglealearnrniningsgs
acarocrossssththe eoorgrgananizizatioationn
•D•Deteretermminine efifninananciciaal l imimppliclicatioationsnsofofththe e chchanangegeththatatwwasasacatcutualalylly mamadde e
•I•Iddenentitfiyfyspspinin-o-offff prproojecjectsts
•I•deIdnentitfifyylelessssonosnslelaearrnended
Write plan for transferring learnings across the organization
•Determine financial implications of the change that was actually made
Identify spin-off projects
Identify lessons learned
Source: Six Sigma Quick CAP Kit (General Electric).


