Assessment Rubric for this paper is available under Course Information, Assignments and Grading link. Please make sure that your paper conforms to APA style requirements. Purpose Statement and Model 1
MAJOR LEAGUE SPORTS 1
Major League Sports
Rymario Armstrong
Park University
MG315 Advanced Business Statistics
Dr. James Frampton
20190714
Introduction
This paper seeks to provide a proper understanding of the relationship existing between the salary of a player at a Major League Sports (MSL) and his/her performance in an effort to make predictions of the salary of the baseball players basing on the field performance. The dependent variable yearly salary of the players decided by independent variables which are Batting Average (BA), on the base percentage with slugging (OPS), the Stolen Base (SB), and the length of experience (EXP). One of the most significant variables existing in a relationship is OPS because it is a variable that is most comprehensive that incorporates most factors, for example, arriving on the base, figuring out time, the place, slugging as well as the simplification in the average of 100. This demonstrates OPS will be a fundamental independent variable which shows the performance of the baseball players, Stankiewicz, Katie (2009). We, therefore, have the model's general form as:
The annual pay of the player =
Whereby, BA refers to Batting average
OPS means On-base percentage and slugging added
SB refers to Stolen-base
EXP means the time of experience
Variables’ Definition
The pay of baseball player becomes independent for this study where the variable is being measured on the scale measurement levels. The player's annual data on the payroll is then extracted. Previous studies on the type of relationship between the productivity of players and length of the contract show the OPS appearing as the highly compelling statistics which decides on the performance of the player of baseball (Meltzer & Josh, 2005)
OPS tops up the dual productivity measures together; that is, the slugging percentage alongside the base percentage, which is considered the best productivity measure, according to Stankiewicz (2009). Studies conducted in the past observed average annual salaries for the position players. The model used for making predictions of the average annual salary was the use of the regression model on the performance statistics, which are the plate appearances and the OPS percentages (Meltzer & Josh, 2005). These researches discovered performance metrics of dual variables made use of OPS alongside plate appearances that became an excellent prediction for a baseball player's salary (Meltzer, 2005). OPS is a primary independent variable with a correlation that is strongly positive as well as the prediction power towards the yearly pay of the player.
The average of batting is base hits the number per bat, and variable measurement happens on the scale measurement's levels. So a more great BA shows a more significant performance. Therefore, the BA will display a positive correlation with the yearly salary of the player, Averbukh, Brown & Chase (2015). A stolen base indicates the performance of a player. This shows the number of times that the base runner will advance to the following base not without necessary hitter assistance. Variable measurement is performed at the level of measurement scale. The stolen base variable will bear a strong positive correlation with a yearly pay of the player also according to Baseball Encyclopedia of MLB Players (2017).
The experience of the players reveals how long they have been in the MLS and is somewhat more skeptical of those players who have got more experienced in baseball sports receive higher pay (Whiteside, Martini,, Lepley, Zernicke & Goulet, 2016). The study discovered that the player's experience does not make a more considerable influence on the performance of the player, which impacts on the yearly salary they receive. Prior studies on the baseball pay and the performance of the players have shown more impact on the wages of the baseball player whereby the players who have stayed for a longer time in the league are receiving more pay, and this increases with teams having large amounts of payrolls. The measurement of this variable is done on the level of management and having a positive correlation with the annual salary of a player, Averbukh, Brown & Chase (2015).
Data Description
This study collects the data from thirty players playing in the MSL, and the data extracted from the relevant database. The annual salary of the players, OPS, BA and SB of the year 2016 and the time length of experience that the players have played the game by the end of 2016 season. Thirty names of players playing in the Major League Sport are selected randomly. Data of these variables are collected manually from the 2016 baseball career summary as well as the information about their salary. The statistic values of OPS+, SB, and BA are recorded in the database, and this means data will be extracted from the source directly. The amount of experience the players have is based on service time statistics.
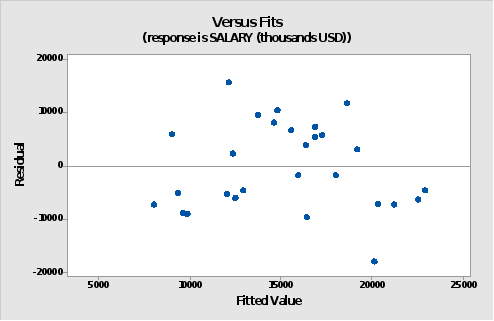
Fig 1. Residuals v. Fitted value of the payment

Fig 2. Histogram of the payment
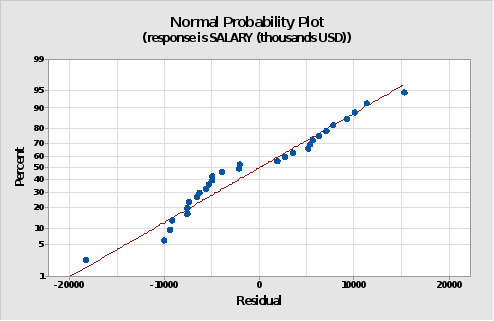
Fig 3. Standard probability residual plot for the pay
Presentation and the interpretation of the results
Fig. 1 shows the Residual vs. Fitted values for the pay that assists in the multiple regression model linearity evaluation. The residuals are plotted on a vertical axis to center on the zero. These are the negative and positive residuals that follow a random distribution. A distinct pattern does not exist, and this means there is no concern about the assumption of linearity. This shows there is no violation of the assumption independence of the observations made. Fig. 1 shows no interest regarding homoscedasticity assumption. Variances alongside the line of best fit will are almost equivalent to shifting alongside range, according to Stankiewicz, Katie (2009). Assumption of the customarily distributed residuals is considerable on Fig 2. And Fig. 3. Points plotted are relatively near a straight line, as shown, Fig. 3. There exists a Pearson correlation between the independent variables. the OPS+ and the BA appear to have a significant linear relationship having Pearson's r=0.087 at p=0.00<0.05 significance level. This could raise the concern of the model's multicollinearity, but the values of VIF are less than 10. We arrive at the conclusion that there is no problem with the multicollinearity existing in our model.
The multiple regression model is then run to make a pay prediction earned by the players from the OPS+, BA, SB, and EXP.  is 21.94%, and this is not quite high although F test is not significant, this is F (4, 25) = 1.76 and p=0.169> 0.05. The study established that the overall regression model is not the best fit for this kind of data and regression coefficients. EXP variable factor is very significant, t=2.64 at p=0.014<0.05 level of significance. Other variables do not show any statistical significance in this prediction model used with the p-values>0.05 level of, according to Meltzer & Josh (2005).
Conclusion
The model for predicting the pay from the OPS+, BA, SB, and the EXP is not in violation of assumptions made on the multiple linear regression model. Although the ANOVA test, which is not significant shows this model was not in any statistical manner, the best fit for this type of data. Experience variable which is statistically significant in making predictions of the pay of players. The stolen base, the On-base percentage, slugging plus the Batting average variables do not make any addition, which is statistically significant in making these predictions (What is the best offensive stat?, 2017).
References
Averbukh, M., Brown, S., & Chase, B. (2015, October 22). Baseball Pay and Performance - The University of Arizona. Retrieved August 26aver, 2017, from https://ai.arizona.edu/sites/ai/files/MIS580/baseball.pdf
What is the best offensive stat? (2017, April 06). Retrieved August 26, 2017, from https://www.cbssports.com/mlb/news/what-is-the-best-offensive-stat/
Baseball Encyclopedia of MLB Players. (n.d.). Retrieved September 10, 2017, from https://www.baseball-reference.com/players/
Stankiewicz, Katie (2009) “Length of Contracts and the Effect on the Performance of MLB Payers,” The Park Place Economist: Vol. 1.
Meltzer, Josh. “Average Salary and Contract Length in Major League Baseball: When Do They Diverge?” 2005, Department of Economics, Stanford University, CA.
Whiteside, D., Martini, D. N., Lepley, A. S., Zernicke, R. F., & Goulet, G. C. (2016). Predictors of ulnar collateral ligament reconstruction in Major League Baseball pitchers. The American journal of sports medicine, 44(9), 2202-2209.


