Need to refer following Videos to answer this calculations:Video Links:Video 7A) 1: https://s3.us-east-1.amazonaws.com/blackboard.learn.xythos.prod/5a31b16bb2c48/5207167?response-content-disposition=
Chapter 7 Problems
Instructions
YOUR ANSWERS MUST APPEAR WITHIN THE PROBLEM DOCUMENT.
10% WILL BE DEDUCTED IF YOU CREATE A NEW OR SEPARATE DOCUMENT.
10% WILL BE DEDUCTED IF YOU CREATE A “TITLE PAGE” TYPE OF DOCUMENT.
Chapter 7A
1. Consider a data set consisting of 220 data vectors, where each vector has 32 components and each component is a 4-byte value. Suppose that vector quantization is used for compression and that 216 prototype vectors are used. How many bytes of storage does that data set take before and after
compression and what is the compression ratio?
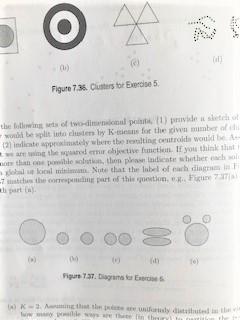
2. Find all well-separated clusters in the set of points shown below.
Note: take a photo of the clusters, print the photo and circle the clusters, take another photo, paste your response into this document.

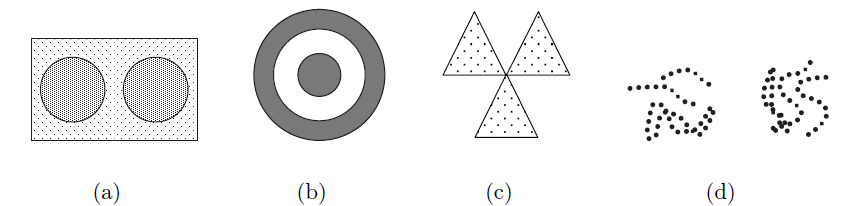
3. Identify the clusters in the figure below using the center-, contiguity-, and density-based
definitions. Also indicate the number of clusters for each case and give a brief indication of your reasoning. Note that darkness or the number of dots indicates density. If it helps, assume center-based means K-means, contiguity-based means single link, and density-based means DBSCAN.
4. For the following sets of two-dimensional points, (1) provide a sketch of how they would be split into clusters by K-means for the given number of clusters and (2) indicate approximately where the resulting centroids would be. Assume that we are using the squared error objective function. If you think that there is more than one possible solution, then please indicate whether each solution is a global or local minimum.
Chapter 7B
Problem #1
Consider the following four faces shown below. Again, darkness or number of dots represents density. Lines are used only to distinguish regions and do not represent points.
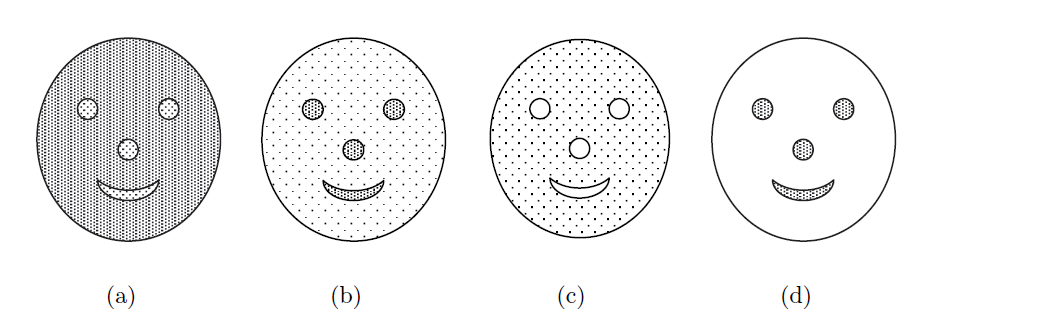
(a) For each figure, could you use single link to find the patterns represented by the nose, eyes, and mouth? Explain.
(b) For each figure, could you use K-means to find the patterns represented by the nose, eyes, and mouth? Explain.
(c) What limitation does clustering have in detecting all the patterns formed by the points in the figure?
Problem #2
RapidMiner and the Correlation Matrix
Task: Determine the correlation of various factors in heating a home. You will use the Correlation operator in RapidMiner (RM) to find how strong the relationship is between various attributes in the example set. The attributes are:
a. Insulation density - thickness
b. Outdoor temperature – measured in degree Fahrenheit
c. Number of Occupants – number of people living in the home
d. Home Age – years since the home was built
e. Home Size – number of square feet
f. Heating Oil – total units of heating oil purchased in the last month
Steps
1. Import the DataSet CSV file into RM
2. Add the Read CSV operator to the Process panel
3. Set the Import Configuration Wizard Parameter to the DataSet CSV file
4. Run the process
5. View the Statistics
Question 1: How many homes are in the data set?
Question 2: How many attributes have missing values?
Steps (continued)
6. Click the Data tab and examine the data
7. Add the Correlation Matrix operator to the Process panel (to the right of the Read CSV operator)
8. Make sure the “exa” port if connect to the “res” port
9. Connect the “mat” port to the “second “res” port
There should now be two connections from Correlation Matrix.
10. Run the process again
Correlation coefficients will now be displayed.
Question 3: What is the correlation between Heating Oil Used and Insulation Rating?
Question 4: What does this correlation indicate?
Question 5: What is the correlation between Heating Oil Used and Home Age?
Question 6: What does this correlation indicate?


