Complete this discussion in a 150 – 300 response. Healthcare data at a community, county, or region level and state level determine healthcare spending and services allocated for individuals. Using th
Running head: Virus prevalence estimates 0
Virus Prevalence Estimates
Student’s Name
Institutional Affiliation
Virus Prevalence Estimates
The virus poses great risks to the states that are on the Southern side of the country. States to the South Eastern and Southwestern part of the country being the ones with the greatest risk. Most of these states are bordering the sea or are in close proximity to those states that border the sea. The states that border the sea are usually associated with high numbers of people visiting those states for various reasons with the common one being for leisure (Barrai et al, 2001). The risk prevalence over the stretch of the three months indicates that there is a higher percentage of an increase in the risk to the selected areas. April has the highest projections of the risk that the virus poses. This can be attributed to a large number of people that patronize these areas during these periods because the months trudge towards the summer season (Weaver, 2005). The virus can be spread through the various ways discussed and therefore as people move to these areas they contribute to the spread of the virus. Others may be carriers and others may be infected as a result of their visit to those areas. Therefore there is a great risk that the virus will pose in the oncoming months towards the summer period. This is based on the projections estimates from the trend of the risk in figure 1.
The following cities are at the highest risk of infection with the virus as per the April number of cases; Miami 299, Jacksonville 322, New Orleans 248, Austin 281 Phoenix 289, San Diego 258, long beach 215, Atlanta 220. Most of these cities are found in those states that border the sea with most of those states also following suit with the risk potential of the virus. They include Texas, Florida, Louisiana, Arizona, and California.
Map showing High-risk areas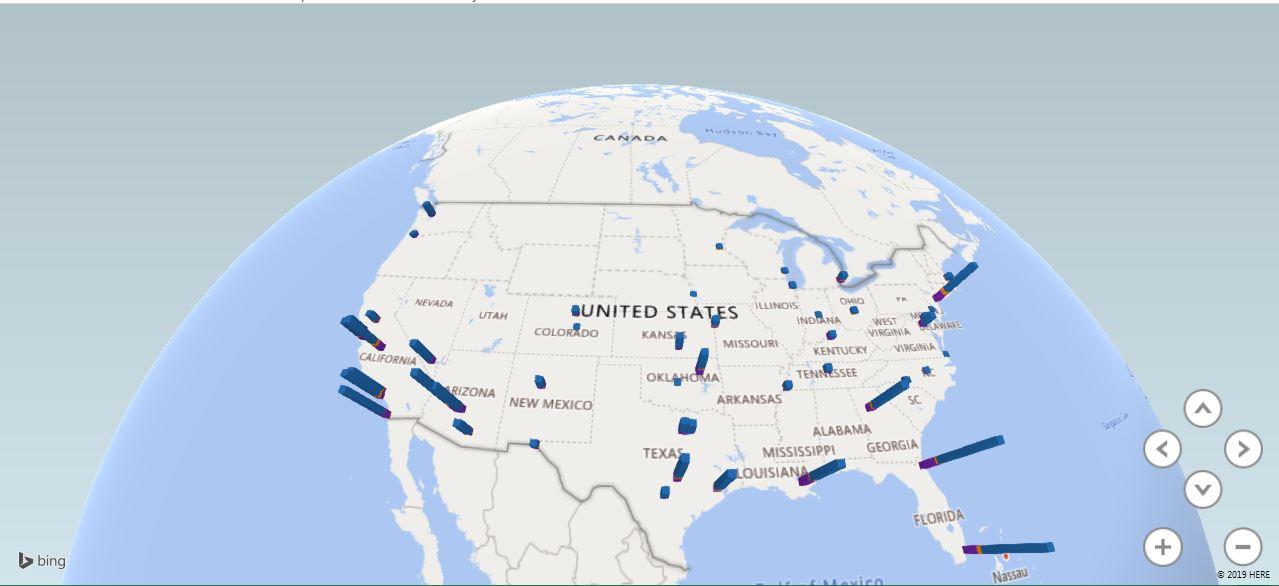
Figure 1: High risk areas of the virus
The cities with the lowest risk according to the April risk potential on the cases reported are; Omaha 3, Colorado Springs 5, Indianapolis 7, Minneapolis 9. Most of these cities are found in the states that are in the mainland. The states that have the lowest risk include; Montana, Idaho, Wyoming, South Dakota, Utah. These states have no reports on the cases of the virus. Most of these states are located in the Northern part of the country and are in the mainland.
References
Barrai, I., Rodriguez‐Larralde, A., Mamolini, E., Manni, F., & Scapoli, C. (2001). Isonymy structure of USA population. American Journal of Physical Anthropology: The Official Publication of the American Association of Physical Anthropologists, 114(2), 109-123.
Weaver, A. (2005). The McDonaldization thesis and cruise tourism. Annals of tourism research, 32(2), 346-366.


