this is an Acct & Financial Analysis class. Every student has to choose a company for analyzing it. I choose GoPro INC. in milestone 1 i analyzed the company`s financial health so in milestone 2 we wi
ORGANIZATIONAL CONTEXT
The business we have selected for review in this paper is GoPro Inc., it is a listed company over Newyork Stock exchange, with the trading symbol GPRO. The business is primarily involved in manufacturing the cameras and camera accessories, and these are not the simple cameras and accessories, but the mountable picture devices, which are often used by the motorcyclists and other users particularly in sports, where they require to mount the camera device on any thing. The business is also involved in preparing the mounting devices and support instruments, in relation to cameras. (GoPro Inc., 2019)
The business is primarily focused over expeditors, hikers, and motorists, as they usually require such devices to film all the action. These devices come with exceptional picture quality results and along with durable accessories, to withstand all the atmosphere challenges, and are shock and water proof.
The main brands of GoPro Inc., include the Hero 7, Fusion, GroPro Plus, Quik, GoPro App, and Karma Grip. All the products and sub brands are designed and advertised according to specific user category to ensure the correct audience is attracted to the right product. Hence this drives the business manufacturing, and sales concerns to the particular segment.
ORGANIZATION AND MANAGEMENT
The business is mainly governed by founder of company back from 2002, Nicholas Woodman, head quartered in San Mateo, CA. The business is operating as one single operating unit, being the only profit centre of the business, and centrally reporting to on CEO and CFO, this empowers the business to concentrate all the business resources potential with synergy. (GoPro Inc., 2018)
If the business geographical concentration areas are considered, the business has divided the geographical operations in to 3 main segments, and concentrating the potential according to that. The areas are divided as region, America, Europe Middle East and Africa, and Asia & Pacific.
Business reporting is limited to sales as per the geographic locations and not as per the product classifications, but the main product line of the business are Hero 7, Fusion, GroPro Plus, Quik, GoPro App, and Karma Grip.
Because of the geographical diversion in the business sales vision, the business is much more connected toward the common goal of increasing the sales proportion, hence the accounting and decision related to business performance would all be geographical locations centric.
FINANCIAL PERFORMANCE
INCOME STATEMENT
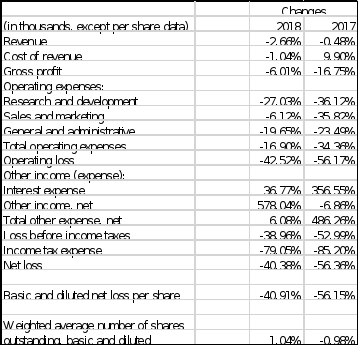
If the financial performance of the business for the period is considered, the business is having a continuous declining position, in over all income statement items, the decrease in revenue is direct lead to decrease in expenses as well, but the relation is both is slightly different as follows.
Revenues – The business revenues dropped by 0.48% in 2017 and in line by 2.66% in 2018. This may be directly led because of the decline in business sales in the regions.
Cost of Sales – The cost of sales has increased in 2017 by 9.90%, and in line in 2018 declined by 1.04%, though it was expected to decline in 2017 and 2018 with in line to decline in revenue, thus this reflects the business accounted for higher value of products, used in manufacturing.
Gross Profit – The gross profit has seen decline of 16.75% in 2017 and in line to that 6.01% decline in 2018, this reflects that the business has seen shrinkage in earnings.
Operating Losses – Although business is reporting operating losses from the 2016 period, but the losses are now shrinked by 56.17% in 2017 and in line to that further declined to 42.52%, this directly reflects the business ability to make the processes effective and reduce cost, hence there is continuous decline in losses.
Interest Expense – Business massively obtained loans in 2017 thus resulted to increase of about 356.55% in 2017, from interest cost of 2,992 (2016) to 13,660 (2017), further on the business interest cost increased more in 2018 by 36.77%, this reflects that the business is obtaining massive loans to finance the operations or any expansions.
Net losses – Net losses for the period have shrinked in 2017 by 56.36% and further declined by 40.38% in 2018, reflecting business operating capabilities to perform with less expenses, to save up the costs, and bring back the operations to profit.
Below attached is the complete Change comparison of Income statement.
CASHFLOW STATEMENT
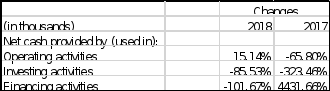
The cash flow statement of GoPro Inc., has been analyzed and reflects below mentioned performance for the period.
Operating Activities – The operating activities have shown a decline in negative cash flows by 65.80% in 2017, this is in relation to decrease in net losses for the period, and a slight increase in losses is again reflected in the period 2018 by 15.14%.
Investing Activities – There has a massive investing activities cash outflow, clearing reflecting that the business has done a major acquisition or merger in 2017, as the change is 323.46%
Financing Activities – The financing activities reflect that the business has been taking massive cash flows in form of lending, as this supported by finance cost increase as well, the change in 2017 has been observed by 4431.66%.
Below attached is the summarized form of cash flow statement and relevant changes in the period.
FINANCIAL PERFORMANCE
The business financial performance has been compared in relation to the industry in which its operating, in line with the competition, and the over all sector of business operations, hence preparing a reasonable comparison for the business performance.
Valuation Ratios
P/E ratio – If the P/E ratio of the business is considered, it stands at -16.96%, reflects that the profitability of the business has significantly dropped, while in line to industry or the sector this ratio is compared, the industry stands at 16.26% profit, and Sector stands at 26.11% profitability.
Price/Revenue ratio – If the Price/Revenue ratio is considered the business has slight better number at 0.46, while the industry reflects same ratio at 2.81.
Financial Strength
Quick ratio – The quick ratio of the business is at 1.09 which reflects the business ability to settle off current liabilities through liquidation of current liquid assets, the industry ratio is slightly lower at 1.04 and sector ratio is at 1.50.
Current Ratio – The current ratio of the business is at 1.58, while industry norm is at 1.28, this is actually a good condition and hold sufficient cash and other readily liquid assets in the business that its reflecting its ability to be able to settle of current liabilities through sufficient current assets.
Debt to Equity Ratio – The total debt to equity ratio of the business stands at 0.66, which is the indication of the structure of the business is mainly the debt based, and less equity based, this kind of business structure, would sooner or later make the business management loose control to creditors, as the performance will significantly decline.
Profitability ratios
Gross Margin – The business gross margin is reported at 31.48%, while the industry margin is at 34.31%, thus clearly reflected that the business is performing equally to the industry competition.
Operating Margin – The operating margin of business is pretty low, standing at 2.24%, while the industry stands at 26.64%, this is because of massive decline in sales and increased operational cost.
Management Effectiveness
Return on Assets – The return on assets is negative 4.69%, while the industry is at 11.31%, hence this reflects that the business is not even close in competing to industry average of performance.
Return on Equity – The return of equity is at loss of 16.17%, while the industry is at 41.56%, this reflects that the business is not able to generate any profit, but loss on the invested equity to shareholders.
References
GoPro Inc. (2018, December 31). 10-k filling. Retrieved from GoPro Inc.: https://investor.gopro.com/financials-and-filings/Form-10K/default.aspx
GoPro Inc. (2019). Retrieved from money.cnn: https://money.cnn.com/quote/profile/profile.html?symb=GPRO


