Need presentation based on uploaded document As soon as possible i have only 3 hours thank you
Toronto Stock Exchange (Barrick Gold Corporation)
Matin Dobari (1810126)
Ahmed Abdelaziz (1810296)
Suresh Kumar Penupothula (1712000)
Samuel Villegas Warren (1910285)
Mandeep Duggal (1813793)
Jennifer Uloma Egenti (1910334)
Fereshteh Sameri (1813164)
University Canada West
Financial Management (FNCE 623)
Dr. Reymond Chan
Feb 5th, 2020
Executive Summary
This section is placed on its own page. Abstract should be no more than 250 words. Do not indent this section. This section may not be required by your professor.
Keywords: This is an indented list of 3-5 words, phrases or acronyms that describe the paper. If there is a second line, it is not indented.
Toronto Stock Exchange (Barrick Gold Corporation)
The gold mining industry implicates a procedure of mining and processing gold from the earth and selling it to the related market. Gold is among the popular and valuable commodities worldwide. Currently, this industry is operating on all continents, excluding Antarctica (Gold mining, n.d.). The world gold reserves were estimated at 54,100 in 2018, and Australia, South Africa, Russia, and the United States have the largest gold reserve respectively; however, China is the top gold producer in the world. The word gold production indicates a 2% increase annually (Natural Resources Canada, n.d.). Barrick is one of the world's biggest gold producers based in Ontario and is operating in North and South America, Africa, and Australia. Barrack is the world's most valued gold mining company. The company has mining projects in 15 countries. Barrick shares trade under the symbol of GOLD on the New York Stock Exchange and with the symbol of ABX on the Toronto Stock Exchange (Barrick, n.d.)
Ratio Analysis
For the sake of this project, we are going to be using the SWOT analysis to determine what areas are at an advantage for Barrick Gold Corporation and what area is a weakness for them. Barrick gold would be compared with three other gold mining companies like Newmont Gold Corporation, which is the world’s largest gold producer, Kirkland Gold, which is a Canadian based gold producer and finally, Kinross Gold Corporation, which is also a senior Canadian based gold producer. In the table below, we have analyzed the four different ratios, dating 3 years back for each Gold mining corporation.
|
| 2018 | 2017 | 2016 |
| Current Ratio | NGT : 2.953 ABX : 2.3849 KL : 2.0657 K : 2.6092 | 3.6237 2.6812 2.2673 3.903 | 2.6726 2.6795 1.4672 3.2628 |
| Equity/Debt Ratio | NGT : 0.3717 ABX : 0.6114 KL : 0.0176 K : 0.3832 | 0.3529 0.5804 0.0333 0.3751 | 0.3887 0.769 0.1247 0.4142 |
| Account Receivable Ratio | NGT : 20.9624 ABX : 29.2056 KL : 45.4524 K : 31.6825 | 31.135 35.0377 47.7084 36.1774 | 19.4752 34.3695 53.9153 27.2742 |
| Return on Investment Ratio | NGT : 2.1164 ABX : -9.5159 KL : -0.4088 K: 21.5218 | -0.4557 8.6971 6.9618 13.3352 | -5.0995 4.7566 -1.8437 5.0739 |
Where,
NGT - Newmont Gold Corporation
ABX - Barrick Gold Corporation
KL - Kirkland Gold
K - Kinross Gold Corporation
Current Ratio
The current ratio shows that Barrick Gold compared to its other competitors, has enough financial resources to remain relevant in its industry. Although the current ratio does not represent the company or industry as a whole, it still shows that that Barrick Gold can keep up in its industry.
Account Receivable Ratio
Barrick Gold like the rest of its competitors has a high receivable turnover ratio. This means that the company has reliable clients and is able to manage the credit that it gives to its client.
Equity/Debt Ratio
The Company’s Debt/Equity Ratio is very minimal. This means that the company is not financing most of its operations from borrowed assets. This serves as a strength to the Company, as it still has a surviving chance in its industry.
Return on Investment Ratio
Looking back at the table, it is obvious that Barrick Gold had a loss on investment in 2018, but managed to secure a gain in previous years. But compared to Newmont and Kirkland Gold corporations, Barrick Gold did well with securing its assets.
| Profitability measures | 2018 | 2017 | 2016 |
| Profit margin | -21% | 17% | 8% |
| Return on assets | -7% | 6% | 3% |
| Return on equity | -16% | 13% | 6% |
| Earnings Per Share | -1.32 | 1.23 | 0.56 |
| Book Value Per Share | 8.0362 | 9.487 | 8.848 |
| P/E Ratio | -6.0701 | 7.692 | 15.74 |
From The investors perspective, the earnings per share went negative from 2017 to 2018, but this does not mean that the company is in crisis, according to TMX Money website Barrick Gold Corporation made an acquisition of the company Rangold at the end of 2018 (TSXMoney, 2020).
Financial Analysis
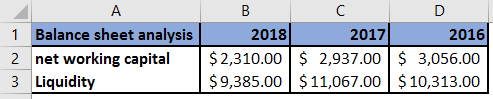
The company paid long-term debts in 2018. The company use the market value adjustments in the declared reports. The company did these adjustments because they did not want to lose its investors by showing the deficit. The company has less liquidity because most of its assets are fixed or long-term assets. The net-working capital of the company has decreased because it had paid long-term debts in 2018. That is why the gap between NWC of 2017 and 2018 is more as compared to 2016 and 2017.
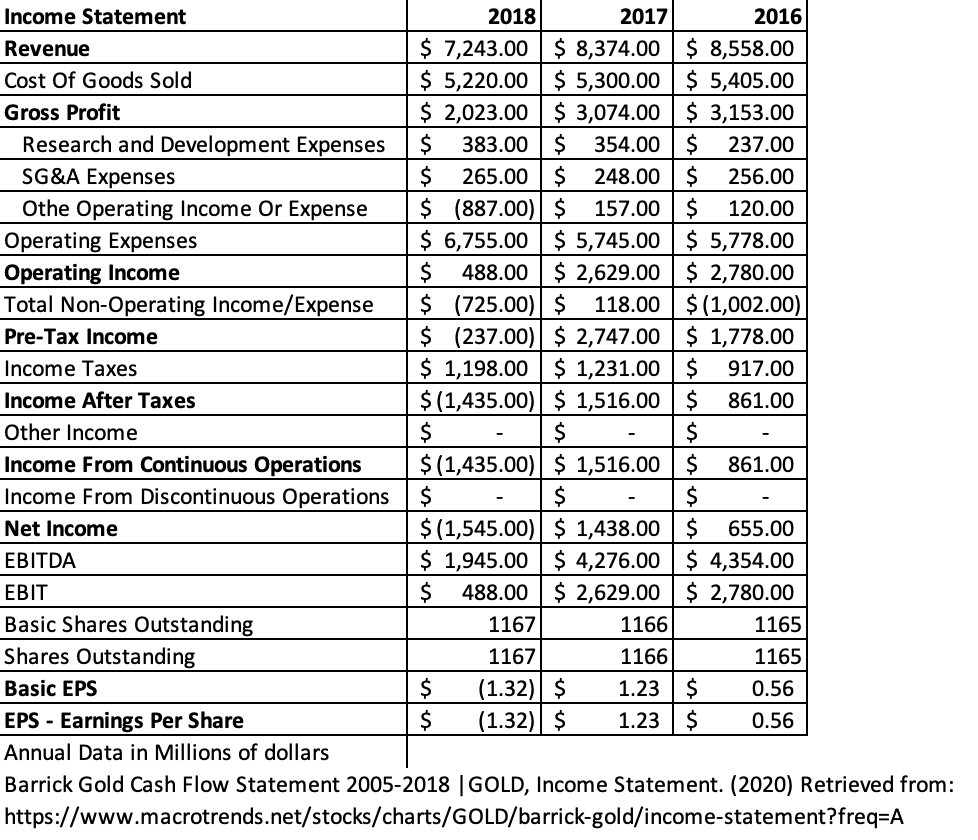
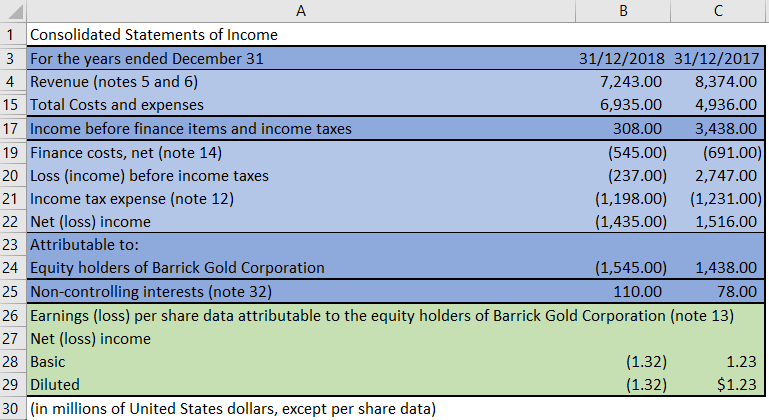
In 2018, the income statement showed a negative balance which means that the company faced loss in 2018. However, by using market value the report shows that it was a profitable earning per share. Also, the company is using non-GAAP but is following the outline from IFRS.
The investment efficiency in 2018 was lower than it was in 2017 because the cost of operation to revenue was lower in 2017. The ratio of cost of goods sold to the revenue is greater in 2018 than it was in 2017 which means the production cost for the company has risen in 2018.
Statement of Cash Flow :
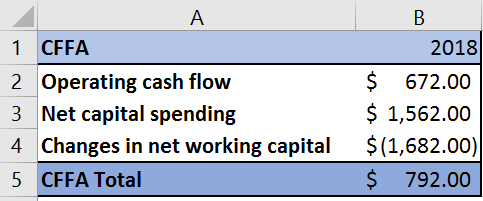
The cash flow was lower in 2018 than earlier fiscal years as we can analyze they paid off a huge part of long-term liabilities. On the other hand, there was a capital investment that drained a portion of the cash flow as well.
CFFA in 2018 increased because of the negative changes in NWC.
Recommendations
Overall, it is the right decision to invest in this company for the long term due to the following reasons.
1. In the Management Discussion and Analysis (MD&A), all financial statements are in USD for the materiality and investor's needs. This information is fundamental for likely investors regarding making an investment decision.
2. Sustainability is in the heart of this business, and in all the aspects such as environment, workforce, social, and economical of the host country is considered. Consequently, this company is not concentrating on the short term goals and interests and is running a sustainable business benefiting all the stakeholders.
3. The company reports are on IRFS and non-GAAP valuation, which means it is based on market value. Hence the figures and results are more realistic and up to date.
4. Barrick has mine reserve which is allocated for the future as financial backing; hence the company has a sustainable future on the miming field.
5. Barrick acquired Randgold at the end of 2018; hence the company has more reserves and assets that guarantees future sustainability and profit.
References
Barrick. (n.d.). About Us. https://www.barrick.com/English/about/default.aspx
Barrick Gold Corporation (2020). Retrieved 4 February 2020, from https://web.tmxmoney.com/financials.php?qm_symbol=ABX
Barrick Gold Financial Ratios for Analysis 2005-2018 | GOLD. (2020). Retrieved 4 February 2020, from https://www.macrotrends.net/stocks/charts/GOLD/barrick-gold/financial-ratios
Corporate Finance Institute, (2020). Industry Analysis - Top 3 Methods to Assess and Analyze an Industry. Retrieved 4 February 2020, from https://corporatefinanceinstitute.com/resources/knowledge/strategy/industry-analysis-methods/
Gold, B. (2020). Barrick Gold (GOLD) Financial Ratios - Investing.com Canada. Retrieved 4 February 2020, from https://ca.investing.com/equities/barrick-gold-corp.-ratios
Gold mining. (n.d.). Mine production. https://www.gold.org/about-gold/gold-supply/gold-mining
Kinross Gold Financial Ratios for Analysis 2005-2018 | KGC. (2020). Retrieved 4 February 2020, from https://www.macrotrends.net/stocks/charts/KGC/kinross-gold/financial-ratios
Kirkland Lake Gold Financial Ratios for Analysis 2016-2018 | KL. (2020). Retrieved 4 February 2020, from https://www.macrotrends.net/stocks/charts/KL/kirkland-lake-gold/financial-ratios
Natural Resources Canada. (n.d.). gold facts. https://www.nrcan.gc.ca/our-natural-
resources/minerals-mining/minerals-metals-facts/gold-facts/20514
Newmont Goldcorp Financial Ratios for Analysis 2005-2018 | NEM. (2020). Retrieved 4 February 2020, from https://www.macrotrends.net/stocks/charts/NEM/newmont-goldcorp/financial-ratios?freq=A
Appendix
Income Statement
Balance Sheet

Cash Flow

Ratios

Cash Flow

CFFA
Income Statement
Balance sheet Analysis
Balance Sheet


