Can I get some help?
Data Analytics
Quiz
Name: ____________________________________________
Choose the right answer
1. Which of the following statements is an outcome-based result?
A. Asking customers if they are happy with the services
B. Making eye contact and expressing a friendly demeanor to customers
C. Processing orders to the customers with 100 percent customer satisfaction
D. Trying to meet the weekly goals for better work output
2. A customer service representative takes a call from a customer with an idea on how to improve a product. After the call, the rep calls the marketing department and passes along the idea. This is called?
A. Positional product improvement
B. Application development
C. Brainstorming
D. Inter-departmental support
3. In order to improve sales at your company you schedule a meeting with the marketing, sales, and customer service. The other teams do not understand why customer service has been invited. You explain:
A. Customer service speak with the customers and can provide valuable data.
B. If you are successful in your data analysis, the company will no longer need a
customer service department and these employees will work in marketing and sales.
C. All employees, regardless of department, will be doing sales now and need to be
trained properly.
D. You want all the departments there so they can get to know each other and improve
internal communication.
4. You have decided to create a presentation to display the information you have gathered during your data analysis. You begin by filling the first slide with which type of data?
A. Your name and the company's name along with an appealing image related to the
topic being presented.
B. The details, examples, charts, and results related to your presentation
C. Background of the topic.
D. Frequently asked questions
5. The last slide in a presentation should usually be:
A. a summary of your bullet points.
B. a frequently asked questions (FAQ) slide.
C. a slide informing viewers where to get a copy.
D. a title slide to remind them what your presentation was about.
6. When creating a presentation for a small-to-large audience, it is advisable to incorporate which of the following?
A. Humorous pictures and cartoons
B. Lists of data
C. Quotes from famous people
D. Charts and graphs
7. You are trying to decide on the best way to display data about how things will progress on a long-term analysis of data. Which type of chart would you choose?:
A. An exploded pie chart
B. A Venn diagram
C. A Gantt chart
D. A dashboard
8. Frequently Asked Questions often do which of the following?
A. Show calculations used to gather data
B. Refer back to certain key points or statistics in the presentation
C Make complex predictions about the future.
D. Identify sources used in the production of the presentation
9. Which of the following would be displayed on a sales dashboard?
A. All of the items or services your company sells or performs
B. Colorful images to encourage him or her to make more sale
C. Sales trends over a period of time
D. Customer names and address by regio
10. Which of the following types of software is often used to display information for small-to-large audiences?
A. Grafting software
B. Database software
C. Presentation software
D. Calculating software
11. Which of the following would best describe a "Webcast"?
A. A list of what users are looking at on a Website and how long they look at it.
B. A presentation that takes place in a distance-oriented environment where one person
uses a tool to present important and valuable information to an audience that logs in
from across the globe
C. A tool often used to help a company know their customers better, know how to
communicate with their customers better and create products for their customers.
D. A type of blogging, over the Web, in which one regularly expresses his or her thoughts
or feelings.
12. Which of the following is the best way to create an effective chart for presenting a report?
A. Go in detail to provide all the information that is needed.
B. Use as many bullets as possible.
C. Use animations and a variety of colors to make it attractive.
D. Highlight specific points that you want the audience to know.
13. As a data analyst, you are very interested in analyzing network traffic by examining Web logs. Which of the following tools can provide you with this information?
A. Survey Monkey
B. data.gov
C. Google Analytics.
D. Capsa Free
14. After working as a data analyst at a company for some time, you discuss the possibility of redesigning the Website with the CEO. When asked about how you came about your decision, you:
A. state that, even though customers are spending a lot of money on the site, the look
and feel does not fit the company.
B. explain that it is impossible to get things that you need, like click rate and usability
from such an antiquated site.
C. explain that you analyzed click rate and usability of the Website and do not believe it
is adequate.
D. explain that it has been over a year since it was designed and think it should just be
updated.
15 A company posted an advertisement on its Website for the sale of a product. What kind of data will you measure to find out the time during which the least number of users clicked on that ad?
A. Conversion rate
B. Cost per click
C. Click-through ratio
D. Impressions
16. After you give a presentation, your manager tells you that your presentation was good but it could have been better, if you would have added which of the following?
A. Animations to make the presentation more exciting
B. More charts and colors to create visual interest
C. FAQ slides to invite discussion and questions
D. Descriptive content on each slide
17. As a data analyst, you need to collect accurate, unbiased data in order to establish a benchmark of the services provided by the company. Which technique should you use?
A. Analyzing the sales report
B. Contacting every customer through phone calls
C. Conducting online/mobile surveys
D. Analyzing Web logs
18. As a data analyst, you are preparing a presentation report. You want to add the statistics showing the profit that the company will make after completing the proposed project successfully. Which of the following is the correct way to help the investors understand all aspects of the topic you are presenting?
A. Highlight the images with the help of animations
B. By discussing the team members who are going to work on the project
C. Presenting statistics with both positive and negative impact
D. Use a line chart to present the statistics report
19. Which of the following would be classified as a "Web log"?
A. A list of Website pages accessible to users or crawlers.
B. A slowing of the bandwidth on your site due to congestion and too many users visiting
your site at once.
C. A detailed comment from a customer discussing their thoughts, likes and dislikes
about your company.
D. A list of what users are looking at on a Website and how long they look at it.
20. As a good data analyst, what should be your responsibility on being approached by your company for seeking opportunities in an illegal way?
A. You would use every possible way to benefit you and your company.
B. You shouldn't use illegal ways to seek opportunities.
C. You know it is wrong but do nothing about it.
D. You should ask your manager to list out some of the ways through which you can
accomplish the target
Solve the following exercises:
21. Two vectors, v1 and v2, are created with the following R code:
v1 <- 1:5
v2 <- 6:2
What are the results of cbind(v1,v2) and rbind(v1,v2)?
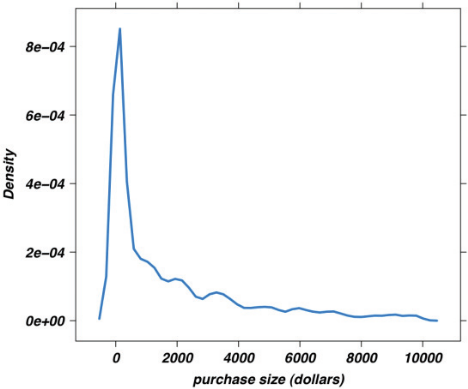
22. An online retailer wants to study the purchase behaviors of its customers. The figure below shows the density
plot of the purchase sizes (in dollars). What would be your recommendation to enhance the plot to detect more structures that otherwise might be missed?
23. Using the ruspini dataset provided with the cluster package in R, perform a
k- means analysis. Document the findings and justify the choice of k. Hint: use
data(ruspini) to load the dataset into the R workspace.
24. Following is a list of five transactions that include items A, B, C, and D:
● T1 : { A,B,C }
● T2 : { A,C }
● T3 : { B,C }
● T4 : { A,D }
● T5 : { A,C,D }
Which itemsets satisfy the minimum support of 0.5? (Hint: An itemset may include
More than one item
25. A local retailer has a database that stores 10,000 transactions of last summer.
After analyzing the data, a data science team has identified the following statistics:
● {battery} appears in 6,000 transactions.
● {sunscreen} appears in 5,000 transactions.
● {sandals} appears in 4,000 transactions.
● {bowls} appears in 2,000 transactions.
● {battery,sunscreen} appears in 1,500 transactions.
● {battery,sandals} appears in 1,000 transactions.
● {battery,bowls} appears in 250 transactions.
● {battery,sunscreen,sandals} appears in 600 transactions.
Answer the following questions:
a. What are the support values of the preceding itemsets?
b. Assuming the minimum support is 0.05, which itemsets are considered
frequent?
c. What are the confidence values of {battery}→{sunscreen} and
{battery,sunscreen}→{sandals}? Which of the two rules is more interesting?
d. List all the candidate rules that can be formed from the statistics. Which rules
are considered
interesting at the minimum confidence 0.25? Out of these interesting rules,
which rule is considered the most useful (that is, least coincidental)?


