I need help with my final assignment.
This project is a team project. It must be done in teams of one, two, three, or four people (preferably three).
Teammates must be from the same professor's class (not necessarily the same lab section).
Students that have members from different professors will have their submissions refused.
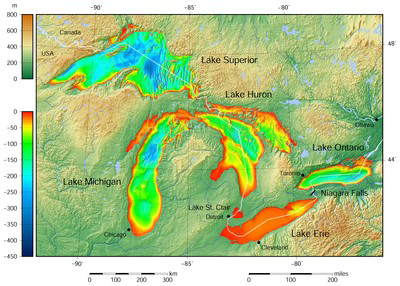
On this project you will make calculations and conclusions based on real data collected by the NOAA (The
National Oceanic and Atmospheric Administration, an agency of the United States government) on the “Daily
Lake Average Surface Water Temperature” of six lakes (Ontario, Erie, Huron, Michigan, Superior, and St.
Clair) during the 2019 calendar year.
You can find the actual data file here that contain the average temperatures for each day of the year for each
of the six lakes. Data were collected between January and December 2019 and are in degrees Celsius.
https://coastwatch.glerl.noaa.gov/ftp/glsea/avgtemps/2019/glsea-temps2019_1024.dat
Days are numbered 1 to 365, 1 being January 1st and December 31st being 365.
You must use the C program to read the file and put the data into arrays. Download the file and clean it up to
make it compatible – simply remove all lines above
2019 001 3.29 4.19 3.50 4.06 4.59 2.9
HINT > Use a simple text editor to clean up the file.
Do not enter data by hand!
HINT > Have a loop that goes from 1 to 365 and fill one array per lake (one cell per iteration). The cell number will act as the day of the
year (just leave cell 0 unused).
Required elements:
One program with separate helper functions (one .c file) is the recommended implementation but
once .c file (with main function only) or multiple .c files (one per required element) are also good
models.
All computations to be done in C using the imported data file.
NOTE > You are not obligated to use Geany, you can use any C IDE (Quincy, C-Free...).
1. Calculate the yearly average temperature for each of the lakes, and the yearly average for all six lakes
put together.
2. Indicate which lake is the coldest and which one is the warmest, based on the average yearly
temperatures calculated in step #1. Also indicate which lakes have average temperatures above the
average of all the lakes and which ones are below that same average.
3. Indicate the day and the temperature for the warmest water temperatures for each of the lakes. Do
the same for the coldest temperatures. You must convert the day of the year value into a date/month
format.
NOTES > If there are multiple dates with the coldest or warmest temperature display them all, but if you display only one you
will not be penalized. Date/month conversion must be exact. Never assume that all months have 30 days.
4. Indicate the day, lake and temperature of the warmest water temperature overall (all lakes
combined). You must convert the day of the year value into a date/month format and indicate which
lake. Do the same for the coldest temperature.
NOTE > If there are multiple dates with the coldest or warmest temperature display them all, but if you display only one you
will not be penalized. Date/month conversion must be exact. Never assume that all months have 30 days.
5. Calculate the summer average (day 172 to day 265) for all 6 lakes (one average per lake). Display
the names of the lakes in order from warmest to coldest. Is the order from warmest to coldest the
same as with the yearly average calculated in step #2?
6. Calculate the winter average (days 1 to 79 and days 355 to 365) for all 6 lakes (one average per
lake). Display the names of the lakes in order from warmest to coldest. Is the order from warmest
to coldest the same as with the yearly average calculated in step #2?
7. Assuming that you can swim comfortably in the lake if the temperature is above 20 degrees. Calculate
the number of days in the year you can swim for each of the 6 lakes.
8. Assuming that lakes freeze when the water falls below 0 degrees. Calculate the number of days in
the year that the lake is frozen.
NOTE > You must calculate the number of days with a C program, even if you know that there are none. Your program should
work for years that would have some.
9. Re-do question 1 (the 7 yearly averages) but with data from 2018 instead. Make a table of the
averages side by side to illustrate the two yearly results. Any notable changes between 2018 and
2019? The data file for 2018 is here: https://coastwatch.glerl.noaa.gov/ftp/glsea/avgtemps/2018/glseatemps2018_
1024.dat
Important Notes:
All computations are to be done with C only. No hand computations are permitted.
II. You are to write a report. Your report must have an introduction about the purpose of the report and its
intended audience. In the initial paragraph, present all team members and specify who did what (not
applicable if you work alone).
III. The report must be detailed, well presented and attractive. Don't be afraid to use colors to emphasize
parts of the report. Be creative in the use of tables and images. Points will be awarded to the exactness of
the computations, appearance, ease of reading (use font sizes that are easy to read and use adequate line
spacing and margins), and the quality of the English language. Length of the report should be approximately
between 3 and 7 pages (excluding C codes in the appendix and cover page). The 3-7 pages are just
guidelines, you will not be penalized if you have more (very unlikely you will have less). The report consists
of the answers provided by each of the program requirements (the actual outputs from the
program as cut/paste or screenshots) and a short paragraph explaining why the results make
sense. Be original! Plagiarism will be dealt with severely to the full extent of Ryerson academic integrity
regulations. The report and programs will be submitted to a plagiarism detection system and non-original
submissions will incur an extra 5% penalty on the final grade (in addition to the 0/10 mark which will be
assigned for a non-original assignment) as per CMF and Ryerson policy #60. You will get a feedback from the
plagiarism detection system after submission. If your non-originality rating is above 50% your submission is
flagged as plagiarized. Any rating above 40% will be scrutinized and may incur penalties.
IV. Your report must have a conclusion about your experience doing this project and how you would do things
differently if you had to do this again.
V. Finally, as an appendix (a few pages at the end of the report), put out the codes of all your C programs (.c
files). It is also acceptable to attach the .c files separately in your D2L submission (in that case you may have
to change the extension from .c to .txt for the files to be accepted by D2L). Your report must be submitted
in PDF format (you can write it using Microsoft Word or OpenOffice/LibreOffice/NeoOffice Writer and export
to PDF at the end).
Submission
1. Project reports are to be submitted in PDF format on D2L/Brightspace. Only one submission per team. Do
not submit duplicates! Teammates must be clearly identified as per point II in the important notes above.
3. Projects are not marked on code efficiency but on accuracy of results, attractiveness and completeness of
the report and of course originality (never submit copied work!). Think of the original data as experimental
data, your C program converting data into meaningful information, and your comments in the report as your
own conclusions and insights into the results obtained.