hi i have start with my project but i need help to check and edit anything if it's required i have attached my project, sample project and the project rubrics
Computer and Information Science
Bachelor of Applied Science in Information Systems
CIB-3403 Advanced database technology
Al Dhafra Insurance Company
Submitted by:
Table of Contents
Introduction .................................................................................................. 3
Purpose of project .......................................................................................... 3
PART A –
Business process………………………………………………………………………4 Determine the Grain ....................................................................................... 4
Identify the Facts ...........................................................................................5
Identify the dimensions .................................................................................. 5
Dimensional Modelling and Star Schema ..................................................... 6
Star Schema ..................................................................................................... 6
Report ............................................................................................................ 7
Drill down Capacity ......................................................................................... 8
PART B –
Tableau ................................................................................................ 9
Description ........................................................................................... 10
Type of analysis ......................................................................................... 10
Charts (screenshots), and a suitable dashboard ............................................. 11
Outcomes ............................................................................................... 12
References ..................................................................................................... 12
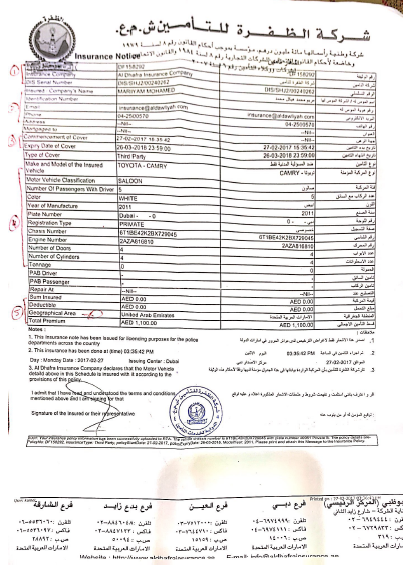
Introduction
Al Dhafra Insurance Company P.S.C. is a Public Shareholding Company entirely owned by the U.A.E. nationals. It is incorporated in Abu Dhabi by Emiri Decree No. 8 of 1979 and registered under the provisions of The UAE Insurance Law (Federal Law No. (6) of 2007 enacted in February 2007). The Company’s Authorized Capital is Dhs.100 Million. Paid-up Capital is Dhs.100 Million. Shareholders’ Equity is Dhs.342 Million as at 31/12/2017. The total number of employees is 178. The Company is committed to best management practices to achieve all-round excellence. The company has been rated as “Baa1 Stable Outlook” Insurance Financial Strength Rating (IFSR) by Moody’s Investors Service in 2018.
Purpose of project
After reading and analyzing the bill we identify that we will create and design a dimensional modeling and star schema based on recent that we have it from Al-Dhafra Insurance Company. The report will include a dimensional model of the insurance detail data and will examine and discuss the including topics:
1. Identify the Facts
2. Identify the dimensions
3. Determine the Grain
4. Draw the star schema
5. Include reports that can be generated from our dimensional model
6. Discuss the drill down capability
Part A:
Select the business process
Declare the grain
The grain refers to the 'level' at which you're taking a measurement. A fact table describes a measurement taken of a business process, so the best way to describe the grain is to describe what you get for each row. The grain/level element is that you might be storing a row at a level of product, or you might be storing it at some grouping of products. In my case the grain will be the minimum level on upon which facts are defines includes:
Insurance Sale Detail
Cust_ID(FK)
Comp_ID(FK)
Time_ID(FK)
Car_ID(FK)
Location_ID(FK)
Total Premium
Identify the dimensions
A dimension table is a table in a star schema of a data warehouse. A dimension table stores attributes, or dimensions, that describe the objects in a fact table. Dimensions categorize and describe data warehouse facts and measures in ways that support meaningful answers to business questions. In our report, we defined the dimension that will help to read and understand the insurance bill.
Here are our dimensions table: - 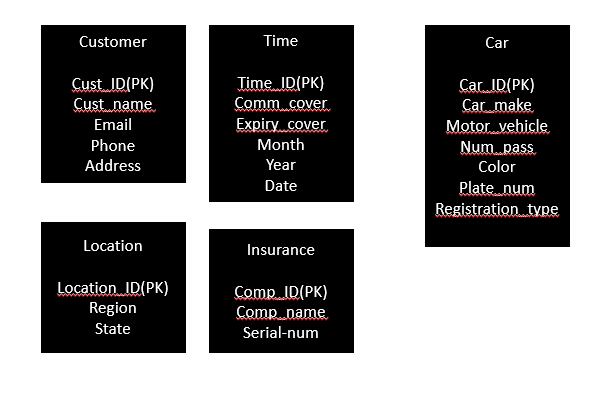
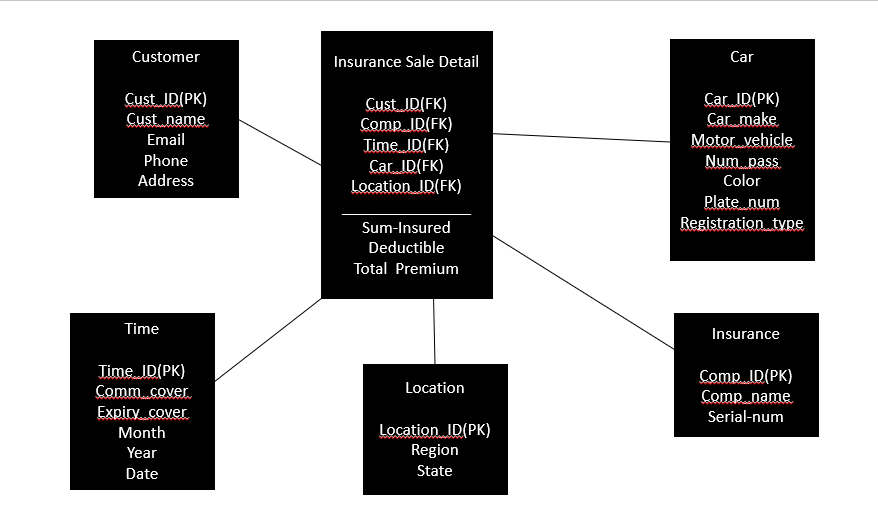
Identify the facts
A fact table is a central table in a star schema of a data warehouse. A fact table stores quantitative information for analysis and is often denormalized. And it has all primary keys from dimensions table.
Here is our fact table: -

Draw the star schema
reports that can be generated from dimensional.
According to the dimension model, the fact table contains some facts about our company. As we mentioned in our star schema above that the fact table having foreign keys that linked with my dimension table.
Customer Table:
The customer table includes the detail of the customer. Cust_ID is acting as Primary key and has other attributes like Cust_Name, Address, Phone, Email.
Time Table:
The Time table includes some detail about the time. Time_ID is acting as Primary key and there are many different attributes like Comm_cover, Expiry_cover, month, year and date.
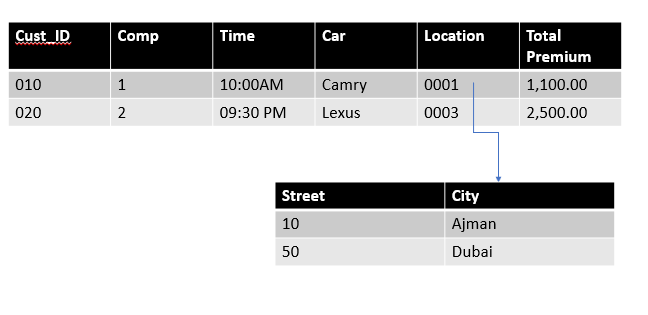
Location Table:
The location table includes some detail about the location. location_ID is acting as Primary key and there are many different attributes like region and state.
Insurance table:
The insurance table includes some detail about the insurance. comp_ID is acting as Primary key and there are many different attributes like comp_name and serial_num.
Car table:
The car table includes some detail about the car. car_ID is acting as Primary key and there are many different attributes like Car_make, Motor_vehical, num_pass, color, registration type, plate-num.
Discuss the drill down capability
Drill down is a capability that takes the user from a more general view of the data to a more specific one at the click of a mouse. And the user can get more details about what the need to know. We used drill down for Al Dhafra insurance company to help us to save and keep the information.
Insurance type
Car type
Customer name
Location
Time
These points help customer to know about the company like what they need to make their car insurance, what kind of car, where is the location also they can know which time they open. By using Dill Down technique users can view data in a variety of ways without creating new reports, dashboards. also, it can help to compare with other insurance company.
Some design issues that should be addressed when writing the report:
a. How would you handle date/time related requirements?
Sales on a given day
Sales during the evening rush period
Sales during the morning shift
We divided the time basic on month and year also having shift time.
b. Is there a customer dimension?
Yes, in our report we have dimension table cell customer and in contain some attributes that describe the customer.
c. How do you handle the Bar code on the receipt?
In our bill we don’t have any bar code.
d. Is there an employee dimension for the cashier?
No, our report does not have dimension table because we did not find any related information about employee in the insurance bill.
e. How do you handle the VAT amount?
It's came as a part of total amount.
f. What about the payment type?
There are many types for payment but in our bill they only mentioned cash payment method.
g. Is there a promotion dimension?
No, we don’t have a promotion dimension.
Part B:
Description:
The data set that we choose is about the Hollywood most profitable stories, and it contains data regarding major Hollywood movies released between the years 2007-2012. The attributes are:
Genre
Lead Studio
Audience Score
Profitability
Rotten Tomato’s in %
Worldwide gross
Year
Analysis:
After seeing different kind of software, we decide that we will Tableau Public for analysis and seeing the result because it is one of public and easiest software.
Overview of top performers:
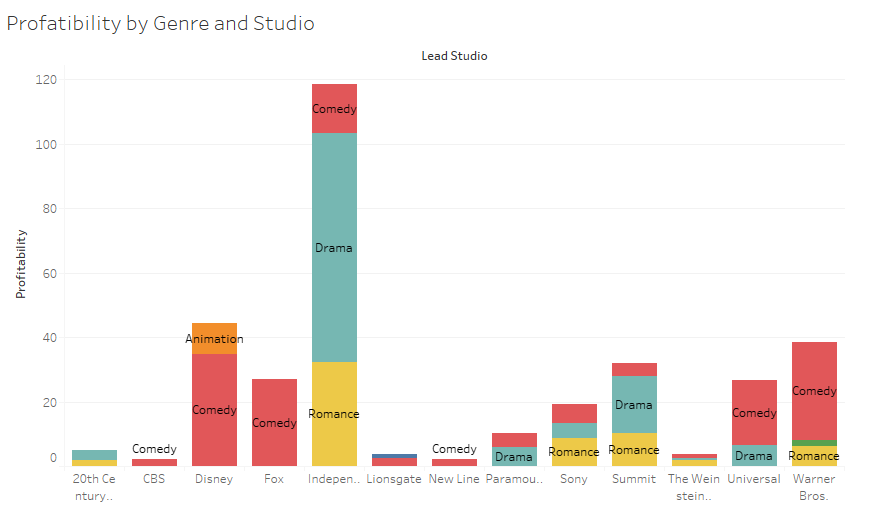
We look at overall success in terms of profitability, and not worldwide gross revenue because it is a more neutral metric as it factors out a studio's spending capability or a cast's stardom. So, I filtered my data by Genre and Studio.
Independently produced movies were most profitable, followed by Disney, Warner Bros. and Summit productions. The most profitable genre being Drama, for independent cinema, Comedy for Disney and Romance for Independent.
The contribution in Average Profitability by each genre to top studios' profitability was –
Independent (118.48 Total Avg Profitability for Three Genres) -> Drama = 70.91%, Romance = 32.36%, Comedy = 15.21%
Disney (44.44 Total Avg Profitability for Two Genres) -> Comedy = 34.79%, Animation = 9.65%
Warner Bros. (38.52 Total Avg Profitability for Three Genres) -> Romance = 6.18%, Drama = 1.78%, Comedy = 30.56%
Summit (31.89 Total Avg Profitability for Three Genres) -> Romance = 10.18%, Drama = 17.69%, Comedy = 4.02%
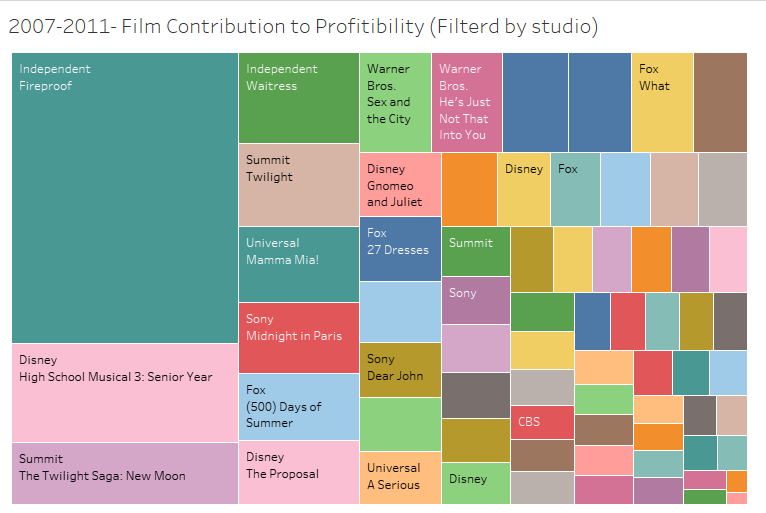
Breakdown by Films
Then we look at which films contributed to the success of these genres and studios. So, we created a tree-map where the average profits from a film would define tile size. Now, this gave us a better picture of most profitable studios, genres and films.
As we can see from the image below, fireproof outshone all other films and was the most significant contributor to profits for Independent cinema. The High School Musical movies were the most significant contributors to Summit's profitability and The Twilight Saga: New Moon in Summit and Waitress for Independent and Twilight respectively.
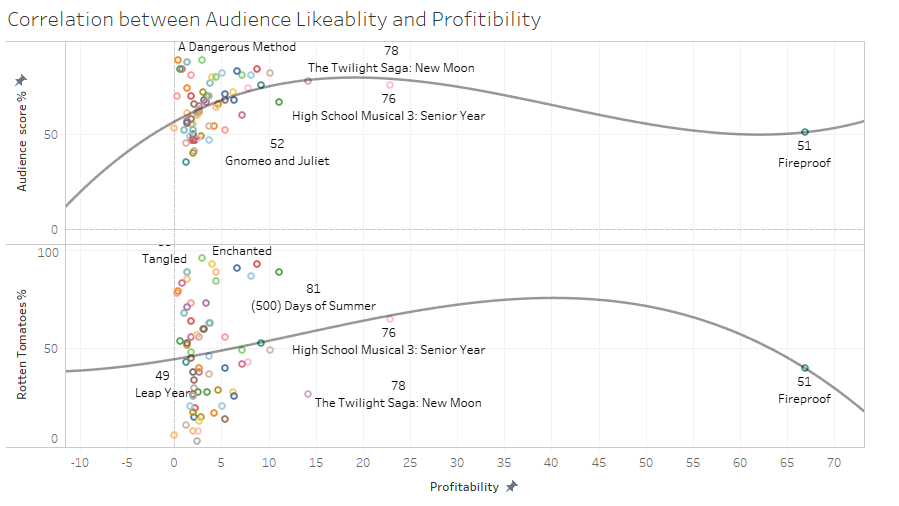
Interesting Insights!
As can be seen in the plot below, the Average Audience Score has an initial positive correlation with Average Profitability showing a Polynomial trend. However, after the scores reach a threshold at about 80% profitability keeps decreasing.
Rotten Tomatoes Score does not mirror the same, it seems to the Score has an initial positive until it reaches 78% then it keeps decreasing.
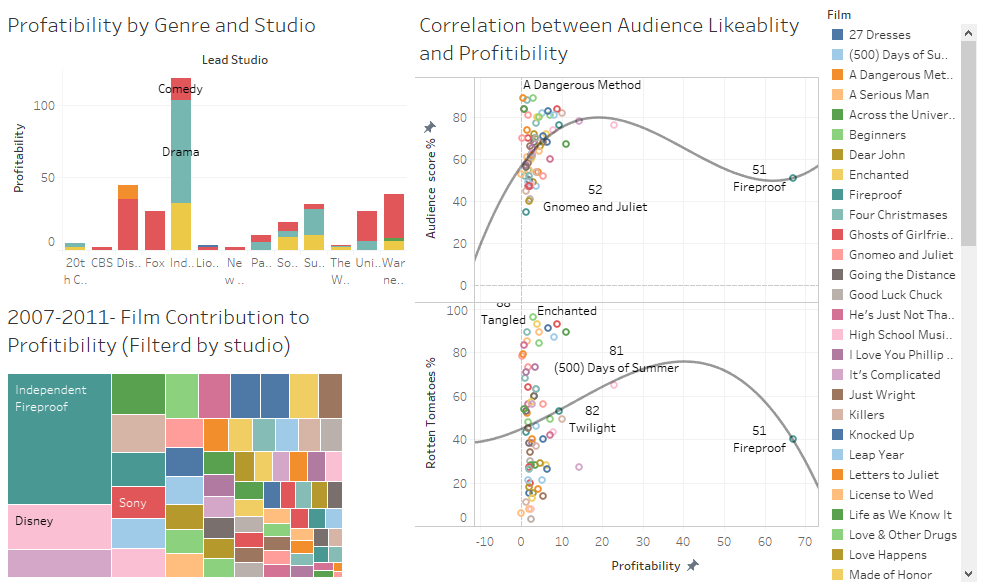
The Main Dashboard
Below is a snapshot of my final dashboard.
Conclusion
Higher Costs Lower Profits.
One reason Independent films have significantly higher profits is because their costs are considerably lower in comparison to big budget movies, they're not spending as much in marketing, promotions, acquiring A-list stars etc.
14


