The Feedback Response assignment is setup for you to interact with the assignment feedback you are given (from both my graded feedback and the recap video), and address any of your misses. For this as
Introduction:
In the report, there are procedures involved in the establishment of performance evaluation. The evaluation takes into effect the performance appraisals guidelines in consideration of the managers in their respective regions.
One of the most usual applications of Statistics is describing a set of data using Pivot table. Pivot table is used to display cube query result. There can be multiple pivot tables placed in an Excel sheet which can be placed easily in the excel sheet. The slicer can also be used in multiple pivot tables easily. The pivot table can also be spanned across the multiple excel sheets easily
Given a set of data, for instance, the data on comparison among attributes of popularity of our undergraduate classes. By analyzing and examining the raw data, we can make and draw logical conclusions or even compare, contrast or rank the data or establishments based on the specified attribute. Evaluating the status of any sort of data by considering its attributes that effect on public is a very important aspect for the growth, examine and development of population
The use of Pivot table Analysis measures are the most effective ways to examine the data. To name some, one needs to employ the application of measures of central tendencies, measures of variability, and positions, estimation and correlation. Once data are gathered and analyzed, one will be aware of the attribute given the most importance by the population of the data, and also those given the least importance. Fortunately, Excel has a feature called pivot tables that can solve all these problems. Pivot tables quickly summarize long lists of data. By using a pivot table, you can calculate summary information without writing a single formula or copying a single cell. But the most notable feature of pivot tables is that you can arrange them dynamically. For example, say you create a pivot table summary using raw census data. With the drag of a mouse, you can easily rearrange the pivot table so that it summarizes the data based on gender or age groupings or geographic location. This process of rearranging your table is known as pivoting your data: you're turning the same information around to examine it from different angles
Objective: The goal of this assignment is to give more comfort investigating a data set that is unknown, and will require some data cleaning before you can make use of it. Preparing the data to be interpreted generally is the most labour-intensive part of analysis. This assignment will stretch your critical thinking skills, as you are given less direction by design. In a professional situation, will often be given even less direction, and be expected to use your resources to answer the questions that come up along your analytical process.
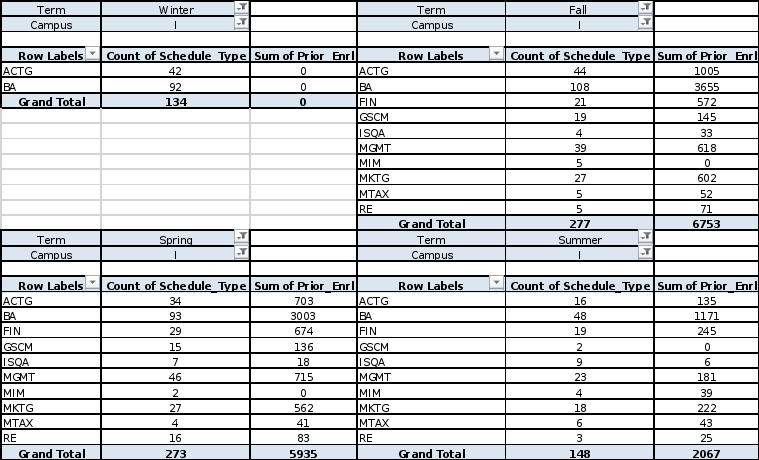
To analyze the 18-19 academic year (summer, fall, winter, spring) enrolment by course and term. The new Provost in an attempt to convince her to invest more money in the undergraduate business program because we are growing both online and on campus.

Discussion:
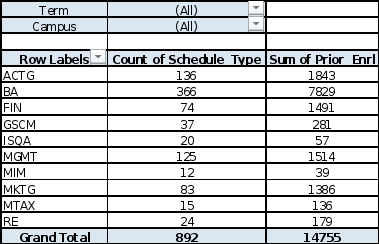
From the above table we can see that the most popular undergraduate class is BA, it has the total 7289 Prior Enrolment out 14755 during 2018 and 2019. The rate
| Term | (All) |
| |
|
|
|
| |
| Row Labels | Count of Schedule_Type | Count of Meeting_Location_1 | Count of Meeting_Time_1 |
| ACTG | 136 | 136 | 83 |
| BA | 366 | 361 | 230 |
| FIN | 74 | 74 | 48 |
| GSCM | 37 | 37 | 9 |
| ISQA | 20 | 20 | 6 |
| MGMT | 125 | 123 | 39 |
| MIM | 12 | 12 | 3 |
| MKTG | 83 | 83 | 59 |
| MTAX | 15 | 14 | 4 |
| RE | 24 | 24 | 13 |
| Grand Total | 892 | 884 | 494 |
The fall BA term is the most popular and which is the least and MIM is the least popular.

| Term | (All) |
|
|
|
| Row Labels | Count of Schedule_Type |
| ACTG | 136 |
| BA | 366 |
| FIN | 74 |
| GSCM | 37 |
| ISQA | 20 |
| MGMT | 125 |
| MIM | 12 |
| MKTG | 83 |
| MTAX | 15 |
| RE | 24 |
| Grand Total | 892 |
The above chart shows BA with greatest overall enrolment. The chart also shows that MIM has the least overall enrolment. Different other courses apart from RE are also not doing well. These courses include: ISQA, MTAX, FIN, and GSCM that has lower poll in terms of total enrolment the last two years.
I’ve learned in the past how to create the Pivot Table but never been able to utilize it in research. This is great way to evaluate data and compare them. I already started creating Pivot tables for the monthly actuals of income and expenses to determine the shorts and weaknesses in my property performance.


