Develop a 1- to 2-page executive summary that describes the issue or opportunity that you are analyzing. Your executive summary should include the following: Describe the healthcare issue or opportun
Part one of the assignment
The following exercise will help orient you to the basic functionality of Microsoft Excel in preparation for FE001 Assessment Part 1. To complete this optional exercise, you will need:
This section of the Healthcare Budget Request Workbook: Step-by-Step Guide
The Excel file “Clinic.xlsx”, located in the Learning Resources
Download and open the file “Clinic.xlsx” located in the Learning Resources.

Note: An open Excel file is also referred to as a workbook.
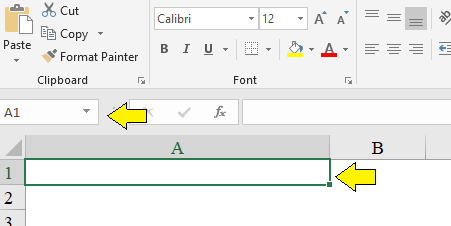
Spreadsheets organize screens of data by using columns and rows. Columns are labeled with letters and rows with numbers. The intersection of a row and column is referred to as a cell. Cell locations, or addresses, are identified based on the letter of the column and the number of the row. For example, the first cell in the spreadsheet is referred to as “A1”. Cell addresses are always shown in the Address box near the top of the screen.
Notice the tabs at the bottom of the screen that read “HealthWaysBudget” and “HealthwaysFinancials”. When clicked, these tabs open separate worksheets (individual pages used to organize different categories of data within a workbook).
In Excel, you can create many different worksheets within a single workbook. For example, in this workbook the HealthWaysBudget worksheet presents a budget report for the organization, while the HealthwaysFinancials worksheet presents several financial statements for the organization.
Note: Financial statements will be discussed in more detail later in later Competencies.![]()
Create a new tab in this workbook. To do so:
Click on the New sheet (“+” symbol) at the bottom of the screen.

To name the worksheet, double-click the tab and type “Practice”.
Note: You can also rename the new tab by right-clicking the tab and selecting “Rename”.![]()
Note that there are various types of data used in Excel:
Text is data that utilize letters. Numbers can also be used in text data. However, these numbers must be used in conjunction with letters or must manually be set to text.
Numerical data utilize numbers exclusively. Unlike text data, which can use numbers, numerical data cannot contain letters.
Currency/Accounting data utilize numbers in conjunction with a currency marker.
Dates are pieces of data that denote a date and/or time. There are multiple formats for dates within Excel.
Percentage data are a subset of numerical data that is converted into a percentage. Percentage data can be converted back into numeric, and vice versa. Converting to numeric from percentage will display the number as a decimal. For example, 89% would be converted to 0.89.
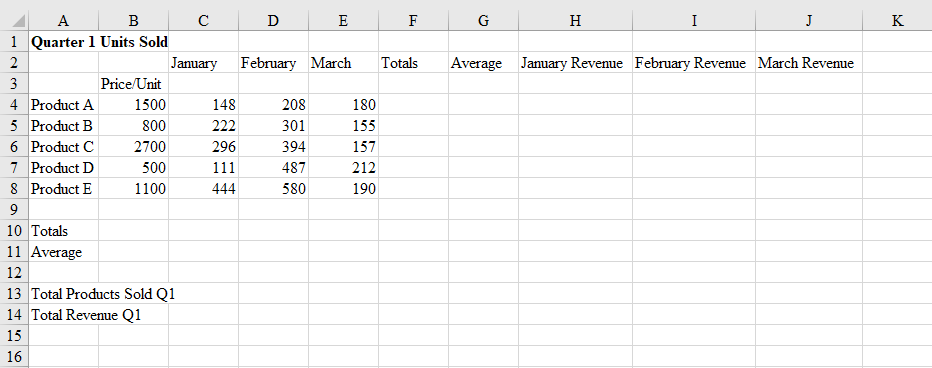
Enter the following text and numeric values on the Practice worksheet in the cell locations shown below:
Note that the text in columns H and I may be cut off as you type in adjacent columns. This is because the column is not currently wide enough to display the text without overlapping into the next column. To adjust column widths:
Place your mouse pointer between the two columns in the header area between any two columns that you wish to adjust; the column to be increased should be on the left. Double-click the mouse and the column will automatically adjust to the required size to display the results.
Using the same approach as above, you can drag your mouse (instead of double-clicking) to manually adjust the column to your preferred width. Note that the precise size is displayed as you drag your mouse.
C .You can also select the entire column by clicking on the column header. This highlights the entire column. From here, you can then right-click anywhere in the column and choose “Column Width”, then replace the current value with a desired value.
Note: If a column is too narrow to display numeric values, a series of repeating “#” symbols will appear. ![]()
Save your work by clicking on the SAVE icon in the title bar (or by choosing ‘File’ and ‘Save’).
Note: Be sure to save your work frequently. ![]()
Excel allows for most primary formatting of text and numeric data, such as typeface (bold, underline, etc.), font size and color, cell color, etc. Most of these options are available in the menu ribbon on the top of the screen (much like MS Word). If you like, make various formatting changes, such as boldface for column headings.
One of the most important features of Excel is the ability to use formulas and functions. An Excel formula is a statement you enter in a cell to calculate a value or perform some similar action. Formulas contain a combination of operators and operands. In effect, you write a formula to “teach” Excel how to calculate a value.
Functions are similar to formulas, but they are prewritten formulas that are “built into” Excel via the function bar. You only need to populate certain elements of a function, such as the range of cells (typically a contiguous group of cells) needed to calculate the value.
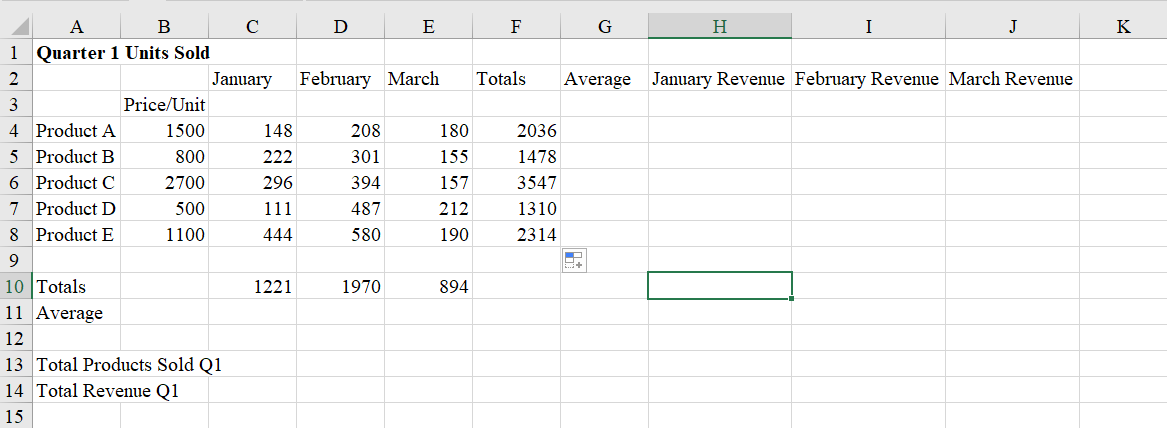
Use the SUM function to calculate totals. To do this:
Navigate to cell C10.
Click on the AutoSum button from the task bar.

C Drag your mouse pointer over the range of values to be summed (in this case, C4 through C8)
D Hit the ENTER key. The result in cell C10 should be 1221, meaning 1,221 units were sold across all product lines in January.
Note: Excel contains the AutoSum key as a shortcut because the SUM function is used so frequently. You can also manually type the sum function as =SUM(C4:C8), yielding the same results. ![]()
E Calculate totals for February and March (cells D10 and E10). If you are successful, your results should be 1970 (for cell D10) and 894 (for cell E10).
F Calculate total units sold of Product A for the quarter (cell F4). If you are successful, your result should be 2036.
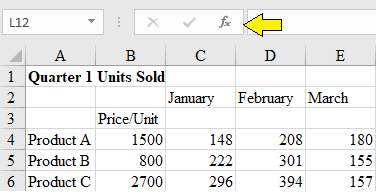
Note: If you click on cell F4 after you have entered your function, you will see the result. If you examine the formula bar near the top of the screen, you will see the actual contents of the cell, which is your function (=SUM(B4:E4) ). ![]()
G .A powerful feature of Excel is the ability to copy formulas and functions. This enables you to create a formula or function once but use it many times without retyping. In this way, you can copy your function from cell F4 and paste it in cells F5 through F8. To do this:
Click on cell F4.
Hover the mouse pointer on F4 until you see a small square in the bottom right corner of the cell. This is referred to as the “fill handle”.
Click and drag the fill handle (your mouse pointer will change to a crosshair “+” symbol) until you have highlighted cells F5 through F8.
Release the mouse button. The function will now be pasted in the highlighted cells.
Note: If you click on any cell in your pasted range, you will see the function displayed in the formula bar near the top of the screen. ![]()
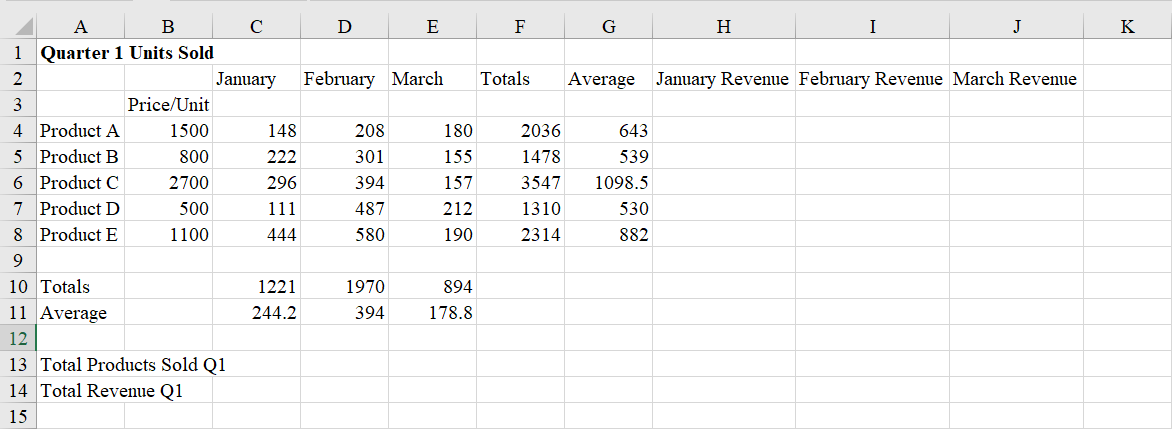
H Your worksheet should now look as follows:
SUM is just one of many Excel functions. Another is the AVERAGE function, which will calculate the average of a range. To calculate the average number of products across all product lines sold in January, do the following:
Navigate to cell C11.
Enter the following text:
=AVERAGE(
Highlight the range C4 through C8 (or type =AVERAGE(C4:C8) )
Hit ENTER
If you are successful, C11 should contain the value 244.2.
Using the AVERAGE function (or copying the function from cell C11), calculate averages for March and April in cells D11 and E11. Similarly, calculate average units sold per product line by using or copying the AVERAGE function in cells G4 through G8. If you are successful, your worksheet should now look as follows:
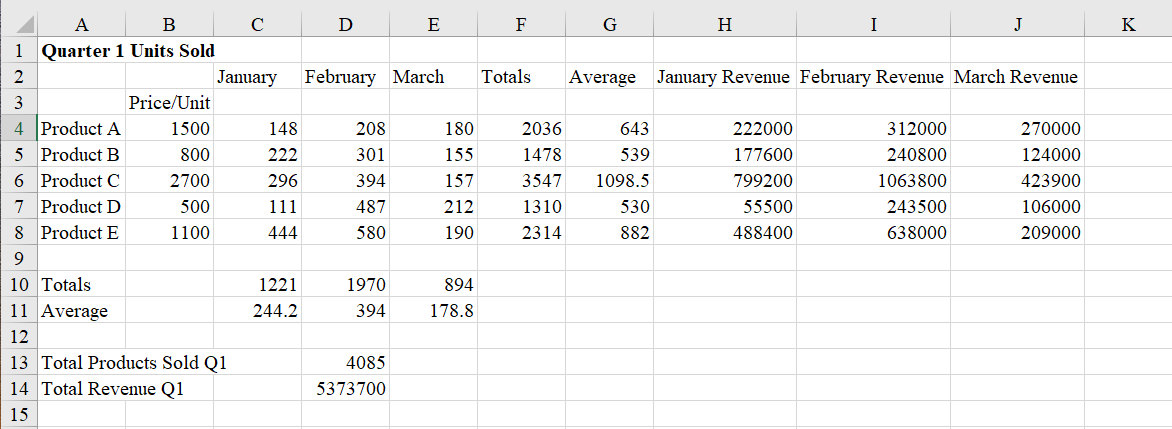
You can also use the SUM function to calculate the total number of products sold in Q1. Use the SUM function in cell D13 to calculate this value by summing the values in C10 through E10. If you are successful, the result will be 4085.
You can write a formula to calculate revenue, which is price/unit times number of units sold, by using the asterisk “ * ” symbol for multiplication. To do this:
Navigate to cell H4.
Enter the formula =B4*C4 and press ENTER.
Copy or retype the formula to calculate appropriate revenue values for all product lines in all months in cells H5 through J8.
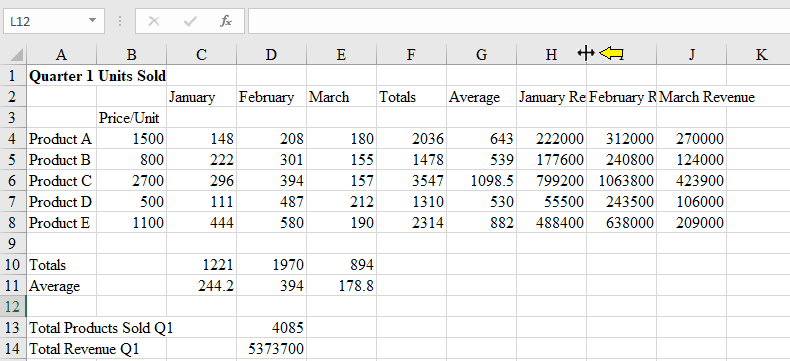
Lastly, navigate to cell D14 and calculate the total revenue in Q1 by using the SUM function to add all values between H4 through J8. If you are successful, your worksheet will look as follows:
Part two of assignment
Part 1: Workbook Template
As you progress through this Competency on the development of your Healthcare Budget Request, you will apply financial ratios and other calculations to make the business case for your idea. In Part 1 of this Assessment, you will develop a workbook that may be used in subsequent Assessments for use in your analysis. To do this:
Open a blank Excel workbook. Name this “FE_workbook_firstinitial_lastname.xlsx”
Create a worksheet for each analysis you will conduct in subsequent parts of your Healthcare Budget Request. Name each worksheet as follows:
A3 Estimated Expenses
A4 Budget Development
A5 Ratio Analysis
A6 Financial Statement Analysis
On each worksheet, include a title/header that reads similar to the following:
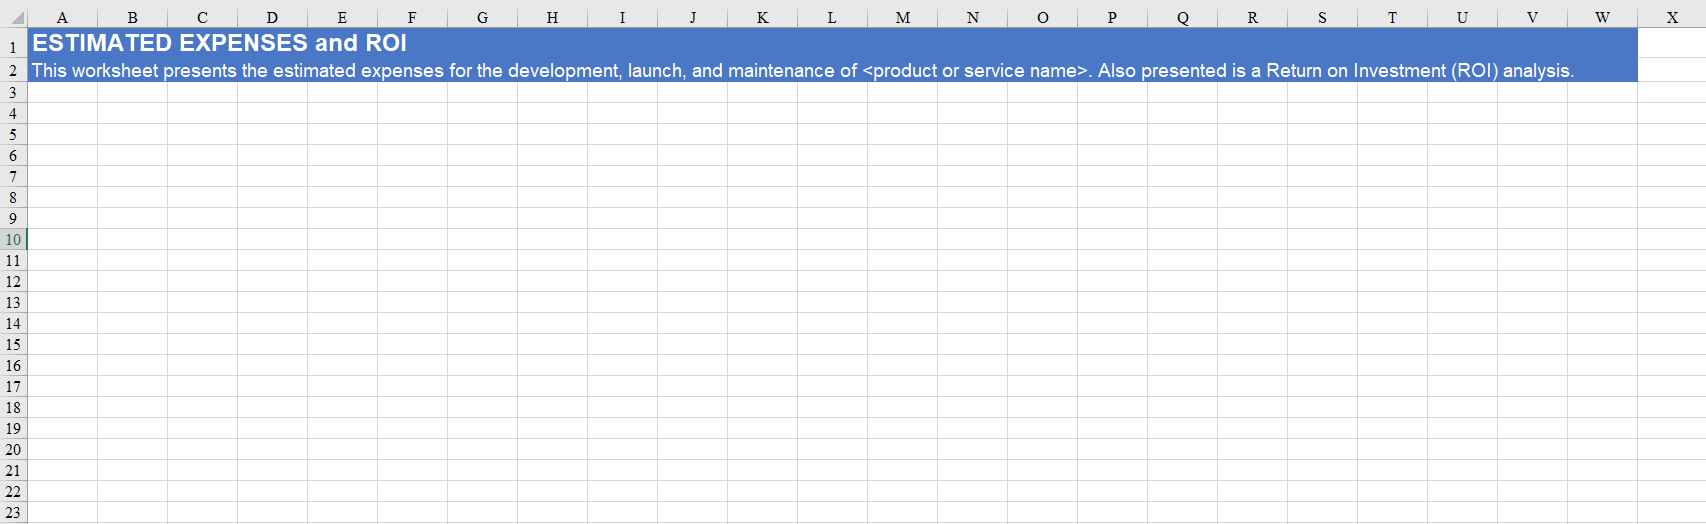
You may format these however you see fit, but you should make each worksheet presentable, as these will be used by stakeholders considering your budget request.
Save and submit your assessment.


