his is our first practical Visual training in Rstudio. After you install R and R studio, please read instruction file attached. Your goal is to create 5 different charts from ggplot2 R library. If you
ITS 530: Quiz 2 sample report
Visualization with ggplot2 library
See below cheat-sheet on this library for quick reference
https://rstudio.com/wp-content/uploads/2015/05/ggplot2-cheatsheet.pdf
First I am reading my csv dataset
Str(data) showed me general information about my dataset
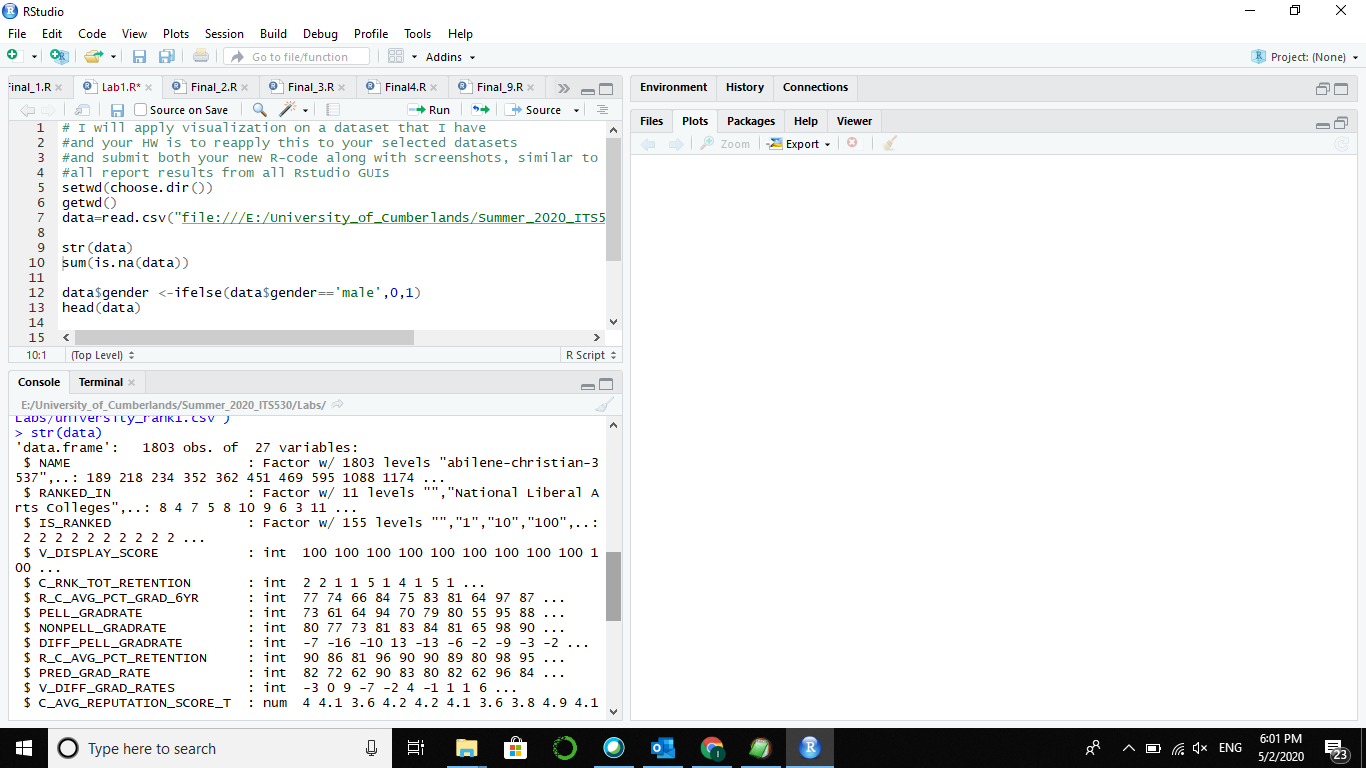
My dataset has 1803 obs. of 27 variables:
The second picture to show how many null values in my dataset
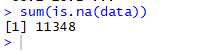
I have many null variables
Next I will start my ggplot2 visualization
# This quiz we will look at ggplo2 library visualizations
# Our examples are from the link http://r-statistics.co/Top50-Ggplot2-Visualizations-MasterList-R-Code.html
Our first plot is called: Scatterplot. Screens below shows results of my code for two variables from my data. x=R_C_PCT_CLASSES_GT_50, y=IS_RANKED
I basically want to study class size with University rank scale
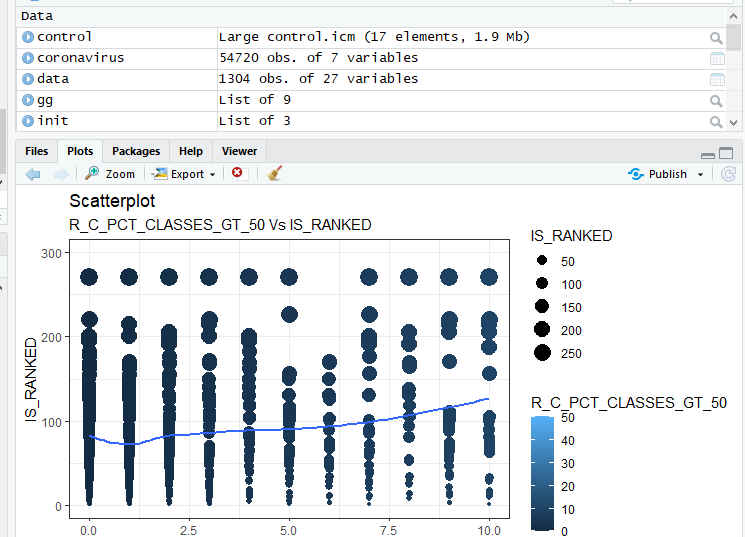
The chart basically is telling me that Universities with lower rank tend to have less of those large classes
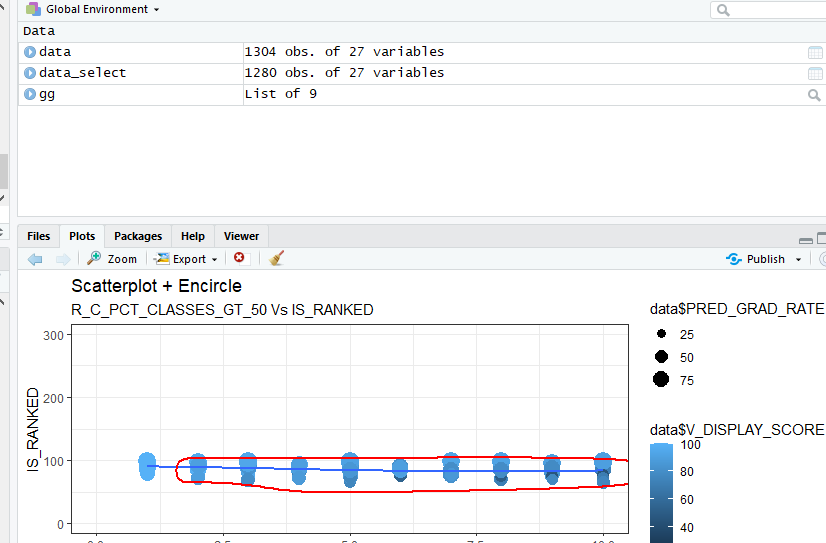
The second chart scatter plot with encoding
Complete the above two charts based on your dataset and any 3 more charts from the http://r-statistics.co/Top50-Ggplot2-Visualizations-MasterList-R-Code.html (Important, the charts and your code should be based on your dataset). Submitting the code and figures from this link as is will not be accepted


