For this assignment you will need to download and open a data file that is posted in the Course Content folder and titled “descriptive dataset.sav”. Perform analyses in SPSS on three (3) variables (on
DESCRIPTIVE ANALYSIS 8
Examining Measurements of Central Tendencies
Examining Measurements of Central Tendencies
This discussion board is based on the measurement of central tendencies whereas the nominal, ordinal, interval and ratio allow researcher to analyze data. Each of these measurements provide researchers with the ability to measure sets of data that do not represent numerical values. Salkind (2017) defined a level measurement with an outcome that fit into one and only class or category as nominal. The level of measurement assigns value to a specific item than assign a value to the item based on the appeal to an individual. The nominal measurement that I chose was labor force status. The descriptive characteristics that were chosen for the completion of the data set were represented some form of employment. Salkind (2017) explained the ordinal measurement as the characteristic of the assigning order or ranking data. The ordinal measurement that I chose was a ranking of how individuals view their political affiliations. The characteristics were assigned a value which for the mean, median and mode to be determined. The sum of a data set divide by the number data points represents the mean (Salkind, 2017). The mean for a data set may be skewed based on extreme number contained in the set of number. By focusing on the median, Salkind (2017) defined as a true midpoint of the data set that does not take in consideration extreme number. The median produces a more conclusive number that is related to the true data without influences. When analyzing data, situations may occur where the data is repetitive. This repetition of the number in a data is known as the mode (Salkind, 2017). A data set may have multiple modes and may have greater determining factor mean and how the data is interpreted.
Nominal Data
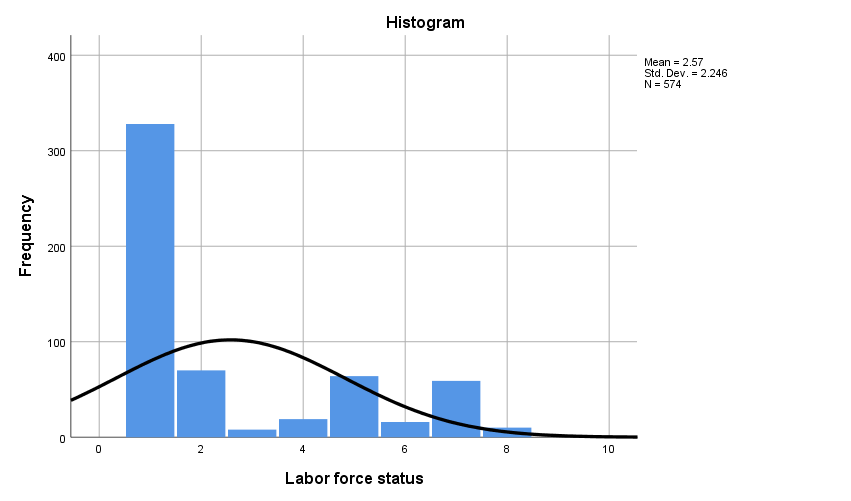
The nominal data set for ‘Labor for status’ comprised of 10 descriptive terms that represents some phase of employment. The data were assigned numbers 0 to 9 based on the stage of employed (e.g. “working fulltime” =1). The data set consisted of 575 respondents of which only one data was missing. The data shows that nearly 60% of respondents reported that were “working fulltime”. The corresponding value associated with “working fulltime” was 1. The data show that most respondents are employed in some fashion calculating a mean of 2.57, median of 1 and a mode of 1. The median of 1 seems to be an anomaly in the data based on the data set range of nine. The standard deviation of 2.246 and variance of 5.044. Based on the information analyzed, 68% of the respondents are represented between .33 and 4.81. The variance shows the consistency of the data based on the distance from .33 to 4.81.
| Statistics | ||
| Labor force status | ||
| N | Valid | 574 |
| Missing | 1 | |
| Mean | 2.57 | |
| Std. Error of Mean | .094 | |
| Median | 1.00 | |
| Mode | 1 | |
| Std. Deviation | 2.246 | |
| Variance | 5.044 | |
| Skewness | 1.088 | |
| Std. Error of Skewness | .102 | |
| Kurtosis | -.392 | |
| Std. Error of Kurtosis | .204 | |
| Range | 7 | |
| Minimum | 1 | |
| Maximum | 8 | |
| Labor force status | |||||
| Frequency | Percent | Valid Percent | Cumulative Percent | ||
| Valid | Working full time | 328 | 57.0 | 57.1 | 57.1 |
| Working part-time | 70 | 12.2 | 12.2 | 69.3 | |
| Temporarily not working | 8 | 1.4 | 1.4 | 70.7 | |
| Unemployed, laid off | 19 | 3.3 | 3.3 | 74.0 | |
| Retired | 64 | 11.1 | 11.1 | 85.2 | |
| School | 16 | 2.8 | 2.8 | 88.0 | |
| Keeping house | 59 | 10.3 | 10.3 | 98.3 | |
| Other | 10 | 1.7 | 1.7 | 100.0 | |
| Total | 574 | 99.8 | 100.0 | ||
| Missing | NA | 1 | .2 | ||
| Total | 575 | 100.0 | |||
Ordinal Data
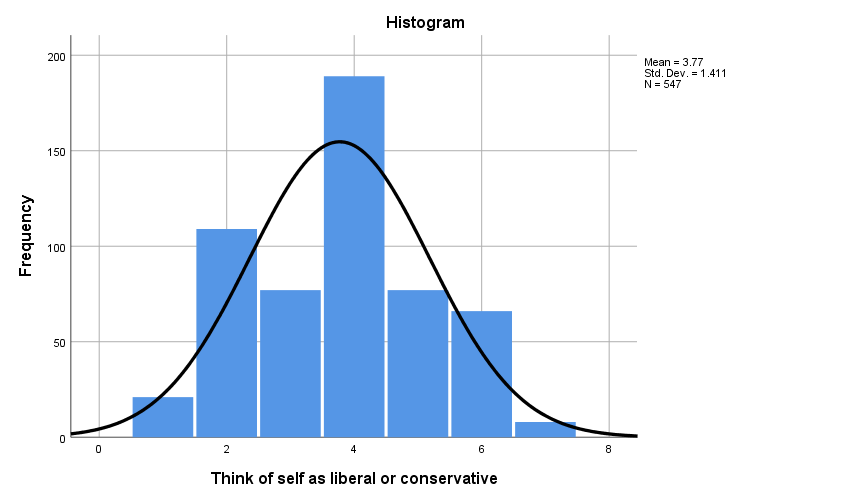
The ordinal data set for ‘Think of self as liberal or conservative’ comprised of 10 descriptive terms that represents some political affiliation. The data were assigned numbers, or range of 0 to 9 based on what extent they represented the political affiliation (e.g. “extremely liberals” =1). The data set consisted of 575 respondents of which 28 data was missing. The data shows that nearly 72% of respondents reported that were “Moderate”. The corresponding value associated with “Moderate” was 4. This data set shows that individuals political affiliation lies down the middle as displayed with a mean of 3.77, median of 4 and a mode of 4. The standard deviation of 1.411 and variance of 1.990. The standard deviation shows that 68% of the individuals are willing to accept other individuals’ point of view by identifying as slightly affiliated with the political mindset.
| Statistics | ||
| Think of self as liberal or conservative | ||
| N | Valid | 547 |
| Missing | 28 | |
| Mean | 3.77 | |
| Std. Error of Mean | .060 | |
| Median | 4.00 | |
| Mode | 4 | |
| Std. Deviation | 1.411 | |
| Variance | 1.990 | |
| Skewness | .037 | |
| Std. Error of Skewness | .104 | |
| Kurtosis | -.672 | |
| Std. Error of Kurtosis | .209 | |
| Range | 6 | |
| Minimum | 1 | |
| Maximum | 7 | |
| Think of self as liberal or conservative | |||||
| Frequency | Percent | Valid Percent | Cumulative Percent | ||
| Valid | Extremely liberal | 21 | 3.7 | 3.8 | 3.8 |
| Liberal | 109 | 19.0 | 19.9 | 23.8 | |
| Slightly liberal | 77 | 13.4 | 14.1 | 37.8 | |
| Moderate | 189 | 32.9 | 34.6 | 72.4 | |
| Slightly conservative | 77 | 13.4 | 14.1 | 86.5 | |
| Conservative | 66 | 11.5 | 12.1 | 98.5 | |
| Extremely conservative | 8 | 1.4 | 1.5 | 100.0 | |
| Total | 547 | 95.1 | 100.0 | ||
| Missing | DK | 28 | 4.9 | ||
| Total | 575 | 100.0 | |||
Interval Data
The scale data set for ‘Respondent ID’ comprised of individual that receive a number as they respondent to the survey. The data were assigned numbers, or range of 1 to 575 based on when they competed and submitted the information. The data set consisted of 575 respondents of which 1 data was missing. The data provide few measurements of central tendencies due the fact that there is no repetition and the data are straightforward.
| Descriptive Statistics | ||||||||||
| N | Range | Minimum | Maximum | Mean | Std. Deviation | Skewness | Kurtosis | |||
| Statistic | Statistic | Statistic | Statistic | Statistic | Statistic | Statistic | Std. Error | Statistic | Std. Error | |
| Respondent id number | 575 | 574 | 1 | 575 | 288.00 | 166.132 | .000 | .102 | -1.200 | .203 |
| Valid N (listwise) | 575 | |||||||||
References
Salkind, N. J. (2017). Statistics for people who (think they) hate statistics (Sixth edition.).
Thousand Oaks, CA: SAGE Publications, Inc.


