Create a PowerPoint presentation for the Sun Coast Remediation research project to communicate the findings and suggest recommendations. Please use the following format: Slide 1: Include a title slide
Running head: INSERT TITLE HERE 0
Insert Title Here
Insert Your Name Here
Insert University Here
Table of Contents
ContentsExecutive Summary 4
Introduction 6
Statement of the Problems 6
Literature Review 9
Research Objectives 12
Research Questions and Hypotheses 13
Research Methodology, Design, and Methods 15
Research Methodology 15
Research Design 16
Research Methods 16
Data Collection Methods 17
Sampling Design 18
Data Analysis procedures 18
Data Analysis: Descriptive Statistics and Assumption Testing 19
Measure of central tendency. 21
Simple Regression: Descriptive Statistics and Assumption Testing 22
Measure of central tendency. 24
ANOVA: Descriptive Statistics and Assumption Testing 35
Data Analysis: Hypothesis Testing 38
Dependent Samples (Paired Samples) t Test: Hypothesis Testing 40
ANOVA: Hypothesis Testing 41
Findings 42
Recommendations 43
References 44
Executive SummarySenior leadership at Sun Coast has identified several areas for concern that they believe could be solved using business research methods. The previous director was tasked with researching to help provide information to make decisions about these issues. Although data were collected, the project was never completed. Senior leadership is interested in seeing the project through to fruition. The six business problems identified include particulate matter, safety training effectiveness, sound level exposure, lead exposure, new employee training, and return on investment. The literature review was based on these six problems. The research methodology used is quantitative since it allows for computation and experimentation. Besides, it is good for quantitative behavior. The main null hypothesis (Ho) being analyzed is that there is no statistical difference between individual groups that have undergone training, and those that have not undergone training. The independent t-test indicates statistically significant performance results between group A and group B. This test results in a p-value of less than 0.05, which is 1.94E-15. The study results showed that new employees who received training on safety could apply these measures throughout. Besides, exposure to particulate matter leads to ill health. The toxicity differs in different types of particulate matter. Lead poisoning was detected in some of the employees working in some sites. The company should increase its level of monitoring employees working in various sites for lead exposure. That will make it possible for such employees to be detected early enough so that interventions can be taken. Besides, employees should be given personal protective equipment to protect them from exposure to toxic particulate matter. Such equipment includes face masks.
IntroductionSenior leadership at Sun Coast has identified several areas for concern that they believe could be solved using business research methods. The previous director was tasked with conducting research to help provide information to make decisions about these issues. Although data were collected, the project was never completed. Senior leadership is interested in seeing the project through to fruition. The following is the completion of that project and includes the statement of the problems, literature review, research objectives, research questions and hypotheses, research methodology, design, and methods, data analysis, findings, and recommendations.
Statement of the ProblemsSix business problems were identified:
Particulate Matter (PM)
There is a concern that job-site particle pollution is adversely impacting employee health. Although respirators are required in certain environments, PM varies in size depending on the project and job site. PM that is between 10 and 2.5 microns can float in the air for minutes to hours (e.g., asbestos, mold spores, pollen, cement dust, fly ash), while PM that is less than 2.5 microns can float in the air for hours to weeks (e.g. bacteria, viruses, oil smoke, smog, soot). Due to the smaller size of PM that is less than 2.5 microns, it is potentially more harmful than PM that is between 10 and 2.5 since the conditions are more suitable for inhalation. PM that is less than 2.5 is also able to be inhaled into the deeper regions of the lungs, potentially causing more deleterious health effects. It would be helpful to understand if there is a relationship between PM size and employee health. PM air quality data have been collected from 103 job sites, which is recorded in microns. Data are also available for average annual sick days per employee per job-site.
Safety Training Effectiveness
Health and safety training is conducted for each new contract that is awarded to Sun Coast. Data for training expenditures and lost-time hours were collected from 223 contracts. It would be valuable to know if training has been successful in reducing lost-time hours and, if so, how to predict lost-time hours from training expenditures.
Sound-Level Exposure
Sun Coast’s contracts generally involve work in noisy environments due to a variety of heavy equipment being used for both remediation and the clients’ ongoing operations on the job sites. Standard ear-plugs are adequate to protect employee hearing if the decibel levels are less than 120 decibels (dB). For environments with noise levels exceeding 120 dB, more advanced and expensive hearing protection is required, such as earmuffs. Historical data have been collected from 1,503 contracts for several variables that are believed to contribute to excessive dB levels. It would be important if these data could be used to predict the dB levels of work environments before placing employees on-site for future contracts. This would help the safety department plan for procurement of appropriate ear protection for employees.
New Employee Training
All new Sun Coast employees participate in general health and safety training. The training program was revamped and implemented six months ago. Upon completion of the training programs, the employees are tested on their knowledge. Test data are available for two groups: Group A employees who participated in the prior training program and Group B employees who participated in the revised training program. It is necessary to know if the revised training program is more effective than the prior training program.
Lead Exposure
Employees working on job sites to remediate lead must be monitored. Lead levels in blood are measured as micrograms of lead per deciliter of blood (μg/dL). A baseline blood test is taken pre-exposure and post exposure at the conclusion of the remediation. Data are available for 49 employees who recently concluded a 2-year lead remediation project. It is necessary to determine if blood lead levels have increased.
Return on Investment
Sun Coast offers four lines of service to their customers, including air monitoring, soil remediation, water reclamation, and health and safety training. Sun Coast would like to know if each line of service offers the same return on investment. Return on investment data are available for air monitoring, soil remediation, water reclamation, and health and safety training projects. If return on investment is not the same for all lines of service, it would be helpful to know where differences exist.
Literature ReviewThe literature review for the topic is organized as follows:
Particulate Matter (PM)
The author of the article “Particulate matter components, sources, and health: Systematic approaches to testing effects.” is known as Kate, who is a scientist, Daniel, who is President and Annemoon, who is a scientist at HEI. The purpose of the study of the article is to know if some items and sources of particulate matter are more toxic than others ("Tandfonline.com", 2020). The article relates to the Sun Coast problem because it researches on the health impacts due to exposure to particulate matter in order to protect the public health.
Safety Training Effectiveness
The author of the article is Mat Naim Abdullah Mohd Asmoni, is a senior writer serving in the Department of Property Management. He has a BSc. Quantity Surveying as well. The purpose of the study is to provide information on methods of effective training that should be applied in industries to ensure employees understand their part effectively (Asmoni, 2020). The article relates to the Sun Coast problem because it can provide ways of according effective safety training for newly employed workers. The article reviews the best methods that can be applied by organizations to ensure trainings meet the objectives and goals.
Sound Level Exposure
The author of the article “Assessment of Occupational Noise Exposure among Groundskeepers in North Carolina Public Universities” is Jo Anne G. Balanay. She works in Environmental Health Sciences Program and heads the DHE in The University of East Carolina. The purpose of the study is to assess the exposure of people to various forms of noise in various institutions and determine the relationship between the noise exposure and the variables (Balanay, 2020).
This article relates to the Sun Coast problem of Sound-level Exposure because it can provide means of assessing how the noise is affecting the employees with regards to the presented variables of the research.
New Employee Training
The author of the article “The Effect of Training and Development on Employee Attitude as it relates to Training and Work Efficiency” is Debra L. Truitt, who is MD in the Salisbury University and has education qualifications on management. The purpose of the study is to explore the connection between the experiences and attitudes of training about perceived job proficiency. According to the article, new training and development on workers ensures work efficiency (Truitt, 2020). It applies to the Sun Coast problem of new employee training since by training the incoming employees, their efficiency in their activities is likely to increase. It also provides ways for assessing the effect of employee training on their job outcomes.
Lead Exposure
The author of the article “Lead toxicity with a new focus” is Ireka Buka, who works in the section Of Pediatric Environmental Health Section. The purpose of the research is to detect the impact of lead exposure and lead toxicity in the society (Society, 2020). This article applies to the problem of Lead Exposure by providing ways of testing the presence of lead in the blood and outlining its effects on the Sun Coast project especially to the workers that are present in the work sites.
Return on Investment
The author of the article “A Study on Return on Investment of Training Programme in a Government Enterprise” is Priya Dhamija Gupta and has an MBA and PhD in Human resource. The article provides ways of calculating return on investment on training programs using various evaluation models (Gupta, 2020). Therefore, Sun Coast project can estimate the return on investment using the different ways provided in this article to know how much they will get on investing in various things.
Research ObjectivesThe following were the objectives of the research:
RO1: To determine if there is a relationship between the size of PM and the health of employees.
RO2: To identify whether safety training has been effective in reducing the time lost in hours.
RO3: To determine the dB levels in job sites before sending employees to work there.
RO4: To determine if the new employee training program is more effective than the previous one.
RO5: To determine whether the blood lead levels in employees have increased in order to determine the level of exposure to lead.
RO6: To identify if there is a difference in the return on investment on the company’s lines of service.
Research Questions and HypothesesThis research aimed at measuring the following hypotheses and answering the following research question:
RQ1: Is there a relationship between the size of PM and the health of employees?
H01: There is no relationship between the size of PM and the health of employees.
HA1: There is a significant relationship between the size of PM and the health of employees.
RQ2: Has the safety training been effective in reducing the time lost in hours?
H02: The safety training has not been effective in reducing the time lost in hours.
HA2: The safety training has caused a significant reduction in the time lost in hours.
RQ3: Does the dB level in the job site exceed the standard 12decibels?
H03: The dB level does not exceed 120 decibels in the job site.
HA3: There is evidence that the dB level exceeds 12o decibels in the job site.
RQ4: Is the new employee training program more effective than the previous one?
H04: The new employee training program is not as effective as the previous one.
HA4: There is significant evidence that the new employee training program is more effective than the previous one.
RQ5: Have the blood lead levels in employees increased?
H05: There is no evidence of increase in blood lead levels in employees.
HA5: There is evidence of increase in blood lead levels in employees.
RQ6: Is there a difference in the return on investment among the company’s lines of service?
H06: There is no notable difference in the return on investment among the company’s lines of service.
HA6: There is a significant difference in the return on investment among the company’s lines of service.
Research Methodology, Design, and Methods Research Methodology
The research methodology is quantitative. Two reasons support the use of the methodology over the qualitative approach. First, the method is best for quantifying behavior, attitudes, opinions, and other variables and generalize a large study population. The method is ideal for computation and experimentation and since all of the research questions can be answered by experimentation, the quantitative approach is the most ideal. Secondly, the primary goal of the quantitative methodology is to understand the relationship between the dependent and independent variables (Bryman, 2017). The research objectives are tied to how independent and dependent variables relate thus the methodology will off the best explanation of the relationships.
Research DesignThe research design will be the causal research which is also known as the explanatory research design. The design focuses on the investigation of cause and effect relationships. Based on the research objectives, it will be necessary that variables that are assumed to cause change will be observed (Kemp et al., 2018). The causal research design will help explain if the change in the variables is related to variations in the variables under study. The causal research design will help explain the relationship between the independent and dependent variables.
Research MethodsDifferent research methods will be used to test the seven hypotheses. For hypothesis 1, the experimentation method will be the most ideal as it will make it possible to test if an increase in PM size influences the health of an employee. For hypothesis 2, the correlation method will be the best. The method will allow the researcher to see if there is a relation between safety training and lost hours. For hypothesis 3, the descriptive method will be the best. The method will make it possible to assess whether the dB level in a job site exceeds the standard 12decibels. For hypothesis 4, the casual comparative method will be the best as it will make it easy to confirm if the training program causes an improvement or not. It will also make it possible to compare the previous training program and the new program. For hypothesis 5, the descriptive method will be the best. The method will make it possible to assess whether the blood lead levels in employees have increased by simply looking at the available data. For the last hypothesis, the descriptive method will be the best. The method will make it possible to assess if there a difference in the return on investment among the company’s lines of service by looking at the available statistics on the lines of services.
Data Collection MethodsFor hypothesis 1, the best data collection method will be record analysis as records on the size of PM and the health of employees already exists. The best data collection method for hypothesis 2 records analysis as records on safety training and records on the time lost in hours exists. The best data collection method for hypothesis 3 is observation as it will be easy to observe whether the dB level in the job site exceeds the standard 12decibels. The best data collection method for hypothesis 4 is the survey method as it will require the employees to share whether they believe the training was effective or not. The best data collection method for hypothesis 5 is records analysis. Confirming or dispelling the hypothesis only needs analysis of the existing data. The best data collection method for the last hypothesis is records analysis as only the existing data on the lines of services is analyzed.
Sampling DesignThe best sampling method for the research is random sampling. Random sampling has two main advantages that make it ideal. First, it eliminates bias, the method will reduce the chance of influencing the study. Secondly, the random sampling method is ideal for a large population (Sharma, 2017). The chosen samples represent the whole population. The method will be ideal for the study considering the study population is huge. The company has many employees.
Data Analysis proceduresFor hypothesis 1, the regression analysis will be the most ideal as it allows the analysis of relationships between two or more variables (Ahlgren & Walberg, 2017). It will allow the analysis of PM size and the health of patients. For hypothesis 2, the t-test will be used as it makes it possible to analyze the significant difference between the two groups. For hypothesis 3, the regression analysis will be used as it will allow the analysis of the DB level and noise. For hypothesis 4, the ANOVA analysis will be used. The ANOVA analysis method is ideal for identifying differences between three independent groups (Boisgontier & Cheval, 2016). In testing hypothesis 4, one has several groups; the trained groups, the training, and levels of understanding. For hypothesis 5, the regression test will be used as it allows the analysis of relationships between two or more variables. For the last hypothesis, the ANOVA analysis will be used as the difference between three or more groups is being checked.
Data Analysis: Descriptive Statistics and Assumption Testing
Data Analysis: Descriptive Statistics and Assumption Testing
Correlation: Descriptive Statistics and Assumption Testing
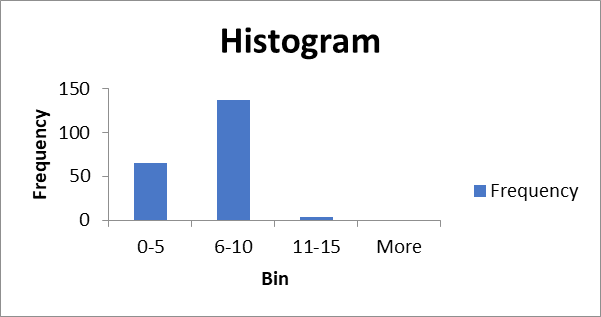
Frequency distribution table.
| Bin | Frequency |
| 0-5 | 65 |
| 6-10 | 137 |
| 11-15 | |
| More |
Histogram.
Descriptive statistics table.
| Microns |
| mean annual sick days per employee |
|
| Mean | 5.657281553 | Mean | 7.126213592 |
| Standard Error | 0.255600143 | Standard Error | 0.186483898 |
| Median | Median | ||
| Mode | Mode | ||
| Standard Deviation | 2.59405814 | Standard Deviation | 1.892604864 |
| Sample Variance | 6.729137636 | Sample Variance | 3.58195317 |
| Kurtosis | -0.852161902 | Kurtosis | 0.124922603 |
| Skewness | -0.373257127 | Skewness | 0.142249784 |
| Range | 9.8 | Range | 10 |
| Minimum | 0.2 | Minimum | |
| Maximum | 10 | Maximum | 12 |
| Sum | 582.7 | Sum | 734 |
| Count | 103 | Count | 103 |
| Largest(1) | 10 | Largest(1) | 12 |
| Smallest(1) | 0.2 | Smallest(1) |
Measurement scale.
Ratio scale was used since it has all of the features of interval scale and a true zero, which refers to complete absence of the characteristic being measured. This scale was used because microns refers to length which can be effectively described using ratio scale. Also, the mean annual sick days per employee is a number that is well described using the ratio scale (Peacock, 2019).
Measure of central tendency.From the above descriptive statistics table, the mean, mode, and median for mean annual sick days per employee are;
Mean: 7.126213592
Medium: 7
Mode: 7
Also for the Microns, the mean, mode, and medium are;
Mean: 5.657281553
Medium: 6
Mode: 8
Evaluation.
From the descriptive statistics, for microns, the skewness was -0.373257127 while the kurtosis was -0.852161902, on the other hand, for mean annual sick days per employee, skewness was 0.142249784 and kurtosis was 0.124922603, it must be noted that for normality test assumption, the skewness must be within a +-2 range while kurtosis between +-7 range. However according to the descriptive statistical values above, the skewness and kurtosis ranges aren’t within the intended range for normality assumption qualification. Therefore the parametric statistical testing were not met.
Simple Regression: Descriptive Statistics and Assumption TestingFrequency distribution table.
| Bin | Frequency |
| 0-500 | 331 |
| 501-1000 | 76 |
| 1001-1500 | 27 |
| 1501-2000 | 11 |
| 2001-2500 | |
| More |
Histogram.

Descriptive statistics table.
| safety training expenditure |
| lost time hours |
|
| Mean | 595.9843812 | Mean | 188.0044843 |
| Standard Error | 31.4770075 | Standard Error | 4.803089447 |
| Median | 507.772 | Median | 190 |
| Mode | 234 | Mode | 190 |
| Standard Deviation | 470.0519613 | Standard Deviation | 71.72542099 |
| Sample Variance | 220948.8463 | Sample Variance | 5144.536016 |
| Kurtosis | 0.444080195 | Kurtosis | -0.501223533 |
| Skewness | 0.951331922 | Skewness | -0.081984874 |
| Range | 2251.404 | Range | 350 |
| Minimum | 20.456 | Minimum | 10 |
| Maximum | 2271.86 | Maximum | 360 |
| Sum | 132904.517 | Sum | 41925 |
| Count | 223 | Count | 223 |
| Largest(1) | 2271.86 | Largest(1) | 360 |
| Smallest(1) | 20.456 | Smallest(1) | 10 |
Measurement scale.
Ratio scale was used since it has all of the features of interval scale and a true zero, which refers to complete absence of the characteristic being measured. This scale was used because safety training expenditure refers to length which can be effectively described using ratio scale. Also, the lost time hours are numbers that are well described using the ratio scale (McCarthy, R. McCarthy, M, Ceccucci, & Halawi, 2019).
Measure of central tendency.From the above descriptive statistics table, the mean, mode, and median for safety training expenditure are;
Mean: 595.9843812
Medium: 507.772
Mode: 234
For the lost time hours, the mean, mode, and medium are;
Mean: 188.0044843
Medium: 190
Mode: 190
Evaluation.
From the descriptive statistics, for safety training expenditure, the skewness was -0.951331922 while the kurtosis was 0.444080195, on the other hand, for lost time hours, skewness was -0.081984874 and kurtosis was -0.501223533, it must be noted that for normality test assumption, the skewness must be within a +-2 range while kurtosis between +-7 range. However according to the descriptive statistical values above, the skewness and kurtosis ranges aren’t within the intended range for normality assumption qualification. Therefore the parametric statistical testing were not met (Ma’arif, Motahar, & Mohd Satar, 2018).
Multiple Regression: Descriptive Statistics and Assumption Testing
Frequency distribution table.
| Bin | Frequency |
| 0-20 | 1503 |
| 21-40 | 761 |
| 41-60 | 277 |
| 61-80 | 465 |
| More |
Histogram.

Descriptive statistics table.
| Chord Length |
| Velocity |
|
| Mean | 0.116140053 | Mean | 50.86074518 |
| Standard Error | 0.001256368 | Standard Error | 0.401686079 |
| Median | 0.1176 | Median | 39.6 |
| Mode | 0.0917 | Mode | 39.6 |
| Standard Deviation | 0.048707555 | Standard Deviation | 15.5727844 |
| Sample Variance | 0.002372426 | Sample Variance | 242.5116138 |
| Kurtosis | -1.178196484 | Kurtosis | -1.563951274 |
| Skewness | -0.027537436 | Skewness | 0.235852414 |
| Range | 0.1697 | Range | 39.6 |
| Minimum | 0.03 | Minimum | 31.7 |
| Maximum | 0.1997 | Maximum | 71.3 |
| Sum | 174.5585 | Sum | 76443.7 |
| Count | 1503 | Count | 1503 |
| Largest(1) | 0.1997 | Largest(1) | 71.3 |
| Smallest(1) | 0.03 | Smallest(1) | 31.7 |
Measure of central tendency.
From the above descriptive statistics table, the mean, mode, and median for Chord Length are;
Mean: 0.116140053
Medium: 0.1176
Mode: 0.0917
For the Velocity, the mean, mode, and medium are;
Mean: 50.86074518
Medium: 39.6
Mode: 39.6
Evaluation.
From the descriptive statistics, for Chord Length, the skewness was -0.027537436 while the kurtosis was -1.178196484, on the other hand, for Velocity, skewness was 0.235852414 and kurtosis was -1.563951274, it must be noted that for normality test assumption, the skewness must be within a +-2 range while kurtosis between +-7 range (Qiu, Wei, & Bai, 2017). However according to the descriptive statistical values above, the skewness and kurtosis ranges aren’t within the intended range for normality assumption qualification. Therefore the parametric statistical testing were not met.
Independent Samples t Test: Descriptive Statistics and Assumption Testing
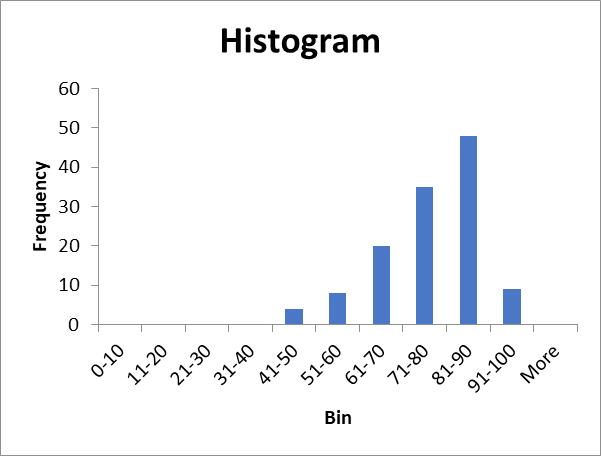
Frequency distribution table.
| Bin | Frequency |
| 0-10 | |
| 11-20 | |
| 21-30 | |
| 31-40 | |
| 41-50 | |
| 51-60 | |
| 61-70 | 20 |
| 71-80 | 35 |
| 81-90 | 48 |
| 91-100 | |
| More |
Histogram.
Descriptive statistics table.
| Group A Prior Training Scores |
| Group B Revised Training Scores |
|
| Mean | 69.79032258 | Mean | 84.77419355 |
| Standard Error | 1.402788093 | Standard Error | 0.659478888 |
| Median | 70 | Median | 85 |
| Mode | 80 | Mode | 85 |
| Standard Deviation | 11.04556449 | Standard Deviation | 5.192741955 |
| Sample Variance | 122.004495 | Sample Variance | 26.96456901 |
| Kurtosis | -0.77667598 | Kurtosis | -0.352537913 |
| Skewness | -0.086798138 | Skewness | 0.144084526 |
| Range | 41 | Range | 22 |
| Minimum | 50 | Minimum | 75 |
| Maximum | 91 | Maximum | 97 |
| Sum | 4327 | Sum | 5256 |
| Count | 62 | Count | 62 |
| Largest(1) | 91 | Largest(1) | 97 |
| Smallest(1) | 50 | Smallest(1) | 75 |
Measurement scale.
Ratio scale was used since it has all of the features of interval scale and a true zero, which refers to complete absence of the characteristic being measured. This scale was used because Group A Prior Training Scores can be treated as student marks which can be treated as measurement values which can be effectively described using ratio scale. Also, the Group B Revised Training Scores can as well as classified as values that are well described using the ratio scale (Stypulkowski, Bernardeau, & Jakubowski, 2018).
Measure of central tendency.
From the above descriptive statistics table, the mean, mode, and median for Group A Prior Training Scores are;
Mean: 69.79032258
Medium: 70
Mode: 80
For the Group B Revised Training Scores, the mean, mode, and medium are;
Mean: 84.77419355
Medium: 85
Mode: 85
Evaluation.
From the descriptive statistics, for Group A Prior Training Scores, the skewness was --0.086798138 while the kurtosis was -0.77667598, on the other hand, for Group B Revised Training Scores, skewness was 0.144084526 and kurtosis was -0.352537913, it must be noted that for normality test assumption, the skewness must be within a +-2 range while kurtosis between +-7 range. However according to the descriptive statistical values above, the skewness and kurtosis ranges aren’t within the intended range for normality assumption qualification. Therefore the parametric statistical testing were not met (Wang, et al. 2019).
Dependent Samples (Paired-Samples) t Test: Descriptive Statistics and Assumption Testing
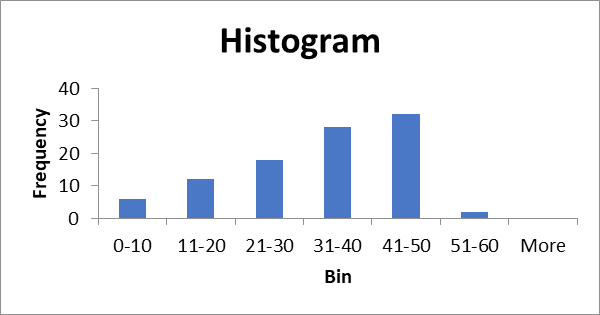
Frequency distribution table.
| Bin | Frequency |
| 0-10 | |
| 11-20 | 12 |
| 21-30 | 18 |
| 31-40 | 28 |
| 41-50 | 32 |
| 51-60 | |
| More |
Histogram.
Descriptive statistics table.
| Pre-Exposure μg/dL |
| Post-Exposure μg/dL |
|
| Mean | 32.85714286 | Mean | 33.28571429 |
| Standard Error | 1.752306546 | Standard Error | 1.781423416 |
| Median | 35 | Median | 36 |
| Mode | 36 | Mode | 38 |
| Standard Deviation | 12.26614582 | Standard Deviation | 12.46996391 |
| Sample Variance | 150.4583333 | Sample Variance | 155.5 |
| Kurtosis | -0.576037127 | Kurtosis | -0.654212507 |
| Skewness | -0.425109654 | Skewness | -0.483629097 |
| Range | 50 | Range | 50 |
| Minimum | Minimum | ||
| Maximum | 56 | Maximum | 56 |
| Sum | 1610 | Sum | 1631 |
| Count | 49 | Count | 49 |
| Largest(1) | 56 | Largest(1) | 56 |
| Smallest(1) | Smallest(1) |
Measurement scale.
Ratio scale was used since it has all of the features of interval scale and a true zero, which refers to complete absence of the characteristic being measured. This scale was used because Pre-Exposure μg/dL parameters can be treated as measurement values which can be effectively described using ratio scale. Also, the Pre-Exposure μg/dL refers to measurement values that are well described using the ratio scale (Berghoff, et al. 2016).
Measure of central tendency.
From the above descriptive statistics table, the mean, mode, and median for Pre-Exposure μg/dL are;
Mean: 32.85714286
Medium: 35
Mode: 36
For the Post-Exposure μg/dL, the mean, mode, and medium are;
Mean: 33.28571429
Medium: 36
Mode: 38
Evaluation.
From the descriptive statistics, for Pre-Exposure μg/dL, the skewness was -0.425109654 while the kurtosis was -0.576037127, on the other hand, for Post-Exposure μg/dL, skewness was -0.483629097 and kurtosis was -0.654212507, it must be noted that for normality test assumption, the skewness must be within a +-2 range while kurtosis between +-7 range. However according to the descriptive statistical values above, the skewness and kurtosis ranges aren’t within the intended range for normality assumption qualification. Therefore the parametric statistical testing were not met (Barkana, Saricicek, & Yildirim, 2017).
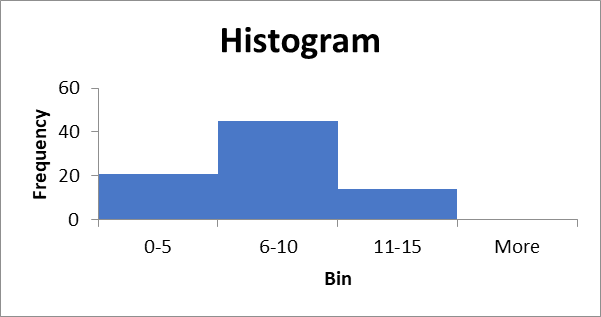
ANOVA: Descriptive Statistics and Assumption TestingFrequency distribution table.
| Bin | Frequency |
| 0-5 | 21 |
| 6-10 | 45 |
| 11-15 | 14 |
| More |
Histogram.
Descriptive statistics table.
| A = Air |
| B = Soil |
| C = Water |
| D = Training |
|
| Mean | 8.9 | Mean | 9.1 | Mean | Mean | 5.4 | |
| Standard Error | 0.68 | Standard Error | 0.39 | Standard Error | 0.58 | Standard Error | 0.3 |
| Median | Median | Median | Median | ||||
| Mode | 11 | Mode | Mode | Mode | |||
| Standard Deviation | 3.06 | Standard Deviation | 1.74 | Standard Deviation | 2.58 | Standard Deviation | 1.2 |
| Sample Variance | 9.36 | Sample Variance | 3.04 | Sample Variance | 6.63 | Sample Variance | 1.4 |
| Kurtosis | -0.6 | Kurtosis | 0.12 | Kurtosis | -0.2 | Kurtosis | 0.3 |
| Skewness | -0.4 | Skewness | 0.49 | Skewness | 0.76 | Skewness | 0.2 |
| Range | 11 | Range | Range | Range | |||
| Minimum | Minimum | Minimum | Minimum | ||||
| Maximum | 14 | Maximum | 13 | Maximum | 12 | Maximum | |
| Sum | 178 | Sum | 182 | Sum | 140 | Sum | 108 |
| Count | 20 | Count | 20 | Count | 20 | Count | 20 |
| Largest(1) | 14 | Largest(1) | 13 | Largest(1) | 12 | Largest(1) | |
| Smallest(1) | Smallest(1) | Smallest(1) | Smallest(1) |
Measurement scale.
In this statistical descriptive analysis, the nominal scale have been used. In this case, the letters that is A, B, C and D have been used to identify or denote items. For instance, A has been used to denote Air, B has been used to denote Soil, and C have been used to denote Water and finally, D have been used to denote Training. However, it should be noted that the letters aren’t used to denote the specialty of an item in relation to another, they are just applied for identity (Innocenti, et al. 2017).
Measure of central tendency.
From the above descriptive statistics table, the mean, mode, and median for air are;
Mean: 8.9
Medium: 9
Mode: 11
Also for the soil, the mean, mode, and medium are;
Mean: 9.1
Medium: 9
Mode: 8
For water, the mean, mode, and medium are;
Mean: 7
Medium: 6
Mode: 6
For the training, the mean, mode, and medium are;
Mean: 5.4
Medium: 5
Mode: 5
Evaluation.
From the descriptive statistics, for Air, the skewness was -0.4 while the kurtosis was -0.6, on the other hand, for Soil, skewness was 0.49 and kurtosis was 0.12, also for Water, the skewness was 0.76 while the kurtosis was -0.2, on the other hand, for Training, skewness was 0.2 and kurtosis was 0.3 it must be noted that for normality test assumption, the skewness must be within a +-2 range while kurtosis between +-7 range. However according to the descriptive statistical values above, the skewness and kurtosis ranges aren’t within the intended range for normality assumption qualification. Therefore the parametric statistical testing were not met (Peacock, 2019).
Data Analysis: Hypothesis TestingIndependent Samples t Test: Hypothesis Testing
The main null hypothesis (Ho) being analyzed is that there is no statistical difference between individual groups that have undergone training and those that have not undergone training. The independent t-test indicates a statistically significant performance results between group A and group B. This test results a p value of less than 0.05 which is 1.94E-15. It is worth noting that the p value is usually used to the measure the level of statistical significance between various variables (Nahm, 2017 p.241). This provision can be attributed to the fact that the performance of the groups is impacted by the level of training thus opposing the H0 hypothesis which states that there is no statistical difference between the two groups despite the training.
Ha: There is a statistically significant difference in the scores between Group A training scores and Group B testing scores.
| t-Test: Two-Sample Assuming Unequal Variances | |||
|
| Group A Prior Training Scores | Group B Revised Training Scores | |
| Mean | 69.79032258 | 84.77419355 | |
| Variance | 122.004495 | 26.96456901 | |
| Observations | 62 | 62 | |
| Hypothesized Mean Difference | |||
| Df | 87 | ||
| t Stat | -9.666557191 | ||
| P(T<=t) one-tail | 9.69914E-16 | ||
| t Critical one-tail | 1.662557349 | ||
| P(T<=t) two-tail | 1.93983E-15 | ||
| t Critical two-tail | 1.987608282 |
| |
Ho: There is no statistically significant difference between the impact on employee before and after the exposure.
| t-Test: Paired Two Sample for Means | |||
|
| Pre-Exposure μg/dL | Post-Exposure μg/dL | |
| Mean | 32.85714286 | 33.28571429 | |
| Variance | 150.4583333 | 155.5 | |
| Observations | 49 | 49 | |
| Pearson Correlation | 0.992236043 | ||
| Hypothesized Mean Difference | |||
| Df | 48 | ||
| t Stat | -1.929802563 | ||
| P(T<=t) one-tail | 0.029776357 | ||
| t Critical one-tail | 1.677224196 | ||
| P(T<=t) two-tail | 0.059552714 | ||
| t Critical two-tail | 2.010634758 |
| |
According to the paired t-test, there seems to be significant effect before and after exposure. This provision is supported by statistical findings p (T<=t) = 0.0297764 which indicates a very significant difference between the two test results.
Ho: There is no statistically significant difference between the impact on employee before and after the exposure. This hypothesis is rejected according the statistical analysis.
Ha: There is no statistically significant difference between the impact on employee before and after the exposure which is indicated by the low p value.
ANOVA: Hypothesis TestingHo: There is no statistically significant difference between the impact on employee before and after the exposure.
| Anova: Single Factor | ||||||
| SUMMARY | ||||||
| Groups | Count | Sum | Average | Variance | ||
| A = Air | 20 | 178 | 8.9 | 9.357895 | ||
| B = Soil | 20 | 182 | 9.1 | 3.042105 | ||
| C = Water | 20 | 140 | 6.631579 | |||
| D = Training | 20 | 108 | 5.4 | 1.410526 | ||
| ANOVA | ||||||
| Source of Variation | SS | Df | MS | F | P-value | F crit |
| Between Groups | 182.8 | 60.93333 | 11.9231 | 1.76E-06 | 2.724944 | |
| Within Groups | 388.4 | 76 | 5.110526 | |||
| Total | 571.2 | 79 |
|
|
|
|
According to the one-way ANOVA analysis, there is significant difference between the various types of project returns. Their significance can be observed from the variance an average mean outputs as well as from the various coefficients used in the ANOVA analysis table.
Ho: There is no statistically significant difference between the impact on employee before and after the exposure. The analysis indicates a p-value of 1.75887702754493E-06 which is below the p-value of 0.5 that which is against the null hypothesis that indicates that there are no significant differences between the return on investments of the different groups of investments.
Ha: There is statistically significant difference between the impact on employee before and after the exposure which is an acceptable hypothesis based on the ANOVA analysis results.
FindingsThe results of the study showed that new employees who received training on safety could apply these measures throughout. Besides, exposure to particulate matter leads to ill health. The toxicity differs in different types of particulate matter. Lead poisoning was detected in some of the employees working in some sites.
Recommendations
The company should increase its level of monitoring employees working in various sites for lead exposure. That will make it possible for such employees to be detected early enough so that interventions can be taken. Besides, employees should be given personal protective equipment to protect them from exposure to toxic particulate matter. Such equipment includes face masks.
References
Asmoni, M. (2020). Research Gate. Retrieved 3 May 2020, from https://www.researchgate.net/publication/282463953_A_Review_on_the_Effectiveness_of_Safety_Training_Methods_for_Malaysia_Construction_Industry
Balanay, J. (2020). Assessment of Occupational Noise Exposure among Groundskeepers in North Carolina Public Universities. Retrieved 3 May 2020, from https://doi.org/10.4137%2FEHI.S39682
Gupta, P. (2020). Training ROI: Using Return on Investment for Training Programs. Retrieved 3 May 2020, from https://www.microassist.com/learning-dispatch/training-roi/
Nahm, F. S. (2017). What the P values really tell us. The Korean Journal of Pain, 30(4), 241. https://doi.org/10.3344/kjp.2017.30.4.241
Society, C. (2020). Lead toxicity with a new focus: Addressing low-level lead exposure in Canadian children | Canadian Paediatric Society. Retrieved 3 May 2020, from https://www.cps.ca/en/documents/position/lead-toxicity
Tandfonline.com. (2020). Retrieved 3 May 2020, from https://www.tandfonline.com/doi/pdf/10.1080/10962247.2014.1001884
Truitt, D. (2020). Retrieved 3 May 2020, from https://www.researchgate.net/publication/258187348_The_Effect_of_Training_and_Development_on_Employee_Attitude_as_it_Relates_to_Training_and_Work_Proficiency
Barkana, B. D., Saricicek, I., & Yildirim, B. (2017). Performance analysis of descriptive statistical features in retinal vessel segmentation via fuzzy logic, ANN, SVM, and classifier fusion. Knowledge-Based Systems, 118, 165-176.
Berghoff, A. S., Schur, S., Füreder, L. M., Gatterbauer, B., Dieckmann, K., Widhalm, G., ... & Preusser, M. (2016). Descriptive statistical analysis of a real life cohort of 2419 patients with brain metastases of solid cancers. ESMO open, 1(2), e000024.
Innocenti, A., Mori, F., Melita, D., Dreassi, E., Ciancio, F., & Innocenti, M. (2017). Evaluation of long-term outcomes of correction of severe blepharoptosis with advancement of external levator muscle complex: descriptive statistical analysis of the results. in vivo, 31(1), 111-115.
Ma’arif, M. Y., Motahar, S. M., & Mohd Satar, N. S. (2018). A descriptive statistical based analysis on perceptual of ERP training needs. In Proceedings of 2018 International Conference on Engineering, Science, and Application (ICESA 2018) (pp. 46-62).
McCarthy, R. V., McCarthy, M. M., Ceccucci, W., & Halawi, L. (2019). What Do Descriptive Statistics Tell Us. In Applying Predictive Analytics (pp. 57-87). Springer, Cham.
Peacock, H. (2019). Descriptive Statistical Analysis using SPSS.
Qiu, Y., Wei, M., & Bai, B. (2017). Descriptive statistical analysis for the PPG field applications in China: Screening guidelines, design considerations, and performances. Journal of Petroleum Science and Engineering, 153, 1-11.
Stypulkowski, J. B., Bernardeau, F. G., & Jakubowski, J. (2018). Descriptive statistical analysis of TBM performance at Abu Hamour Tunnel Phase I. Arabian Journal of Geosciences, 11(9), 191.
Wang, Y., Shao, X., Liu, C., Cai, G., Kou, L., & Wu, Z. (2019). Analysis of wind farm output characteristics based on descriptive statistical analysis and envelope domain. Energy, 170, 580-591.


