The whole assignment please
Hurricane Tracking (36 points)
Hurricane Katrina was the costliest and second deadliest hurricane that has made landfall in the United States. The system was a tropical depression on August 23, 2005 then became a major hurricane before dissipating as it merged with a front on August 31, 2005. In this lab you will be plotting hurricane data to help you examine characteristics and factors that may have influenced its movement and strength.
1. The data (date/time, latitude, longitude, pressure, and wind speed) in Table 1 are from the Tropical Cyclone Report on Hurricane Katrina (Knabb et al, 2005). Fill in the “stage” column with the correct designation based on wind speed. Note that the wind speeds on Table 1 are in knots. Designations are: tropical depression, tropical storm, category 1 hurricane, category 2 hurricane, category 3 hurricane, category 4 hurricane, category 5 hurricane. Data points where the storm was categorized as extratropical have been filled in for you.
2. Carefully plot each data point on the Hurricane Tracking Chart (Figure 1). Use a different color pen/pencil for each stage. Complete the color-coded key below the map. After points have been plotted, draw a curve connecting the points showing Katrina’s continuous path. Use the correct color for each segment of the curve to designate the storm’s strength.
3. What was the maximum wind speed and minimum pressure of Katrina? Which date and time did this occur?
4. How much time passed (days and hours) from its birth as a tropical depression to its peak?
5. How much time passed (days and hours) from its peak to its dissipation as it merged with a front?
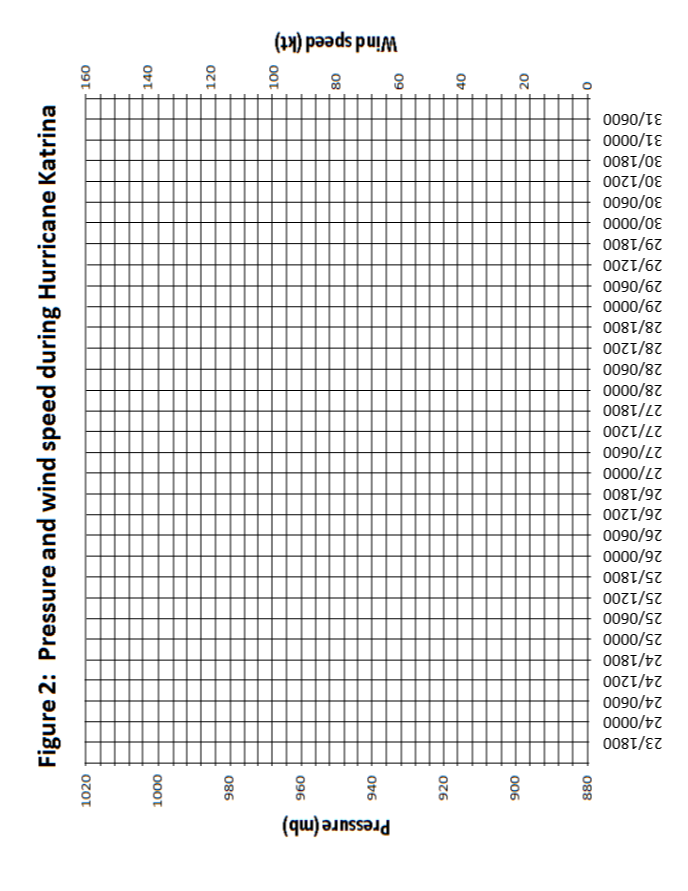
6. Notice that three of the data points have been highlighted with asterisks (*) on Table 1. Draw vertical lines from the bottom to the top of the graph on Figure 2 at each of these times and label the event (see back of Table 1) that each line represents.
7. Create a line graph on Figure 2 showing pressure over time for Katrina. Label the line as “pressure”. As you are graphing, keep in mind that the three data points highlighted above do not follow the six-hour gap between data points, but fall between them.
8. Create a line graph on Figure 2 showing wind speed over time for Katrina. Label the line as “wind speed”. As you are graphing, keep in mind that the three data points highlighted above do not follow the six-hour gap between data points, but fall between them.
9. Describe the relationship between pressure and wind speed.
10. Which is the causative agent—wind or pressure? (In other words, do differences in pressure cause wind or do differences in wind cause pressure?)
Examine the data and the storm track to help you answer the following questions.
11. Did the system weaken at any time before reaching its peak? If so, which date and time? If it weakened, provide an explanation why it may have done so.
12. Did the system strengthen again after reaching its peak before fully dissipating? If so, which date and time? If it strengthened, provide an explanation why it may have done so.
The data you examined is spaced apart by six hours with a few exception where the hurricane made landfall. For the next question, ignore the data points not at 0000, 0600, 1200, or 1800 hours.
13a. When was the greatest change in pressure across a six-hour period? What was the pressure change over this time period? Did pressure increase or decrease?
b. What likely caused this large change?
c. When was the greatest change in wind speed across a six-hour period? What was the change in wind speed over this time period? Did this greatest change coincide with the greatest change in pressure?
14. Is wind speed equal on all sides of a hurricane? If not, where will it be greatest? Explain.
15. The highest storm surges produced by Katrina exceeded 20 feet in some locations. Based on Katrina’s path, would these maximum surges have been right in New Orleans, to the east of New Orleans, or to the west of New Orleans? Why?
16. After making landfall for the final time, the remnants of Katrina moved toward the northeast. What accounts for this path?
17. Do you expect the sea surface temperature (SST) in the Gulf of Mexico was below normal, near normal, or above normal during the time of Hurricane Katrina? Why?
18. Examine the various NOAA sea surface temperature maps provided in class. Estimate how far from normal (if at all) the temperature in the Gulf of Mexico was along Katrina’s path prior to the storm hitting land.
19. After the storm passed by, would you expect the water temperature to increase or decrease? Why?
20. Examine the NOAA sea surface temperature maps provided in class. Is your answer to the previous question supported by the data? If so, by how much did the temperature change between from before to after Katrina passed through the Gulf of Mexico?
References:
Knabb, R.D., Rhome, J.R., and Brown, D.P. 2005. Tropical Cyclone Report, Hurricane Katrina, 23-30 August 2005. Retrieved from http://www.nhc.noaa.gov/data/tcr/AL122005_Katrina.pdf/
Table 1: Track, pressure, and wind speed data for Hurricane Katrina, 23-30 August 2005.
| Date/Time (UTC) | Latitude (°N) | Longitude (°W) | Pressure (mb) | Wind Speed (kt) | Stage | |
| 23/1800 | 23.1 | 75.1 | 1008 | 30 |
| |
| 24/0000 | 23.4 | 75.7 | 1007 | 30 |
| |
| 24/0600 | 23.8 | 76.2 | 1007 | 30 |
| |
| 24/1200 | 24.5 | 76.5 | 1006 | 35 |
| |
| 24/1800 | 25.4 | 76.9 | 1003 | 40 |
| |
| 25/0000 | 26.0 | 77.7 | 1000 | 45 |
| |
| 25/0600 | 26.1 | 78.4 | 997 | 50 |
| |
| 25/1200 | 26.2 | 79.0 | 994 | 55 |
| |
| 25/1800 | 26.2 | 79.6 | 988 | 60 |
| |
| *25/2230 | 26.0 | 80.1 | 984 | 70 | ||
| 26/0000 | 25.9 | 80.3 | 983 | 70 |
| |
| 26/0600 | 25.4 | 81.3 | 987 | 65 |
| |
| 26/1200 | 25.1 | 82.0 | 979 | 75 |
| |
| 26/1800 | 24.9 | 82.6 | 968 | 85 |
| |
| 27/0000 | 24.6 | 83.3 | 959 | 90 |
| |
| 27/0600 | 24.4 | 84.0 | 950 | 95 |
| |
| 27/1200 | 24.4 | 84.7 | 942 | 100 |
| |
| 27/1800 | 24.5 | 85.3 | 948 | 100 |
| |
| 28/0000 | 24.8 | 85.9 | 941 | 100 |
| |
| 28/0600 | 25.2 | 86.7 | 930 | 125 |
| |
| 28/1200 | 25.7 | 87.7 | 909 | 145 |
| |
| 28/1800 | 26.3 | 88.6 | 902 | 150 |
| |
| 29/0000 | 27.2 | 89.2 | 905 | 140 |
| |
| 29/0600 | 28.2 | 89.6 | 913 | 125 |
| |
| **29/1110 | 29.3 | 89.6 | 920 | 110 |
| |
| 29/1200 | 29.5 | 89.6 | 923 | 110 |
| |
| ***29/1445 | 30.2 | 89.6 | 928 | 105 |
| |
| 29/1800 | 31.1 | 89.6 | 948 | 80 |
| |
| 30/0000 | 32.6 | 89.1 | 961 | 50 |
| |
| 30/0600 | 34.1 | 88.6 | 978 | 40 |
| |
| 30/1200 | 35.6 | 88.0 | 985 | 30 |
| |
| 30/1800 | 37.0 | 87.0 | 990 | 30 |
| |
| 31/0000 | 38.6 | 85.3 | 994 | 30 | extra tropical | |
| 31/0600 | 40.1 | 82.9 | 996 | 25 | ||
| 31/1200 |
|
|
|
| merged with front | |
| *25/2230 landfall near Broward/Miami-Dade County line, Florida | ||||||
| **29/1110 landfall near Buras, Louisiana | ||||||
| ***29/1445 landfall near Louisiana/Mississippi border | ||||||

Date/Time
160
140
120
100
80
60
40
20
104


