Instructions Create a PowerPoint presentation for the Sun Coast Remediation research project to communicate the findings and suggest recommendations. Please use the following format: Slide 1: Include
Running head: FINAL SUN COAST PROJECT 0
Final Sun Coast Project
Name
Columbia Southern University
Table of Contents
Executive Summary Error: Reference source not found
Introduction Error: Reference source not found
Statement of the Problems Error: Reference source not found
Literature Review Error: Reference source not found
Research Objectives Error: Reference source not found
Research Questions and Hypotheses Error: Reference source not found
Research Methodology, Design, and Methods Error: Reference source not found
Research Methodology Error: Reference source not found
Research Design Error: Reference source not found
Research Methods Error: Reference source not found
Data Collection Methods Error: Reference source not found
Sampling Design Error: Reference source not found
Data Analysis Procedures Error: Reference source not found
Data Analysis: Descriptive Statistics and Assumption Testing Error: Reference source not found
Correlation: Descriptive Statistics and Assumption Testing Error: Reference source not found
Frequency distribution table. Error: Reference source not found
Histogram. Error: Reference source not found
Descriptive statistics table. Error: Reference source not found
Measurement scale. Error: Reference source not found
Measure of central tendency. Error: Reference source not found
Evaluation. Error: Reference source not found
Simple Regression: Descriptive Statistics and Assumption Testing Error: Reference source not found
Frequency distribution table Error: Reference source not found
Histogram. Error: Reference source not found
Descriptive statistics table. Error: Reference source not found
Measurement scale. Error: Reference source not found
Measure of central tendency. Error: Reference source not found
Evaluation. Error: Reference source not found
Multiple Regression: Descriptive Statistics and Assumption Testing Error: Reference source not found
Frequency distribution table. Error: Reference source not found
Histogram. Error: Reference source not found
Descriptive statistics table. Error: Reference source not found
Measurement scale. Error: Reference source not found
Measure of central tendency. Error: Reference source not found
Evaluation. Error: Reference source not found
Independent Samples t Test: Descriptive Statistics and Assumption Testing Error: Reference source not found
Frequency distribution table. Error: Reference source not found
Histogram. Error: Reference source not found
Descriptive statistics table. Error: Reference source not found
Measurement scale. Error: Reference source not found
Measure of central tendency. Error: Reference source not found
Evaluation. Error: Reference source not found
Dependent Samples (Paired-Samples) t Test: Descriptive Statistics and Assumption Testing Error: Reference source not found
Frequency distribution table. Error: Reference source not found
Histogram. Error: Reference source not found
Descriptive statistics table. Error: Reference source not found
Measurement scale. Error: Reference source not found
Measure of central tendency. Error: Reference source not found
Evaluation. Error: Reference source not found
ANOVA: Descriptive Statistics and Assumption Testing Error: Reference source not found
Frequency distribution table. Error: Reference source not found
Histogram. Error: Reference source not found
Descriptive statistics table. Error: Reference source not found
Measurement scale. Error: Reference source not found
Measure of central tendency. Error: Reference source not found
Evaluation. Error: Reference source not found
Data Analysis: Hypothesis Testing Error: Reference source not found
Correlation: Hypothesis Testing Error: Reference source not found
Simple Regression: Hypothesis Testing Error: Reference source not found
Multiple Regression: Hypothesis Testing Error: Reference source not found
Independent Samples t Test: Hypothesis Testing Error: Reference source not found
Dependent Samples (Paired Samples) t Test: Hypothesis Testing Error: Reference source not found
ANOVA: Hypothesis Testing Error: Reference source not found
Findings 45
Recommendations 46
References 48
Executive Summary
Sun Coast had identified six areas of concern that require thorough research and analysis to come up with recommendations for continued profitability and safety of the firm. To produce dependable results for each of the six objectives, quantitative research analysis for each area was completed.
Based on questions of personal protective equipment, correlation results analysis shows that employees have to use respirators while operating in the firm. A paired sample t-test was applied to indicate that the employee lead blood levels did not increase during the first remediation project. However, it was established that the employee lead blood levels were far above the current recommended levels, and this necessitates further stringent measures.
Looking at the training effectiveness, a simple regression analysis was utilized to sustain the assumption that further safety training had the potential of lessening time lost in hours. Moreover, an independent t-test was applied to discover a revised version of new employee training which is more effective than the older version, and have to be implemented fully.
Based on the budgetary predictions, a multiple regression analysis was utilized to apply various sound measurements to predict the noise in the workplace and thereby make a prediction on the need for further investment in protection from noise pollution. It is worth noting that the analysis was only reasonably sufficient at forecasting ambient decibel levels and have to be improved soon. Furthermore, an ANOVA test was utilized to establish that there are significant variances in return on investment (ROI), for the different services offered by the company. Therefore, budgetary aspects should be analyzed to determine the reasons behind the uneven returns before the expansion of every service. The project will be finalized with recommendations for Sun Coast.
Introduction
Senior leadership at Sun Coast has identified several areas for concern that they believe could be solved using business research methods. The previous director was tasked with conducting research to help provide information to make decisions about these issues. Although data were collected, the project was never completed. Senior leadership is interested in seeing the project through to fruition. The following is the completion of that project and includes the statement of the problems, literature review, research objectives, research questions and hypotheses, research methodology, design, and methods, data analysis, findings, and recommendations.
Statement of the Problems
Six business problems were identified:
Particulate Matter (PM)
There is a concern that job-site particle pollution is adversely impacting employee health. Although respirators are required in certain environments, PM varies in size depending on the project and job site. PM that is between 10 and 2.5 microns can float in the air for minutes to hours (e.g., asbestos, mold spores, pollen, cement dust, fly ash), while PM that is less than 2.5 microns can float in the air for hours to weeks (e.g. bacteria, viruses, oil smoke, smog, soot). Due to the smaller size of PM that is less than 2.5 microns, it is potentially more harmful than PM that is between 10 and 2.5 since the conditions are more suitable for inhalation. PM that is less than 2.5 is also able to be inhaled into the deeper regions of the lungs, potentially causing more deleterious health effects. It would be helpful to understand if there is a relationship between PM size and employee health. PM air quality data have been collected from 103 job sites, which is recorded in microns. Data are also available for average annual sick days per employee per job-site.
Safety Training Effectiveness
Health and safety training is conducted for each new contract that is awarded to Sun Coast. Data for training expenditures and lost-time hours were collected from 223 contracts. It would be valuable to know if training has been successful in reducing lost-time hours and, if so, how to predict lost-time hours from training expenditures.
Sound-Level Exposure
Sun Coast’s contracts generally involve work in noisy environments due to a variety of heavy equipment being used for both remediation and the clients’ ongoing operations on the job sites. Standard ear-plugs are adequate to protect employee hearing if the decibel levels are less than 120 decibels (dB). For environments with noise levels exceeding 120 dB, more advanced and expensive hearing protection is required, such as earmuffs. Historical data have been collected from 1,503 contracts for several variables that are believed to contribute to excessive dB levels. It would be important if these data could be used to predict the dB levels of work environments before placing employees on-site for future contracts. This would help the safety department plan for procurement of appropriate ear protection for employees.
New Employee Training
All new Sun Coast employees participate in general health and safety training. The training program was revamped and implemented six months ago. Upon completion of the training programs, the employees are tested on their knowledge. Test data are available for two groups: Group A employees who participated in the prior training program and Group B employees who participated in the revised training program. It is necessary to know if the revised training program is more effective than the prior training program.
Lead Exposure
Employees working on job sites to remediate lead must be monitored. Lead levels in blood are measured as micrograms of lead per deciliter of blood (μg/dL). A baseline blood test is taken pre-exposure and postexposure at the conclusion of the remediation. Data are available for 49 employees who recently concluded a 2-year lead remediation project. It is necessary to determine if blood lead levels have increased.
Return on Investment
Sun Coast offers four lines of service to their customers, including air monitoring, soil remediation, water reclamation, and health and safety training. Sun Coast would like to know if each line of service offers the same return on investment. Return on investment data are available for air monitoring, soil remediation, water reclamation, and health and safety training projects. If return on investment is not the same for all lines of service, it would be helpful to know where differences exist.
Literature Review
The primary issue facing the Sun Coast is employee safety. Sun Coast has not yet established adequate measures to promote the safety of its workers. Most of the workers at Sun Coast are not performing effectively as the organizational management has not created a supportive and comfortable work environment. Therefore, the Sun Coast is also facing severe productivity issues that should be addressed adequately. This paper aims to review pieces of literature that can effectively solve the problems that Sun Coast is facing.
Shan et al., 2014 researched to determine the factors controlling worker satisfaction in Lenovo Group. The research employed an inclusive assessment index system worker satisfaction was created based on a survey and a systematic analysis of data. Through the application of the structural equation modelling method, the significant factors influencing worker compensation and their interrelationships were spotted. The technique employed in the research is critical and can be applied as a reference for measuring satisfaction among workers and administration in IT service enterprise. Sun Coast can utilize the research to come up with practical ways of boosting employee satisfaction and promoting productivity.
Afshinpour (2014) conducted a correlation study to determine the relationship between employee satisfaction and leadership styles. This research displayed a quantitative correlation study to determine how leadership style partiality correlates with worker satisfaction with control among leaders and employees of some organizations. Afshinpour (2014) measures the preference of each of the five styles of leadership and scrutinizes correlations with the measure of worker satisfaction. The study showed that each of the five leadership styles has a constructive correlation with worker satisfaction, and determined that situational leadership can be the most effective style for leaders in some organizations. Sun Coast can adopt situational leadership to promote efficiency in its operations.
Yunus and Ernawati (2018) researched the link between redesigning office and productivity of workers. Yunus and Ernawati (2018) applied a mixed-method approach that integrated hierarchical regression analysis, factor analysis, and most significant change (MSC). The research found out that three variables appeared to impact the office redesign recognized by respondents: privacy, collaboration and friendship. Privacy and collaboration were found to exercise a positive control of employee productivity, while association does not. The management of Sun Coast has to promote confidentiality and collaboration, which are crucial in facilitating employee productivity. Sun Coast should also to come up with office redesign strategies that favour both the older and young generations.
Bayram (2019) conducted a study to determine the relationships between safety training and competence, safety performance, employee involvement and satisfaction and employee satisfaction. The study collected data from128 manufacturing companies in Turkey that had implemented Occupational Health and Safety Management. Bayram (2019) analyzed data using confirmatory factor analysis and respectively, exploration. Results showed that safety training and competence have a considerable positive impact on worker satisfaction, and safety performance has a significant positive effect on worker satisfaction. Sun Coast should, therefore, improve their employee participation, involvement and safety training to promote satisfaction and productivity.
Tarlow (2015) conducted research aimed at teaching the principles of ANOVA. According to Zwanenburg et al., (2011), the knowledge of principles of ANOVA plays a fundamental role in enhancing the knowledge and skills of workers. Employees who have been trained on the principles of ANOVA can solve significant issues in the organization through creativity and critical thinking. Tarlow (2015) emphasizes the effectiveness of inferential reasoning, which is crucial in resolving substantial matters in schools. Findings of Tarlow (2015) were also stressed by Zwanenburg et al., (2011) who conducted related research to establish the effectiveness of ANOVA. The findings of Tarlow (2015) and Zwanenburg et al., (2011) can be applied by Sun Coast to resolve the issues that they are currently facing. Improving the creativity and critical thinking of employees can fundamentally enhance their productivity (Tarlow, 2015).
Research Objectives
In every organizational setting, research methods play a fundamental role as they enable the management to monitor progress. Therefore, all involved stakeholders should have the necessary knowledge in methods of research such as collection, documentation, sampling, evaluation as well as presentation (Bell, Bryman & Harley, 2018). Sun Coast is expected to be successful in the project if it utilizes effective research methods to tackle the existing problems and achieve its objectives.
Research Problems
A research problem describes a condition in theory setting that necessitates an instantaneous solution. It is evident that Sun Coast is facing various arising issues. These issues can affect the future of the business. If the organization won’t address the current problems effectively, there are high chances of business failure (Shan et al., 2014). The following are the problems faced by Sun Coast:
The health of the employees is at risk particularly as a result of the pollution from the organizational site
The workers in the Sun Coast don’t have effective training to promote their safety at work
The management of Sun Coast has not provided the necessary equipment and materials required in controlling noise pollution at workplace.
The Sun Coast’s management lacks sound measures to curtail the effects of leads on staff members.
Research Objectives
Research objectives describe the specific subjects within the scope of the affirmed purpose that the researcher desires to inspect and deliver required results (Bell, Bryman & Harley, 2018). The Sun Coast’s Remediation project requires formulation of research objectives for effectiveness in operations. Research objectives are crucial as they will enable the director to communicate to the management about the project requirements and expectations. The following are the research objectives for Sun Coast Remediation project:
To determine whether the employee have been provided with the necessary training
To know the effect of sound-level exposure
To establish whether every service line provides similar return on investment
To establish whether blood-lead levels have been addressed by the concerned parties.
To determine the effect of lead emissions on staff members
Research Questions and Hypothesis
A hypothesis describes the prediction of the researcher on a study’s outcome. A hypothesis should be in two forms that are not based on opinion but on the probable differences. The research hypothesis should align with the research objectives and problems (Creswell & Creswell, 2017). The following are the research hypothesis:
RQ1: What is the connection between the service offered and returns gotten from them?
Ho1 (null hypothesis): There is no considerable correlation between services offered and the returns achieved.
Ho2 (Alternative hypothesis): There exists a considerable correlation between the services offered and the achieved returns.
RQ2: Are the methods applied in training employees effective as expected?
Ho1 (null hypothesis): The used training methods don’t portray any probable efficiency signs to the organization.
Ho2 (alternative hypothesis): The used training methods portray probable efficiency signs to the organization
RQ3: Can the organization control noise pollution experienced in the site?
Ho1 (null hypothesis): Noise pollution experienced in the operation site cannot be controlled at all costs
Ho2 (alternative hypothesis): Noise pollution generated in the site can be controlled to some extent by the use of hearing aids and earmuffs
Can the organization control the level of lead pollution and the impact it has on employees?
Ho1 (null hypothesis): The organization cannot control the level of lead pollution and its impacts on employees
Ho2 (alternative hypothesis): The organization can control the level of lead pollution and its impacts on employees by taking the necessary safety measures
Research Methodology, Design, and Methods
Sun Coast has been experiencing a challenge of upholding the safety of its workers. The management of the organization should, therefore, establish coherent strategies to control the impacts of lead on employees. This discussion aims to identify the problems faced by the Sun Coast and come up with their solutions. Positivist worldview research methodology will be utilized in this discussion. The study will further use the scientific method of analysis coupled with correlative research design. The process of analyzing data will involve one way ANOVA, paired sample t-test, independent t t-test, simple regression and multiple regressions.
Research methodology
Positivist worldview centres on validity, truth, reason, and hypothesis and data analysis. Positivist worldview holds that science is the only way of acquiring truthful knowledge through observation, as well as trustworthiness measurement (Keightley, 2010). Positivism worldview was employed in this research due to various reasons. First, it relies on quantitative data, a factor that will make the research more reliable. Secondly, it will promote the achievement of trustful study results as it is more scientific in its method of analysis. Thirdly, the technique offers objective data that researchers can use to make scientific suppositions.
Research Design
A correlative research design will be employed in this study, as it is crucial in testing the relationship between variables (Cook & Cook, 2016). The variables to be tested in this discussion include hours lost in training and training expenses, PM and health impact on the workers, updating of the different training programs and archived training, lead poisoning and blood of the employees, returns on investment and the services that lead to financial growth, and aspired level of the work environment and the existing healthy work environment. The correlation research design will effectively measure the relationship between variables hence determining how a given incident is caused (Cook & Cook, 2016).
Research Methods
The scientific research method has proved to be very reliable and competent in all sorts of organizational studies (Donkoh, 2017). The scientific research method has been selected for this discussion due to various reasons. First, it facilitates the application of both the qualitative and quantitative approaches to collecting data. Secondly, it ensures that the subjects of the research are controlled quickly hence making the data collection process effective. Additionally, the scientific method guarantees a step-by-step advance of data collection, thus avoiding errors and bias. The scientific method also paves a room for the ethical handling of the research subjects (Donkoh, 2017).
Methods of Data Collection
The main methods of data collection are interviewing and observation. Members of the staff will be observed in their daily operations and activities. Workers and management will also be interviewed while completing their routine tasks and processes. The observations and interviews will be recorded for further analysis (Harwoodn & Hutchinson, 2009).
Sampling Design
The research will utilize convenient sampling due to its various benefits. First, a convenient sample will ensure that research samples are reached quickly. Secondly, it will save on time and resources as the research subjects will be identified easily. Additionally, the method is crucial in ensuring that the data is readily available. Moreover, convenient sampling is useful in pilot studies (Harwoodn & Hutchinson, 2009).
Data Analysis Procedure
The process of data analysis will utilize different methods. First, simple regression will be used to help in the prediction of the value of the dependent variable. Secondly, the multiple regressions will be used to learn more about the connection between the dependent and independent variables (Booth, 2018). Thirdly, independent t-test will be used to compare the means of the two independent groups to wrap up whether a statistical proof exists that the connection means are significantly different. Moreover, a paired sample t-test will be used to assert whether the difference in the trend among the observations equals to zero (Booth, 2018)o. Finally, the one-way ANOVA testing will be used to affirm whether any statistically significant differences among the study groups exist (Booth, 2018).
Data Analysis: Descriptive Statistics and Assumption Testing
Sun Coast data was investigated to choose whether normal distribution of data was shown, which would be compulsory for postulation for parametric statistical tests. All the investigation questions were known to have ratio data that is classifiable, and has a considerable distance between the data values. The questions have a true zero features. Mean (average), mode, and median are very useful in the study.
Correlation: Descriptive Statistics and Assumption Testing
Frequency distribution table
| Frequency | Range | |
| 13 | ||
| 18 | ||
| 24 | ||
| 18 | ||
| 12 | ||
| 10 | ||
| 11 | ||
| 12 |
Histogram

Descriptive statistics table
| Sick Days | |
| Mean | 7.126214 |
| Standard Error | 0.186484 |
| Median | |
| Mode | |
| Standard Deviation | 1.892605 |
| Sample Variance | 3.581953 |
| Kurtosis | 0.124923 |
| Skewness | 0.14225 |
| Range | 10 |
| Minimum | |
| Maximum | 12 |
| Sum | 734 |
| Count | 103 |
Measurement scale
The four scales used to estimate the information are ratio, nominal, interval and ordinal scales. However, both the ordinal and nominal values do not have substantial distance between data values or true zero. Interval data scales have a considerable distance amid data values; however, they have no true zero. Ratios data can be grouped, well-arranged, and have considerable distance between data values, and have true zero (Simonsohn, Simmons & Nelson, 2019). Therefore, the measurement scale used in this scenario is ratio due to the data being utilized is the sick days.
The measure of central tendency
Central tendency illustrates the degree to which data points are disseminated around the mid-point of the curve. The mid-point is estimated by average, median, and mode. The mean is 7.12, the median is seven, and the mode is seven.
Evaluation
The parametric test demands that the assumption of normality be met. Normality is when data is distributed normally and when graphed looks like a bell shape. There are other different typical assumptions that should be met, depending on the statistical procedure used, include sample size, levels of measurement, consistency of variance, independence, absence of outliers, linearity, etc. In this scenario, there is, in fact, a bell-shaped graph, and the data were distributed normally.
Simple Regression: Descriptive Statistics and Assumption Testing
Frequency distribution table
| Lost Time Hours | Frequency |
| 10 | |
| 35 | |
| 60 | |
| 85 | |
| 110 | 17 |
| 135 | 18 |
| 160 | 24 |
| 185 | 27 |
| 210 | 37 |
| 235 | 24 |
| 260 | 21 |
| 285 | 15 |
| 310 | 12 |
| 335 | |
| More |
Histogram

Descriptive statistics table
| Lost Hours | |
| Mean | 188.0044843 |
| Standard Error | 4.803089447 |
| Median | 190 |
| Mode | 190 |
| Standard Deviation | 71.72542099 |
| Sample Variance | 5144.536016 |
| Kurtosis | -0.501223533 |
| Skewness | -0.081984874 |
| Range | 350 |
| Minimum | 10 |
| Maximum | 360 |
| Sum | 41925 |
| Count | 223 |
Measurement scale
According to the information, there are safety training expenditures and lost time hours. The measurement scale used in the scenario is the ratio.
A measure of central tendency
The mid-point is measured by mean, median, and mode. The mean is 188.0044843, the median is 190, and the mode is 190.
Evaluation
In this scenario, the lost hours range from 10 to 335, with 10 and 335 having fewer numbers of lost hours. Lost time hours surge progressively, displaying a bell-shaped graph, and the data was distributed normally. Therefore, the assumptions for parametric statistical testing were met.
Multiple Regression: Descriptive Statistics and Assumption Testing
Frequency distribution table
| Bin | Frequency |
| 103.38 | |
| 104.3697 | |
| 105.3593 | |
| 106.349 | |
| 107.3386 | |
| 108.3283 | |
| 109.3179 | |
| 110.3076 | 12 |
| 111.2973 | 18 |
| 112.2869 | 17 |
| 113.2766 | 26 |
| 114.2662 | 22 |
| 115.2559 | 27 |
| 116.2456 | 47 |
| 117.2352 | 36 |
| 118.2249 | 44 |
| 119.2145 | 47 |
| 120.2042 | 53 |
| 121.1938 | 61 |
| 122.1835 | 60 |
| 123.1732 | 62 |
| 124.1628 | 74 |
| 125.1525 | 70 |
| 126.1421 | 81 |
| 127.1318 | 92 |
| 128.1214 | 73 |
| 129.1111 | 105 |
| 130.1008 | 80 |
| 131.0904 | 88 |
| 132.0801 | 67 |
| 133.0697 | 50 |
| 134.0594 | 56 |
| 135.0491 | 35 |
| 136.0387 | 30 |
| 137.0284 | 19 |
| 138.018 | |
| 139.0077 | |
| 139.9973 | |
| More |
Histogram

Descriptive statistics table
| Decibels | |
| Mean | 124.8359428 |
| Standard Error | 0.177944692 |
| Median | 125.721 |
| Mode | 127.315 |
| Standard Deviation | 6.898656622 |
| Sample Variance | 47.59146318 |
| Kurtosis | -0.3141873 |
| Skewness | -0.418952188 |
| Range | 37.607 |
| Minimum | 103.38 |
| Maximum | 140.987 |
| Sum | 187628.422 |
| Count | 1503 |
Measurement scale
In every contract, employees are subject to noises during the job. These noises eventually lead to injuries. The louder the noises, the more they are susceptible to injuries. The information provided utilizes the ratio scale.
The measure of central tendency
The mean decibels are 124.8359428, the median 125.721 and the mode 127.315
Evaluation
The decibels employees are exaggerated by range from 103 to 140. This histogram is bell-shaped with the most decibels at 129.1111; thus, assumptions for parametric statistical testing observed.
Independent Samples t-Test:
| Prior Training | |
| Bin | Frequency |
| 50 | |
| 55.85714 | |
| 61.71429 | |
| 67.57143 | |
| 73.42857 | 14 |
| 79.28571 | 10 |
| 85.14286 | |
| More | |
| Revised Training | |
| Bin | Frequency |
| 75 | |
| 78.14286 | |
| 81.28571 | 10 |
| 84.42857 | 12 |
| 87.57143 | 14 |
| 90.71429 | 10 |
| 93.85714 | |
| More | |
Histogram


Descriptive statistics table
| Prior Training | Revised Training | |||
| Mean | 69.79032258 | Mean | 84.77419355 | |
| Standard Error | 1.402788093 | Standard Error | 0.659478888 | |
| Median | 70 | Median | 85 | |
| Mode | 80 | Mode | 85 | |
| Standard Deviation | 11.04556449 | Standard Deviation | 5.192741955 | |
| Sample Variance | 122.004495 | Sample Variance | 26.96456901 | |
| Kurtosis | -0.77667598 | Kurtosis | -0.352537913 | |
| Skewness | -0.086798138 | Skewness | 0.144084526 | |
| Range | 41 | Range | 22 | |
| Minimum | 50 | Minimum | 75 | |
| Maximum | 91 | Maximum | 97 | |
| Sum | 4327 | Sum | 5256 | |
| Count | 62 | Count | 62 | |
Measurement scale
Test scores from prior training and revised training were reorded. The ratio measurement is the scale used in this scenario.
Measure of central tendency
The preceding training scores group had a mean of 69.79032258, a median of 70, and a mode of 80. In the revised training with group b, the mean was 84.77419355, a median of 85 and mode 85.
Evaluation
The histogram shows a normal bell-shaped figure from the data provided. Therefore, assumptions for parametric statistical testing were met.
Dependent Samples (Paired-Samples) t-Test: Descriptive Statistics and Assumption Testing
Frequency distribution table
| Pre-Exposure | Post Exposure | |||
| Bin | Frequency | Bin | Frequency | |
| 16 | 16 | |||
| 24 | 24 | |||
| 32 | 32 | |||
| 40 | 13 | 40 | 11 | |
| 48 | 12 | 48 | 14 | |
| More | More | |||
Histogram


Descriptive statistics table
| Pre-Exposure | Post Exposure | ||
| Mean | 32.85714 | Mean | 33.28571429 |
| Standard Error | 1.752307 | Standard Error | 1.781423416 |
| Median | 35 | Median | 36 |
| Mode | 36 | Mode | 38 |
| Standard Deviation | 12.26615 | Standard Deviation | 12.46996391 |
| Sample Variance | 150.4583 | Sample Variance | 155.5 |
| Kurtosis | -0.57604 | Kurtosis | -0.654212507 |
| Skewness | -0.42511 | Skewness | -0.483629097 |
| Range | 50 | Range | 50 |
| Minimum | Minimum | ||
| Maximum | 56 | Maximum | 56 |
| Sum | 1610 | Sum | 1631 |
| Count | 49 | Count | 49 |
Measurement scale
The data provided is pre-exposure numbers and post-exposure using the ratio measurement.
Measure of central tendency
The pre-exposure mean is 32.85714; the median is 35 and mode 36. The post-exposure mean is 33.28571429, median 36, and mode 38.
Evaluation
The histogram demonstrates a normal bell-shaped figure from the data provided. Therefore, assumptions for parametric statistical testing were met.
ANOVA: Descriptive Statistics and Assumption Testing
Frequency distribution table
| Air | Soil | |||
| Bin | Frequency | Bin | Frequency | |
| 5.75 | 7.75 | |||
| 8.5 | 9.5 | 10 | ||
| 11.25 | 11.25 | |||
| More | More | |||
| Water | Training | |||
| Bin | Frequency | Bin | Frequency | |
| 5.25 | 4.25 | |||
| 7.5 | 5.5 | |||
| 9.75 | 6.75 | |||
| More | More |
Histogram


Descriptive statistics table
| Air | Soil | ||
| Mean | 8.9 | Mean | 9.1 |
| Standard Error | 0.684028316 | Standard Error | 0.390006748 |
| Median | Median | ||
| Mode | 11 | Mode | |
| Standard Deviation | 3.059067625 | Standard Deviation | 1.744163199 |
| Sample Variance | 9.357894737 | Sample Variance | 3.042105263 |
| Kurtosis | -0.62830092 | Kurtosis | 0.119230317 |
| Skewness | -0.360849171 | Skewness | 0.492001831 |
| Range | 11 | Range | |
| Minimum | Minimum | ||
| Maximum | 14 | Maximum | 13 |
| Sum | 178 | Sum | 182 |
| Count | 20 | Count | 20 |
| Water | Training | ||
| Mean | Mean | 5.4 | |
| Standard Error | 0.575828922 | Standard Error | 0.265567912 |
| Median | Median | ||
| Mode | Mode | ||
| Standard Deviation | 2.575185226 | Standard Deviation | 1.187655807 |
| Sample Variance | 6.631578947 | Sample Variance | 1.410526316 |
| Kurtosis | -0.237524639 | Kurtosis | 0.253746631 |
| Skewness | 0.760206271 | Skewness | 0.159183094 |
| Range | Range | ||
| Minimum | Minimum | ||
| Maximum | 12 | Maximum | |
| Sum | 140 | Sum | 108 |
| Count | 20 | Count | 20 |
Measurement scale
The information given is using the ratio measurement.
Measure of central tendency
The mean for air is 8.9, the median nine, and mode 11. For air, the mean is 9.1, median 8, and mode 8. Water means 7, the median is 6, and mode is 6. The central training tendency has a mean of 5.4, median five, and mode 5.
Evaluation
The histogram shows a normal bell-shaped figure from the data provided. Therefore, assumptions for parametric statistical testing were observed.
Data Analysis: Hypothesis Testing
In this section, the Sun Coast Remediation data set will be utilized to perform a multiple regression analysis, simple regression analysis and correlation analysis to test the identified hypotheses.
Correlation: Hypothesis Testing
Hypothesis:
Ho1: There is no statistically noteworthy connection between the size of the PM and the health of the employee
Ha2: There is a statistically noteworthy connection between the size of the PM and the health of the employee
Correlation Data:
|
| Microns | mean annual sick days per employee |
| Microns |
| |
| mean annual sick days per employee | -0.71598 |
Regression Analysis Output:
| SUMMARY OUTPUT |
|
|
|
|
|
|
|
|
|
|
|
|
|
|
|
|
|
|
| Regression Statistics |
|
|
|
|
|
|
|
|
| Multiple R | 0.715984185 |
|
|
|
|
|
|
|
| R Square | 0.512633354 |
|
|
|
|
|
|
|
| Adjusted R Square | 0.507807941 |
|
|
|
|
|
|
|
| Standard Error | 1.327783455 |
|
|
|
|
|
|
|
| Observations | 103 |
|
|
|
|
|
|
|
|
|
|
|
|
|
|
|
|
|
| ANOVA |
|
|
|
|
|
|
|
|
|
| Df | SS | MS | F | Significance F |
|
|
|
| Regression | 187.2953239 | 187.2953 | 106.2361758 | 1.89059E-17 |
|
|
| |
| Residual | 101 | 178.0638994 | 1.763009 |
|
|
|
|
|
| Total | 102 | 365.3592233 |
|
|
|
|
|
|
|
|
|
|
|
|
|
|
|
|
|
| Coefficients | Standard Error | t Stat | P-value | Lower 95% | Upper 95% | Lower 95.0% | Upper 95.0% |
| Intercept | 10.08144483 | 0.315156969 | 31.98865 | 1.16929E-54 | 9.456258184 | 10.70663148 | 9.45625818 | 10.70663148 |
| Microns | -0.522376554 | 0.050681267 | -10.3071 | 1.89059E-17 | -0.622914554 | -0.421838554 | -0.62291455 | -0.421838554 |
The correlation data shows that the Pearson’s correlation coefficient (r) is -0.7158. What this means is that there is a negative correlation between the yearly number of the sick days per a worker and the size of the PM. Therefore, the size of the PM decreases as the number if sick days shoot up. Moreover, since the r value is almost to -1, it can be concluded that the correlation is stoutly negative. The r-value of -0.7158 equates to an r2 of 0.51 (which is further clear in the regression analysis output), which clarifies the variance of 51% between the variables.
From the regression analysis output, the p-value equals to 1.89099E-17, which is less than the 0.05 alpha. Therefore, the null hypothesis is rejected and the alternative hypothesis is accepted (Meissner, 2015). Accepting the alternative hypothesis means that there is a statistically considerable relationship between the health of the employee and the size of the PM. From the r-value, the relationship is stoutly negative.
Simple Regression: Hypothesis Testing
Hypothesis:
Ho2: There is no statistically considerable relationship between the expenditure on safety training and the time hours lost
Ha2: There is a statistically considerable relationship between the expenditure on safety training and the time hours lost
Simple Regression Output:
| SUMMARY OUTPUT |
|
|
|
|
|
|
|
|
|
|
|
|
|
|
|
|
|
|
| Regression Statistics |
|
|
|
|
|
|
|
|
| Multiple R | 0.939559324 |
|
|
|
|
|
|
|
| R Square | 0.882771723 |
|
|
|
|
|
|
|
| Adjusted R Square | 0.882241279 |
|
|
|
|
|
|
|
| Standard Error | 24.61328875 |
|
|
|
|
|
|
|
| Observations | 223 |
|
|
|
|
|
|
|
|
|
|
|
|
|
|
|
|
|
| ANOVA |
|
|
|
|
|
|
|
|
|
| Df | SS | MS | F | Significance F |
|
|
|
| Regression | 1008202.105 | 1008202.105 | 1664.210687 | 7.6586E-105 |
|
|
| |
| Residual | 221 | 133884.8903 | 605.8139831 |
|
|
|
|
|
| Total | 222 | 1142086.996 |
|
|
|
|
|
|
|
|
|
|
|
|
|
|
|
|
|
| Coefficients | Standard Error | t Stat | P-value | Lower 95% | Upper 95% | Lower 95.0% | Upper 95.0% |
| Intercept | 273.449419 | 2.665261963 | 102.5975768 | 2.1412E-188 | 268.1968373 | 278.7020007 | 268.1968373 | 278.7020007 |
| safety training expenditure | -0.143367741 | 0.003514368 | -40.79473848 | 7.6586E-105 | -0.150293705 | -0.136441778 | -0.150293705 | -0.13644178 |
The fact that there are only two variables means that the Multiple R is the same to the Person’s r. It is evident the Multiple R-value is 0.93956, meaning that there is a strong constructive relationship between the variables. The R-value of 0.8828 points out that the regression model describes the 88.28% of the variation between the expenditure on safety training, and the time lost in hours. The significant high R square value means that the model has a dependable predictive power. The value if ANOVA significance (F) value is 7.6586E-105, which is significantly lesser that the alpha value of 0.05. What this means is that there is a statistically considerable relationship between the two variables (Ludbrook, 2010). Therefore, the null hypothesis is rejected and the alternative hypothesis is accepted. What this means is that there is a statistically significant relationship between the expenditure on safety training, and the time lost in hours.
The regression model as an equation is as represented below:
y = 273.45 - 0.14X
Where y is lost time in hours and X is the expenditure on safety training.
Multiple Regression: Hypothesis Testing
Hypotheses:
Ha3: Noise levels have no statistically relationship with chord length, displacement, velocity, angle and frequency
Ha3: Noise levels have statistically relationship with chord length, displacement, velocity, angle and frequency
Multiple Regression Analysis Output:
| SUMMARY OUTPUT |
|
|
|
|
|
|
|
|
|
|
|
|
|
|
|
|
|
|
| Regression Statistics |
|
|
|
|
|
|
|
|
| Multiple R | 0.601841822 |
|
|
|
|
|
|
|
| R Square | 0.362213579 |
|
|
|
|
|
|
|
| Adjusted R Square | 0.360083364 |
|
|
|
|
|
|
|
| Standard Error | 5.51856585 |
|
|
|
|
|
|
|
| Observations | 1503 |
|
|
|
|
|
|
|
|
|
|
|
|
|
|
|
|
|
| ANOVA |
|
|
|
|
|
|
|
|
|
| Df | SS | MS | F | Significance F |
|
|
|
| Regression | 25891.88784 | 5178.378 | 170.0361467 | 2.1289E-143 |
|
|
| |
| Residual | 1497 | 45590.48986 | 30.45457 |
|
|
|
|
|
| Total | 1502 | 71482.3777 |
|
|
|
|
|
|
|
|
|
|
|
|
|
|
|
|
|
| Coefficients | Standard Error | t Stat | P-value | Lower 95% | Upper 95% | Lower 95.0% | Upper 95.0% |
| Intercept | 126.8224555 | 0.623820253 | 203.2997 | 125.5988009 | 128.0461101 | 125.5988 | 128.0461 | |
| Frequency (Hz) | -0.0011169 | 4.7551E-05 | -23.4885 | 4.0652E-104 | -0.001210174 | -0.001023627 | -0.00121 | -0.00102 |
| Angle in Degrees | 0.047342353 | 0.037308069 | 1.268957 | 0.204653501 | -0.025839288 | 0.120523993 | -0.02584 | 0.120524 |
| Chord Length | -5.495318335 | 2.927962181 | -1.87684 | 0.060734309 | -11.23866234 | 0.248025671 | -11.2387 | 0.248026 |
| Velocity (Meters per Second) | 0.083239634 | 0.009300188 | 8.950317 | 1.02398E-18 | 0.064996851 | 0.101482417 | 0.064997 | 0.101482 |
| Displacement | -240.5059086 | 16.51902666 | -14.5593 | 5.20583E-45 | -272.9088041 | -208.103013 | -272.909 | -208.103 |
In this case, the multiple R-value indicates a positive relationship. However, this value cannot used definitively as there are numerous variables. The value of R squared equals to 0.36622, meaning that approximately 36% of the noise variability is explainable by the whole set of independent variables (chord length, displacement, velocity, angle and frequency). The ANOVA significance (F) value is equal to 2.1289E-143. The value is far lesser than the alpha level of 0.05, indicating that there is a statistically considerable relationship between the levels of the noise and the independent variables. Therefore, the null hypothesis is rejected and the null hypothesis has to be accepted. Therefore, the noise levels have a statistically considerable relationship with the chord length, displacement, velocity, angle and frequency.
The equation of the regression model can be represented as shown below:
y = 126.822 - 0.001X1 + 0.047X2 -5.495X3 + 0.083X4 - 240.506X5
Where:
Y is the Noise levels in Decibels
X1 is the frequency (Hz)
X2 is the Angle in degrees
X3 is the Chord Length in meters
X4 is the Velocity (m/s)
X5 is the Displacement
Independent Samples t-Test: Hypothesis Testing
Ho4: From the obtained results, there exists a statistically significant difference in the means of group A and Group B training scores as 9.664 (the t stat value) surpasses the 1.99 (the critical two-tail value).
Ha4: From the obtained results, there is no statistically significant difference in the mean values of Group A and Group B training scores.
| Column1 | Column2 | Column3 |
| t-Test: Two-Sample Assuming Unequal Variances | ||
|
| Variable 1 | Variable 2 |
| Mean | 69.79032258 | 84.77419355 |
| Variance | 122.004495 | 26.96456901 |
| Observations | 62 | 62 |
| Hypothesized Mean Difference | ||
| Df | 87 | |
| t Stat | -9.666557191 | |
| P(T<=t) one-tail | 9.69914E-16 | |
| t Critical one-tail | 1.662557349 | |
| P(T<=t) two-tail | 1.93983E-15 | |
| t Critical two-tail | 1.987608282 | |
From the results, it can also be seen that a P-value of 1.99 is higher than 0.05. Therefore, the null hypothesis has to be accepted, and there is no statistically significant difference in the mean values of Group A and Group B training scores (Bashir, 2018).
Dependent Samples (Paired Samples) t-Test
Ho4: There is no statistically significant difference in the means before exposure and after exposure of the workers as the t-stat value us 1.929803. The P-value is 0.5955, meaning the results are not significant as 0.05 is less than the P-value.
Ha4: There is a statistically significant difference in the means before exposure and after exposure of the workers
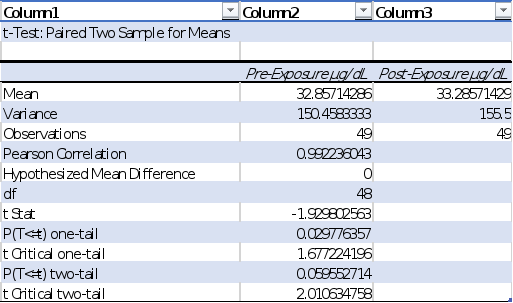
From the results, it is evident that the mean values before and after exposure of the employees have no significant differences as the P-value of 0.5955 is higher than 0.05. Therefore, the null hypothesis is rejected in this case due to lack of adequate evidence to show that there is no a statistically significant difference in the means before exposure and after exposure of the workers (Bashir, 2018).
ANOVA
Ho4: There is a statistically significant difference in the means of water, air, soil and training on the consulting project ROI. There is an F-ratio value of 11.9231, and the p-value is less than 0.00001. Thus, this makes the results significant as P is less than the alpha level of 0.05.
Ha4: All means are not equal for water, air, soil and training on the consulting project ROI.
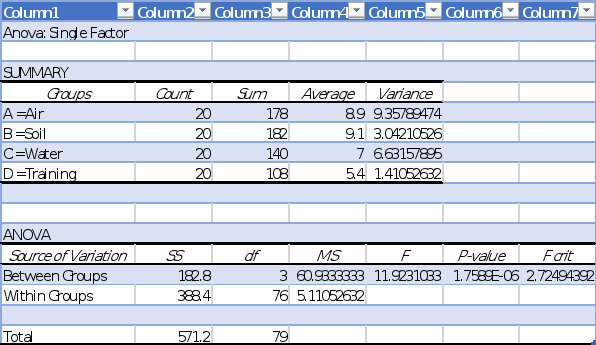
The results show that all the mean for soli, air, water and training were of significant difference, as there is a P value of 0.0001, which is higher than the alpha level of 0.05. Thus, the null hypothesis is accepted due to lack of adequate evidence to state that all four means are not statistically significant on the consulting project ROI (Su et al., 2017).
After applying quantitative analysis methods to the available data related to the six research objectives, there are clear indications as to the relationship between the variables in question for each. The following defines what each analysis means in the context of our research objectives.
RO1: Determine if there is a relationship between employee exposure to particulate matter <2.5 microns and the annual number of sick days used for health problems.
The results of the analysis indicate there is an increased number of annual sick days used when employees are exposed to particulate matter <2.5 microns.
RO2: Determine if there is a relationship between the number of safety training hours prior to beginning a project and the number of lost time hours during that project.
The results of the analysis indicate that there are fewer lost time hours when employees have more safety training.
RO3: Determine if there is a relationship between the measured sound variables and the ambient decibel level during operational hours.
The results of the analysis indicate there is a somewhat predictable increase in noise levels when some of the sound measured variables increase. Angle and chord were not useful in this prediction, making it an inefficient predictor.
RO4: Determine if there is a relationship between the number of lost time hours and the original version of new employee training (Group A) vs. the restructured new employee training (Group B).
The results of the analysis indicate a significant rise in training scores under the revised new employee training program. This shows the revised safety training to be more effective than the old version.
RO5: Determine if there is a relationship between the assignment of employees to a lead remediation project and the measurable blood lead levels of employees.
The results of the analysis show no significant increase in BLL after the lead remediation project. It is fairly certain that the current procedures for protecting against lead are preventing a rise in BLL.
RO6: Determine if there is a relationship between the type of company service rendered for a contract and the return on investment at the completion of said contract.
The results of the analysis indicate there are significant measurable differences between the amount of return on investment between the services the company offers.
RecommendationsWith the findings of the research being relatively conclusive due to the low margin of error in most of the analyses, there are several improvements that need to be made in order to keep Sun Coast competitive.
It has been shown that safety training reduces lost time hours and the updated training is more effective than the older version. In order to further improve, there should be a quality review of the various training programs and an investment made into improving them. Additionally, we should increase safety training hours by 10% for the contracts starting in the next year. At the conclusion of the contracts the analysis can be repeated to determine the cost-benefit and optimize the program.
Also, it is apparent that our PPE program is incomplete and should be updated. Based on the stability of blood lead levels, lead remediation procedures are preventing a rise in BLL but are not adequate. Many of the measured levels are above the OSHA permitted level and far above the current recommendations. The procedures and PPE for lead remediation need immediate review and updates. Better respirators are also needed to protect employees from fine particulate matter to improve health and reduce lost time. But what is needed for the hearing conservation program is actually better predictors of noise levels and until they can be identified the current method of supplying proper hearing protection should be maintained.
Finally, the end goal of our company is to make a profit and have stable growth. After finding significant variance in the ROI for the different services, there needs to be more research done to discover the cause. In the case that there are variations in safety costs for the different services, the problems need to be controlled. If not, there may need to be other parameters analyzed and investment made in the superior lines of service.
References
Afshinpour, S. (2014). Leadership Styles and Employee Satisfaction: A Correlation Study. International Letters Of Social And Humanistic Sciences, 27, 156-169. https://doi.org/10.18052/www.scipress.com/ilshs.27.156
Bashir, J. (2018). Hypothesis Testing. Scientific Journal Of India, 3(1), 62-63. https://doi.org/10.21276/24565644/2018.v3.i1.21
Bayram, M. (2019). Safety Training and Competence, Employee Participation and Involvement, Employee Satisfaction, and Safety Performance: An Empirical Study On Occupational Health And Safety Management System Implementing Manufacturing Firms. Alphanumeric Journal, 301-318. https://doi.org/10.17093/alphanumeric.555154
Bell, E., Bryman, A., & Harley, B. (2018). Business research methods. Oxford university press.
Booth, J. (2018). Analysis of Variance for Random Models: Theory, Methods, Applications, and Data Analysis, Vol. 1: Balanced Data, Analysis of Variance for Random Models: Theory, Methods, Applications, and Data Analysis, Vol. 2: Unbalanced Data. Journal Of The American Statistical Association, 101(475), 1310-1310. https://doi.org/10.1198/jasa.2006.s121
Creswell, J. W., & Creswell, J. D. (2017). Research design: Qualitative, quantitative, and mixed methods approaches. Sage publications.
Cook, B., & Cook, L. (2016). Research Designs and Special Education Research: Different Designs Address Different Questions. Learning Disabilities Research & Practice, 31(4), 190-198. https://doi.org/10.1111/ldrp.12110
Donkoh, S. (2017). The Scientific Method and the Growth of Scientific Knowledge. International Journal Of Innovative Research And Development, 6(11). https://doi.org/10.24940/ijird/2017/v6/i11/nov17059
George, D., & Mallery, P. (2016). Descriptive statistics. In IBM SPSS Statistics 23 Step by Step (pp. 126-134). Routledge.
Harwoodn, E., & Hutchinson, E. (2009). Data Collection Methods Series Part 5. Journal Of Wound, Ostomy And Continence Nursing, 36(5), 476-481. https://doi.org/10.1097/won.0b013e3181b35248
Keightley, E. (2010). Remembering research: memory and methodology in the social sciences. International Journal Of Social Research Methodology, 13(1), 55-70. https://doi.org/10.1080/13645570802605440
Ludbrook, J. (2010). Linear regression analysis for comparing two measurers or methods of measurement: But which regression?. Clinical And Experimental Pharmacology And Physiology, 37(7), 692-699. https://doi.org/10.1111/j.1440-1681.2010.05376.x
Meissner, G. (2015). It's All About Correlation. Wilmott, 2015(80), 30-37. https://doi.org/10.1002/wilm.10459
Shan, S., Li, C., Yao, W., Shi, J., & Ren, J. (2014). An Empirical Study on Critical Factors Affecting Employee Satisfaction. Systems Research And Behavioral Science, 31(3), 447- 460. https://doi.org/10.1002/sres.2284
Simonsohn, U., Simmons, J. P., & Nelson, L. D. (2019). Specification curve: Descriptive and inferential statistics on all reasonable specifications. Available at SSRN 2694998.
Su, Y., Di, C., & Hsu, L. (2017). Hypothesis testing in linear functional models. Biometrics, 73(2), 551-561. https://doi.org/10.1111/biom.12624
Tarlow, K. (2015). Teaching principles of inference with ANOVA. Teaching Statistics, 38(1), 16-21. https://doi.org/10.1111/test.12085
Yunus, E., & Ernawati, E. (2018). Productivity paradox? The impact of office redesign on employee productivity. International Journal Of Productivity And Performance Management, 67(9), 1918-1939. https://doi.org/10.1108/ijppm-12-2017-0350
Zwanenburg, G., Hoefsloot, H., Westerhuis, J., Jansen, J., & Smilde, A. (2011). ANOVA- principal component analysis and ANOVA-simultaneous component analysis: a comparison. Journal Of Chemometrics, 25(10), 561-567. https://doi.org/10.1002/cem.1400


