Find the attachment for last ASSAIGNMENTAssessment 4 Instructions: Presenting Data Analysis Results Effectively PRINT Create a 9-slide PowerPoint presentation that interprets four of the graphs from
Applying AnalyticATechniques to BusinessA
Capella University
07/26/2020a
Applying AnalyticATechniques to Business
IntroductionA
Data analysis is an essential tool in business because it models the progress of business activities. It reduces data into meaningful information that can be used to forecast the future of the organization. Data analysis plays a significant role in business, but the main ones include projections, boosting customer acquisition, and risk management. The purpose of this document is to apply data analytics on Tesla Inc., financial data obtained from the Yahoo Finance database, and interpretation of the analyzed data.
Tesla, Inc. was formally known as Tesla Motors, Inc. is an American e-vehicle and other alternative energy sources. The company is founded in Palo Alto, California, and its specialty area is the manufacturing of electric vehicles and reachable battery energy. The company was established through acquisition technic by acquiring Solar panels, solar roof tile, and SolarCity manufacturing. It was established in July 2003 by Marc Tarpernning and Martin Eberhard as Tesla Motors. It was named in commemoration of electrical and inventor engineer Nokia Tesla. The first three employees Eon Musk, J. B Straubel, and Ian Wright, all who were later named as co-founders of the organization. Musk, who was the former chairman, is the current Chief Executive Officer. He envisioned Tesla Motors as a Technological organization and a stand-alone automobile company; whose aim is to produce electric cars at affordable prices to the average consumers. The company shortened its name to Tesla, Inc. in February 2017 (Bilbeisi & Kesse, 2017).
The quarterly revenue for Tesla Inc. as of March 31, 2020, is US$5,985 Million, which is estimated to be slightly above US$24.58 Billion annually (Bilbeisi & Kesse, 2017). The total assets as of 2019 were recorded at US$34.309 Billion, and the total equity as of 2019 was determined to be US$6.618 Billion. The Largest Shareholder of the company is Elon Musk, who holds 20.8% of the revenue (Bilbeisi & Kesse, 2017). Moreover, the company employed 48,016 workers as of 2019, with 80% of these are permanent employees. Furthermore, the company has managed to produce several models of electric cars, including Model S, Model S, Model 3, and Model Y. Below is an interpretation of the analysis of Tesla's stock and sales between 7/18/2019 and 7/17/2020.
Graphical Representation of Data
Interpreting Scatter Plots

Figure 1. Scatterplot of the Highest Stock Price between 7/18/2019 and 7/17/2020 (Gafarov, 2019).
Figure 1 shows the trend in the highest stock prices of Tesla Inc. from July 18, 2019, to July 17. 2020. The graph describes the relationship between the dependent variable-highest stock price and the independent variable-time. The scatterplot is non-linear, meaning that there is a weak positive relationship between the highest stock price and time (the rate of change between the cost and time is irregular). The highest stock price for Tesla was realized towards June 2020. The data seems to be clean as there are no outliers because all points fall in the line.
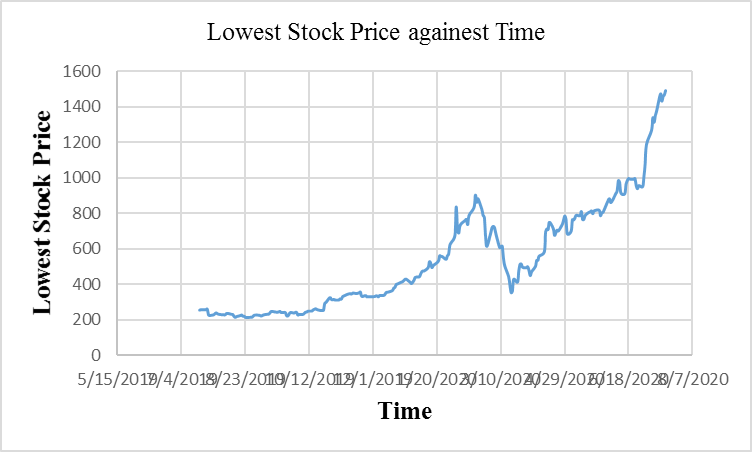
Figure 2. Scatterplot of the Lowest Stock Price between 7/18/2019 and 7/17/2020 (Gafarov, 2019).
Figure 2 shows the trend in the lowest stock price of Tesla Inc. from July 18, 2019, to July 17, 2020. The graph describes the relationship between the dependent variable-Lowest Stock Price and the independent variable-Time. The scatterplot is non-linear, meaning that there is a moderate positive relationship between the lowest stock price and time. The smallest stock price keeps on increasing from July 18, 2019, to July 17, 2020, with some drops between October 20, 2019, and December 18, 2019. There are noaoutliers in the data because all the plotted points are on the graph.
Interpreting Histogram
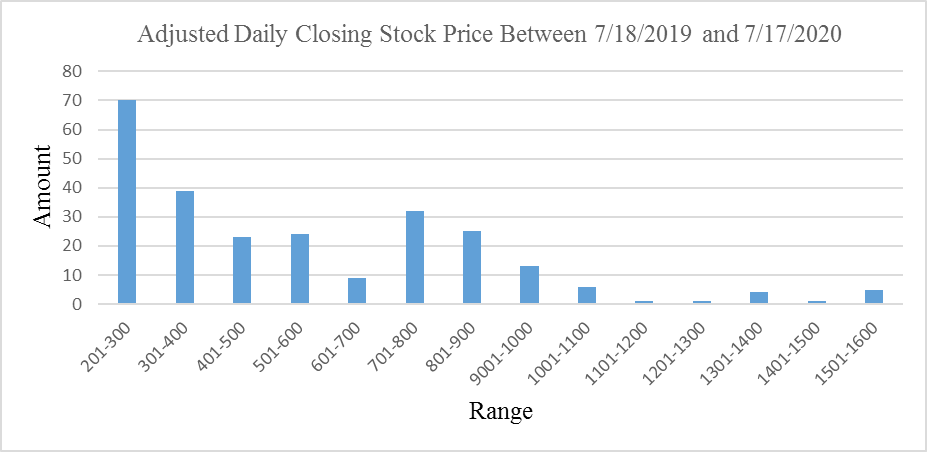
Figure 3. Bar graph of the Adjusted Daily Closing Stock Price 7/18/2019 and 7/17/2020 (Huang, 2019, February).
The figure depicts the number of occurrences of daily adjusted closing stock prices that fall between fairly distributed continuous data rages (binned histogram). The number of incidents of equally distributed data for the everyday fixed closing stock prices on the constant data range is represented by the dependent variable, while the independent variable represents the range of continuously distributed data. The histogram is skewed to the right (positive skewness), meaning that the mean is higher than the median and thus volatility in the adjusted closing stock prices of Tesla Inc.

Figure 4. Stock Trading Volume between 7/18/2019 and 7/17/2020 (Huang, 2019, February).
The figure depicts the number of occurrences of the stock trading volumes that fall between fairly distributed continuous data rages (binned histogram). The number of incidents of equally distributed data for the stock trading volume on the constant data range is represented by the dependent variable, while the independent variable represents the range of continuously distributed data. The histogram is skewed to the right (positive skewness), meaning that the mean is higher than the median and thus volatility in the adjusted closing stock prices of the Tesla company.
Descriptive Statistics
Table 1.
Descriptive Statistics for the Adjusted Daily Closing Stock Price between 7/18/2019 and 7/17/2020
| Column1 | |
| Mean | 551.8642305 |
| Standard Error | 19.81150916 |
| Median | 469.059998 |
| Mode | #N/A |
| Standard Deviation | 315.1213441 |
| Sample Variance | 99301.46153 |
| Kurtosis | 0.709074562 |
| Skewness | 1.021364902 |
| Range | 1334.610016 |
| Minimum | 211.399994 |
| Maximum | 1546.01001 |
| Sum | 139621.6503 |
| Count | 253 |
| Confidence Level (95.0%) | 39.01722924 |
The mean of Tesla's adjusted daily closing stock prices is US$551.8642305, and this indicates that Tesla is doing well in the market. The way also shows that the company's revenue has stable growth, and the company is continuously making a profit throughout the year. The median for Tesla's adjusted daily closing stock prices is US$469.059998, which is less than the mean, meaning that there is an asymmetry in the distribution of values for adjusted daily closing stock prices. The average deviation for the fixed every day closing stock prices is US $315.1213441; hence volatility of 5.998% therefore shows minimal to low risk of purchasing Tesla's shares.
Table 2.
Descriptive Statistics for the Stock Volume between 7/18/2019 and 7/17/2020
| Column1 | |
| Mean | 13413402.37 |
| Standard Error | 526530.6515 |
| Median | 11698100 |
| Mode | #N/A |
| Standard Deviation | 8374982.707 |
| Sample Variance | 7.01403E+13 |
| Kurtosis | 5.50164049 |
| Skewness | 1.820742724 |
| Range | 58473200 |
| Minimum | 2465600 |
| Maximum | 60938800 |
| Sum | 3393590800 |
| Count | 253 |
| Confidence Level (95.0%) | 1036961.241 |
The mean of Tesla's daily traded stock volume is US$13413402.37, and this shows high liquidity of the company's stock indicates that Tesla is doing well in the market. The median for Tesla's daily traded stock volume is US$11698100, which is less than the mean, and this means that there was the presence of the outliers, and thus, the company has potential spikes in its daily tradable stock volume. The standard deviation for the daily traded stock volume is US$8,374,982.707, which is equivalent to 62.44% of the mean for stock volume and hence high volatility in the data set. This displays that there is a lack of consistency in the amount of Tesla's stock.
Conclusion
In conclusion, the statistical calculations and graphical representation of the stock history of Tesla provide meaningful insight that assists the management in making decisions when introducing new products in the market and for the global expansion of the company. There are some useful trends in which the company leaders must be aware of and these includes;
The volatility of 62.44% of the daily traded stock volume indicates a high level of fear of unknowns in the exchange rates of Tesla's stock. This leads to an unexpected company's earnings and a ruined image of the firm.
Despite an increase in the lowest and highest stock prices for the second and the third quarter, the fourth quarter has slackened falls and recoveries in both the most economical and the highest stock prices.
Over ¼ of the adjusted daily closing stock prices are contained in the range of 201 – 300.
Having sufficient knowledge in the trend of stock prices assists management in introducing products in the market or improving the offerings in the current and future time and thus would help in pushing the sales. The net result of this is a further increase in revenues and profit margins during the third and fourth quarters. For the adjusted daily closing stock prices, it can be read from the histogram that most of the data is contained in the rage of 2001 – 300 U.S dollars with high daily stock volume. This motivates the management to dare increase the stock prices and thus foster demand for the stock. The net effect of this is the increase in the economy's market capitalization.
For the lowest and highest daily stock prices, it is indicated from their respective scatterplots that there is a positive correlation between stock value and time. This is useful because it could assist the management in knowing the effect of the appreciated growth of the company's revenue in 2020 as compared with 2019.
References
Bilbeisi, K. M., & Kesse, M. (2017). Tesla: A successfulaentrepreneurship strategy. Morrow, GA: Clayton State University.
Gafarov, R. (2019). Evaluation of the financialaposition and the performance of Tesla, Inc (Doctoral dissertation, Masarykova univerzita, aEkonomicko-správní fakulta).
Huang, Y. (2019, February). A Potential Company orsNot: the Analysis of Tesla. In 2019 4th International Conference on FinancialcInnovation and Economic Development (ICFIED 2019). Atlantis Press.


