Assignment (Misleading Data)Misleading Data Project Directions: Explain why you think the data visualizations could be misleading. There are four prompts (data visualizations). Each prompt should be a
Name
Program
University
Course Title
Misleading Data Project
Directions:
Explain why you think the data visualizations could be misleading. There are four prompts (data visualizations). Each prompt should be addressed in a minimum of 200 words. Citations are not required for this assignment but be sure to include as much detail as possible to illustrate your thinking.
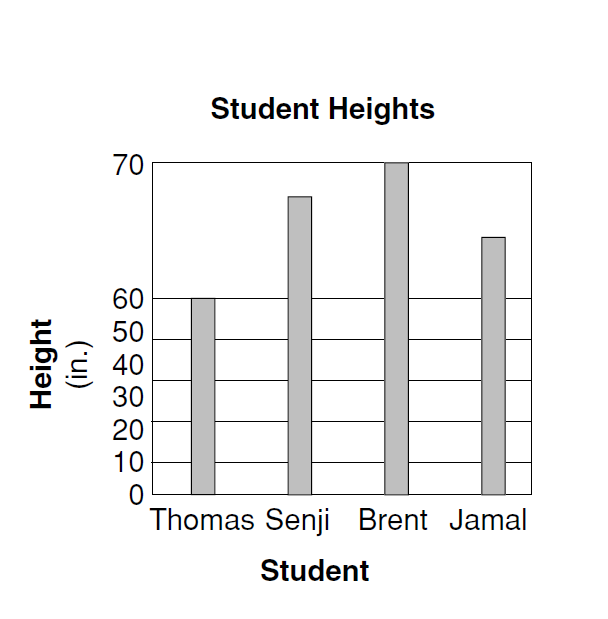
Prompt #1
Type your answer to the prompt #1 in the box below.
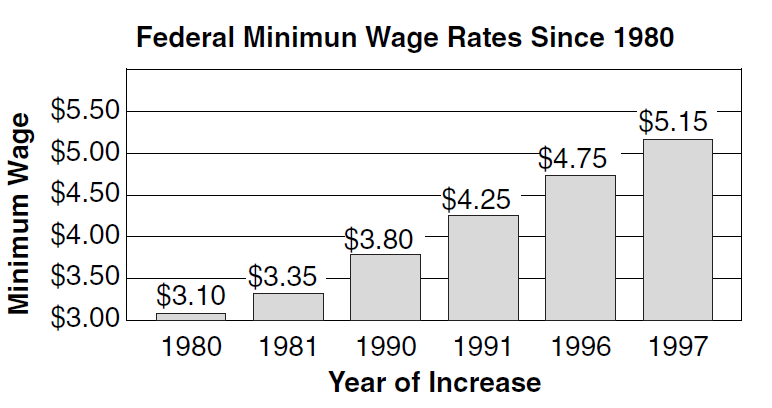
Prompt #2
***Note these are the same graphs but you need to focus your analysis on the months of Jun, Jul and Aug. Use the second graph to support your stance *hint*

Type your answer to the prompt #1 in the box below.
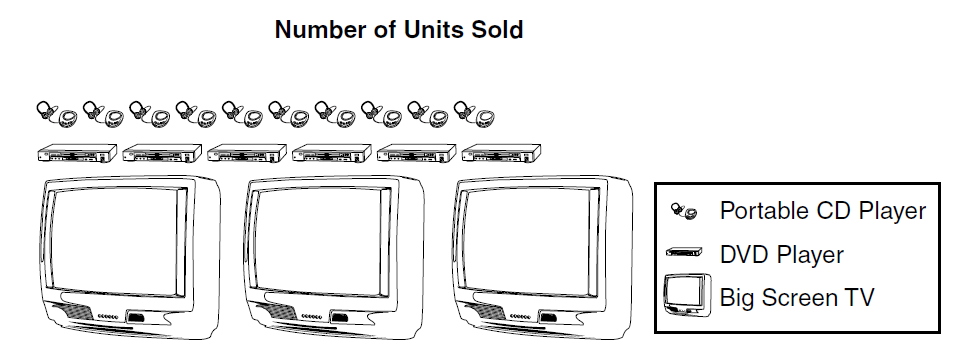
Prompt #3
Type your answer to the prompt #1 in the box below.
Prompt # 4
Type your answer to the prompt #1 in the box below.


