Please complete the worksheet attached below. Thanks!
Crabs and Snails (9 pts)
In a previous exercise we learned about the periwinkle that lives in the intertidal zone in New England. Among this snail's predators is the European green crab. Before 1900, the green crab did not occur north of Cape Cod (MA). After the turn of the century, however, the crab expanded its range northward, and is now found as far north as Nova Scotia. Biologist Robin Seeley considered the relationship between snail shell thickness and the presence/absence of green crabs.
She conducted the following experiment:
Experiment. In the field, Seeley drilled small holes in the shells of a number of snails and used fishing line to tether the snails to seaweeds in the intertidal zone. She returned every few days to see which snails survived. This method allowed Seeley to distinguish between snails that were killed by crabs. She tethered the snails in pairs, with each pair including one thin-shelled snail and one thick-shelled snail. She tethered 15 pairs at Timber Cove where crabs appear absent, 15 pairs at Sipp Bay where crabs are present but rare; and 15 pairs at Gleason Point where crabs are common. She checked on the snails after 6, 9 and 16 days. Her data are presented in Table 1. Written answers must be in complete sentences and grammatically correct. This is due Wednesday by 3PM.
Considering the experiment Robin Seeley did, suggest a hypothesis to explain how populations of periwinkles might respond to predation by green crabs.
What is the independent variable?
What is the dependent variable?
What is a possible controlled variable not stated in the question?
| Table 1: Survival of thin & thick-shelled snails after 16 days tethered in habitats with no (Timber Cove), few (Sipp Bay) and many (Gleason Point) green crabs | |||
|
| Gleason Point (many crabs) | Sipp Bay (few crabs) | Timber Cove (no crabs) |
| % thick-shell surviving | 65 | 80 | 100 |
| % thin-shell surviving | 25 | 40 | 100 |
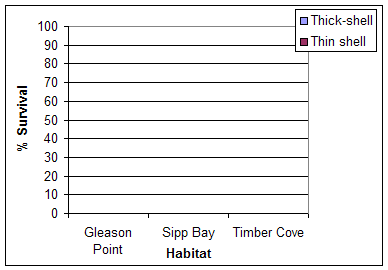
Prepare a histogram of these data below and upload a picture of this to Canvas.

What is an appropriate figure legend for this figure?
What does this pattern suggest about predation by green crabs on shell thickness?


