R program
| CONFIDENTIAL | CS/JAN 2021/STA705 |
| |
| | ||
| UNIVERSITI TEKNOLOGI MARA REVISION | ||||

| COURSE | : | STATISTICAL COMPUTING |
| COURSE CODE | : | STA705 |
| EXAMINATION | : | |
| TIME | : | |
INSTRUCTIONS TO CANDIDATES
| 1. | Answer ALL questions. | |
| 2. | Do not bring any material into the examination room unless permission is given by the invigilator. | |
| 3. | Please check to make sure that this examination pack consists of : | |
| | the Question Paper | |
| | a one blank A4 paper | |
| 4. | Answer ALL questions in English. | |
| DO NOT TURN THIS PAGE UNTIL YOU ARE TOLD TO DO SO |
This examination paper consists of 11 printed pages
QUESTION 1
Use the suitable command, produce the following output:
> DD
$DF
1 S 20 1
2 S 23 2
3 S 55 3
4 S 61 4
5 T 20 5
6 T 23 6
7 T 55 7
8 T 61 8
9 U 20 9
10 U 23 10
11 U 55 11
12 U 61 12
13 V 20 13
14 V 23 14
15 V 55 15
16 V 61 16
$DT
x y w
1: S 20 1
2: S 23 2
3: S 55 3
4: S 61 4
5: T 20 5
6: T 23 6
7: T 55 7
8: T 61 8
9: U 20 1
10: U 23 2
11: U 55 3
12: U 61 4
13: V 20 5
14: V 23 6
15: V 55 7
16: V 61 8
(8 marks)
Based on the output in part (a), write a suitable R command to produce the following:
> DFx
x y w xx
1 S 20 1 Group 1
2 S 23 2 Group 1
3 S 55 3 Group 1
4 S 61 4 Group 1
5 T 20 5 Group 1
6 T 23 6 Group 1
7 T 55 7 Group 1
8 T 61 8 Group 1
9 U 20 9 Group 1
10 U 23 10 Group 1
11 U 55 11 Group 2
12 U 61 12 Group 2
13 V 20 13 Group 2
14 V 23 14 Group 2
15 V 55 15 Group 2
16 V 61 16 Group 2
> str(DFx)
'data.frame': 16 obs. of 4 variables:
$ x : Factor w/ 4 levels "S","T","U","V": 1 1 1 1 2 2 2 2 3 3 ...
$ y : num 20 23 55 61 20 23 55 61 20 23 ...
$ w : int 1 2 3 4 5 6 7 8 9 10 ...
$ xx: Factor w/ 2 levels "Group 1","Group 2": 1 1 1 1 1 1 1 1 1 1 ...
(5 marks)
Write the R commands to produce each of the following plots:
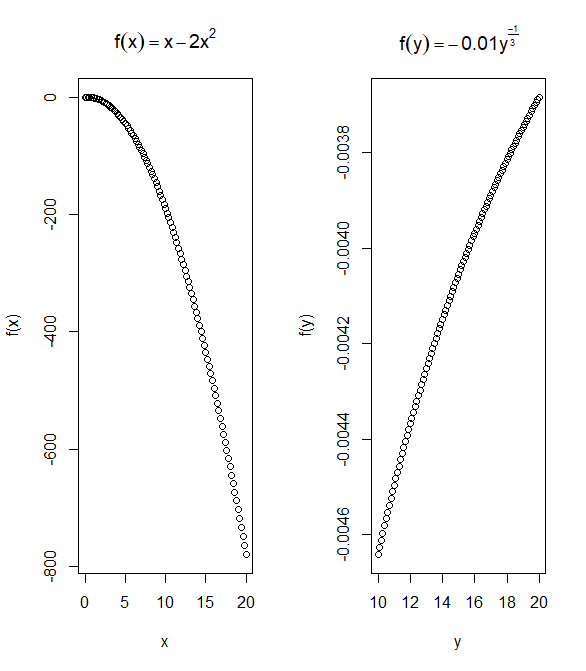
(6 marks)
QUESTION 2
Using generate factor levels, produce the R command of the following outputs:
> data.1
Length Supplement Dose
1 Short Orange Juice 0.5mg/day
2 Short Orange Juice 0.5mg/day
3 Short Orange Juice 0.5mg/day
4 Short Orange Juice 1mg/day
5 Medium Orange Juice 1mg/day
6 Medium Orange Juice 1mg/day
7 Medium Vit C 1.5mg/day
8 Medium Vit C 1.5mg/day
9 Long Vit C 1.5mg/day
10 Long Vit C 2mg/day
11 Long Vit C 2mg/day
12 Long Vit C 2mg/day
(9 marks)
Referring data.1 in part (a), write the R command to produce the following output.
> data.2
Dose 0.5mg/day 1mg/day 1.5mg/day 2mg/day
Supplement Length
Orange Juice Short 3 1 0 0
Medium 0 2 0 0
Long 0 0 0 0
Vit C Short 0 0 0 0
Medium 0 0 2 0
Long 0 0 1 3
QUESTION 3
Let
 and
and  be independent. Write the R command to produce the following dataset which is generated by convolutions
  using set seed 100.
> W
[,1] [,2] [,3] [,4] [,5]
[1,] 0.495 0.440 0.550 0.792 0.396
[2,] 0.347 0.837 0.418 0.505 0.892
[3,] 0.456 0.723 0.744 0.314 0.885
[4,] 0.619 0.355 0.728 0.418 0.541
[5,] 0.573 0.507 0.497 0.573 0.390
[6,] 0.901 0.423 0.337 0.509 1.113
(8 marks)
b) Produce the following output based on the data obtained in part (a).
> xx1
[,1] [,2] [,3]
[1,] 0.440 0.792 0.396
[2,] 0.723 0.314 0.885
[3,] 0.507 0.573 0.390
[4,] 0.423 0.509 NA
(5 marks)
By using the above data (xx1), write a suitable R commands to replace NA with 0.888.
(2 marks)
QUESTION 4
The information on the “mtcars” dataset obtained from the R system is given as follows:
> str(mtcars)
'data.frame': 32 obs. of 11 variables:
$ mpg : num 21 21 22.8 21.4 18.7 18.1 14.3 24.4 22.8 19.2 ...
$ cyl : num 6 6 4 6 8 6 8 4 4 6 ...
$ disp: num 160 160 108 258 360 ...
$ hp : num 110 110 93 110 175 105 245 62 95 123 ...
$ drat: num 3.9 3.9 3.85 3.08 3.15 2.76 3.21 3.69 3.92 3.92 ...
$ wt : num 2.62 2.88 2.32 3.21 3.44 ...
$ qsec: num 16.5 17 18.6 19.4 17 ...
$ vs : num 0 0 1 1 0 1 0 1 1 1 ...
$ am : num 1 1 1 0 0 0 0 0 0 0 ...
$ gear: num 4 4 4 3 3 3 3 4 4 4 ...
$ carb: num 4 4 1 1 2 1 4 2 2 4 ...
Write the appropriate R command to produce the following outputs:
Output 1:
mpg cyl disp hp drat wt qsec vs am gear carb
Mazda RX4 21.0 6 160 110 3.90 2.620 16.46 0 1 4 4
Mazda RX4 Wag 21.0 6 160 110 3.90 2.875 17.02 0 1 4 4
Datsun 710 22.8 4 108 93 3.85 2.320 18.61 1 1 4 1
Hornet 4 Drive 21.4 6 258 110 3.08 3.215 19.44 1 0 3 1
Hornet Sportabout 18.7 8 360 175 3.15 3.440 17.02 0 0 3 2
Valiant 18.1 6 225 105 2.76 3.460 20.22 1 0 3 1
(2 marks)
Output 2:
mpg disp wt qsec
Min. :10.40 Min. : 71.1 Min. :1.513 Min. :14.50
1st Qu.:15.43 1st Qu.:120.8 1st Qu.:2.581 1st Qu.:16.89
Median :19.20 Median :196.3 Median :3.325 Median :17.71
Mean :20.09 Mean :230.7 Mean :3.217 Mean :17.85
3rd Qu.:22.80 3rd Qu.:326.0 3rd Qu.:3.610 3rd Qu.:18.90
Max. :33.90 Max. :472.0 Max. :5.424 Max. :22.90
(2 marks)
Output 4:
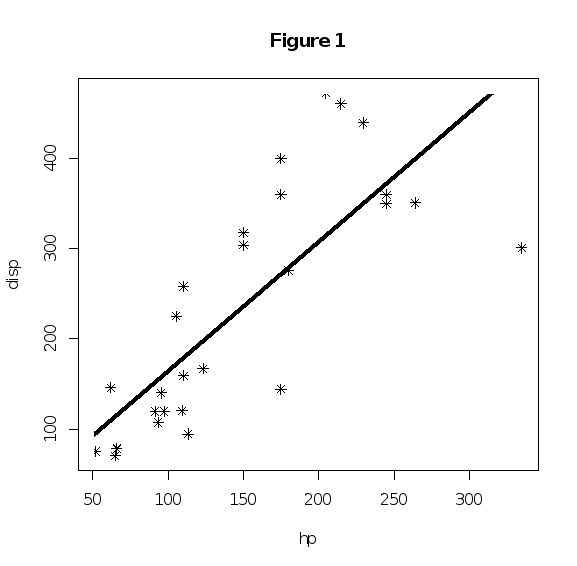
(7 marks)
Output 5:
Df Sum Sq Mean Sq F value Pr(>F)
disp 1 808.9 808.9 115.873 1.85e-11 ***
wt 1 70.5 70.5 10.096 0.00361 **
qsec 1 51.2 51.2 7.337 0.01139 *
Residuals 28 195.5 7.0
---
Signif. codes: 0 ‘***’ 0.001 ‘**’ 0.01 ‘*’ 0.05 ‘.’ 0.1 ‘ ’ 1
(5 marks)
Output 6:
Start: AIC=65.91
mpg ~ disp + wt + qsec
Df Sum of Sq RSS AIC
- disp 1 0.001 195.46 63.908
<none> 195.46 65.908
- qsec 1 51.220 246.68 71.356
- wt 1 118.074 313.54 79.030
Step: AIC=63.91
mpg ~ wt + qsec
Df Sum of Sq RSS AIC
<none> 195.46 63.908
- qsec 1 82.86 278.32 73.217
- wt 1 733.19 928.66 111.776
Call:
lm(formula = mpg ~ wt + qsec, data = mtcars)
Coefficients:
(Intercept) wt qsec
19.7462 -5.0480 0.9292
(2 marks)
Given the information that the correlation between the variables mpg and drat is 0.6812, determine the correct input of A, B, XXX and the value of YYY, and hence, write the R command to produce the output 6.
Output 6:
cor.1=function(x,i){round(cor(x[i,A],x[i,B]),4)}
|
|
ORDINARY NONPARAMETRIC BOOTSTRAP
Call:
boot(data = mtcars, statistic = XXX, R = 3000)
Bootstrap Statistics :
original bias std. error
t1* YYY -0.002777667 0.0866096
(6 marks)
END OF QUESTION PAPER


