1. The Target behavior in this will be Anxiety how to track it can just be made up based off as well as the data 2. The depression data scale in the guidelines is an example of how to track data disr
SSWG8205 Evaluation of Practice: Clinical
Hypothetical Single Subject Design
Hypothetical Paper #1
PURPOSE: The purpose of this assignment is to provide you with the opportunity to apply single system design evaluations to a practice situation; first hypothetically, then in vivo.
DUE DATE: This assignment is due Session 5: Application Paper #1 is due on Session 5 before the start of class.
Please submit your paper to the blackboard assignment page. This assignment is worth 10 percentage points of your final grade.
DIRECTIONS: Before you start writing your paper, please follow the steps below to develop your plan for assessment and evaluation of the target behavior, selection of an evidence based intervention and generation and analysis of data.
Step 1: Selection of Target Behavior
Identify one of goals that lends itself well to single subject design; that is a goal that is concrete, countable, clear, occurs frequently or severely enough to have room for change.
Step 2: Establishing a baseline
Think through how you can collect a baseline of the target for change. What is the behavior or emotion? Go from concept to specific name to precise operational definition. How will it be measured and recorded? Who will collect the baseline data? How, when? For how long? Concurrent or retrospective? Think through what will work best and why.
Step 3: Selecting and implementing an intervention
Specify what you understand is an evidence based approach to this behavior. This should be a condensed effort at locating at least one source that specifies what has been known to work well to reduce or increase the target behavior or emotion. Hypothesize how you would implement this intervention with your client and what the research says as well as other reasons (client motivation, literacy, comfort level, therapist experience/training) that you think this is an approach that has best potential for being effective in this situation.
Step 4: Collecting intervention phase or post-intervention phase data.
Decide when you will collect your intervention phase data (do you expect behavior to change immediately or only once treatment is completed?). Match the intervention phase data collection process with the baseline data collection process. Same operational definition, same person collecting under same circumstances.
Step 5: Graphing and analyzing data
Create your raw data:
| Time period | Tuesday | Wednesday
| Thursday | Friday | Saturday | Sunday | |||||||||
| Response to triggers | trig | + res | trig | + res | trig | + res | trig | res | trig | res | trig | res | |||
| Baseline Totals | × × × × × × × × × × 10 | | × × × × × × × × × × 10 | | × × × × × × × × × × 10 | | × × × × × × × × × × 10 | | × × × × × × × × × × 10 | | × × × × × × × × × × 10 | | |||
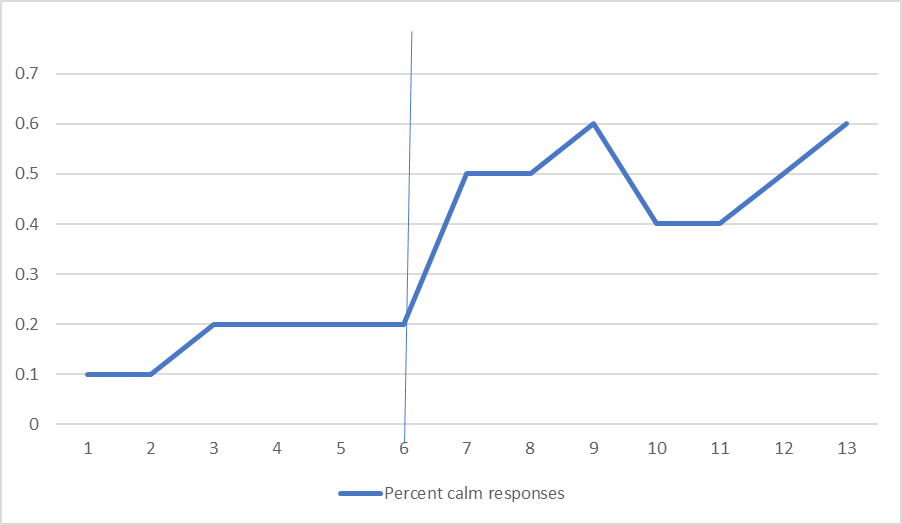
| Percent calm responses | 1/10 = .1 | 1/10 = .1
| 2/10=.2 | 2/10=.2 | 2/10=.2 | 1/10 = .1 | |||||||||
| Monday | Tuesday | Wedn | Thursday | Friday | Saturday | Sunday | |||||||||
| Intervention Totals | × × × × × ×
|
| × × × × × ×
|
| × × × × × |
| × × × × × |
| × × × × × |
| × × × × |
| × × × × × 5 |
| |
| Percent calm responses | 3/6=.50 | 3/6=.50 | 3/5=.60 | 2/5= 0.4 | 2/5=.40 | 2/4=.50 | 3/5=.60 | ||||||||
Graph your baseline and intervention data. Percent Calm Response Before and During Intervention
A phase (Baseline) B phase (Intervention)
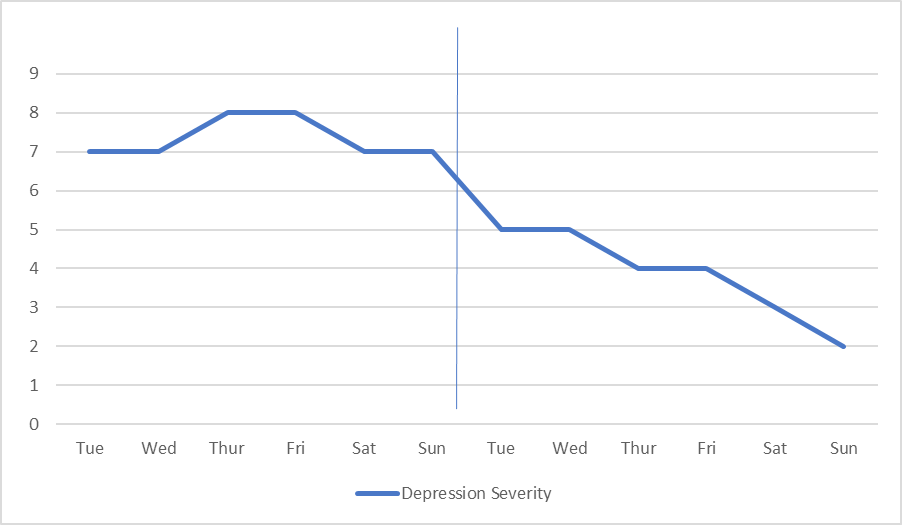
| Depression severity Day of week | Rating of depression from (1 not depress sed) to (10 most depressed) |
| Baseline phase: Tuesday | |
| Wednesday | |
| Thursday | |
| Friday | |
| Saturday | |
| Sunday | |
| Intrevention phase: Tuesday | |
| Wednesday | |
| Thursday | |
| Friday | |
| Saturday | |
| Sunday |
Visual Analysis
What is trend of baseline? What is trend of intervention phase? Is the trend going up, down or stable between baseline and intervention? Are points all higher or lower in one phase compared to the other? Does it look like there is systematic change?
Statistical Analysis
Two Band Standard Deviation method of statistical significance: Calculate the mean and standard deviation for the baseline period. Multiply the baseline standard deviation times two and add to (if the goal is to increase the behavior) or subtract from (if the goal is to decrease the behavior) the baseline mean to determine your “test statistic”. Go to the intervention phase of the graph and count the number of data points during intervention that were above (if goal is to increase) or below (if goal is to decrease) the test statistic. If there are two or more points that meet this criterion, then you have reached statistical significance.
Clinical Significance:
Has the change in behavior met some criterion that has made a difference in client’s life? OR Has the change in behavior increased quality of life for client or client’s family? Is there less conflict or stress that is making a difference?
NOW YOU ARE READY TO WRITE YOUR PAPER:
See outline next page.
OUTLINE FOR HYPOTHETICAL PAPER (SSD) ONE:
Introduction: Identify what you want to evaluate using Single Subject Design.
What treatment variable would be most appropriate to measure using a single subject design? Name it and provide rationale for selection.
Operationalize the variable and describe how you would measure it for the baseline.
Intervention
Discuss what you have found in your limited review for an evidenced based approach to this presenting problem.
Describe what you are selecting as having best potential to be effective in this situation. Provide rationale.
c. Describe how you would implement the intervention
Describe when and how you will collect intervention phase data.
Data Presentation and Analysis
Insert graph
Present visual analysis
Present statistical analysis
Discuss clinical significance.
Conclusions
Limitations of design and data collection
Inferences based on findings
Next steps if you were still working with client in light of these hypothetical results
Rubric for Grading Single Subject Design
| 10 F | 12 | 14 C- | 15 | 16 B- | 17 | 17.5 B+ | 18 A- | 19 | 20 A+ | |
| Selecting and measuring target behavior | ||||||||||
| Selection and plan for implementing intervention | ||||||||||
| Data Analysis and presentation of results | ||||||||||
| Identification of limitations, quality of conclusions and next steps. | ||||||||||
| Organization and Mechanics of writing | ||||||||||
| Paper Grade | Total Score | Percentage | Letter Grade |
___/10 |
8


