Need an expert in Genetics to help me with my population genetics course assignment. The assignment documents has been attached with 3 questions. Also, a few other documents about sample calculations
Population Genetics Assignment
Worth 30 points
1) A population conforms to the assumptions of the idealized Wright-Fisher model except that N fluctuates, each generation i. The populations starts at N0 = 1000 and F0 = 0. Values of N1, N2, N3 and N4 are 100, 1000, 10, and 1000 respectively for the next four generations. (HINT – review slides 15 and 16 in the lecture slides: “PopGenLecture_EvolutionaryForces.pdf” (10 points total)
a) Calculate the expected homozygosity in the 5th generation , i.e. F5, by calculating Fi for each preceding generation and then for F5 :
b) Calculate the effective population size and use this to calculate F5 (i.e. a different way from in a) and then compare your answer to the answer in a)
c) BONUS QUESTION: Assume a population with constant number of breeding individuals but having 1/10th the number of breeding males as the number of breeding females. Given that the population shows the same rate of decay in heterozygosity as the the population in a) and b), calculate the number of breeding males and females in this population. (2 points).
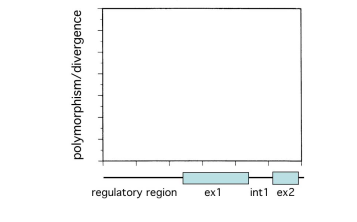
2) You’ve sequenced multiple alleles at the ALDH (aldehyde dehydrogenase) gene region from human populations from northern and southern Europe. Two nucleotide variants are potentially interesting, an insertion/deletion (INDEL) event in the 5’ regulatory region and an allozyme mobility variant (Fast/Slow – F/S) in the coding region. Both mutations appear to affect the activity of ALDH. You plot Fst between northern and southern populations for segregating DNA variants in the gene region. (10 points total)

a) Does this information support, refute, or shed no light on whether balancing selection has acted on the two candidate mutations?
b) An allele of ALDH has been sequenced in macaque. In the graph below, plot the expected ratios of the numbers of segregating silent (neutral) mutations (in humans) to the numbers of fixed differences (selected sites) between humans and macaque under a scenario of balancing selection in the human population. Hint so you are graphing the ratio of neutral:selected sites across the gene region.
C) Explain your reasoning for the plots above.
| 3) Given the following data: Genotype | |||||
| AA | Aa | aa | |||
| Population 1 | 67 | 115 | 77 | ||
| Population 2 | 60 | 300 | 220 | ||
| Population 3 | 90 | 55 | 35 | ||
Calculate the inbreeding coefficient (F) in each of the three populations and then the F-statistics FIS and FST averaged overall three subpopulations
Do any of the populations have more or fewer heterozygotes than expected? Is there evidence of population subdivision?
c) What evolutionary forces could cause potential deviations in the inbreeding coefficient (F) or population subdivision?


