I need answers to these
1. 20 points. Find the misconceptions. From the list, identify every mistaken idea about genetics, evolution, and ecology.
| Idea | Misconception? (“Yes” means the idea is wrong.) |
| |
| |
| |
| |
| |
| |
| |
| |
| |
|
For two misconceptions of your choice, explain briefly why they are misconceived. There are at least two misconceptions; there may be more, but you only have to explain why two are wrong.
2. 10 points. Answer EITHER “a” or “b.” (“b” is on the next page.)
(a) Clarkia xantiana ssp. xantiana is polymorphic for petal-spot phenotype in nature. Populations contain an average of 70% of plants with petal spots surrounded by white rings (S + R phenotype, below) and 30% of plants with unspotted petals (U phenotype, below). In one population (“Sawmill Road West,” SRW) I found a very rare morph with petal spots but no rings (S phenotype below). In the greenhouse, seeds from “U” plants from SRW all had the S + R phenotype when they flowered, but when I self-fertilized their offspring, all three morphs appeared in the progenies. I self-fertilized several of these plants, and following table contains the phenotype frequencies in some of those self-fertilized progeny. There are two other things you should know. (i) The expression of spots depends not only on genotype but on light intensity. In the greenhouse, some plants that would have spotted petals in natural sunlight do not produce them. (ii) White rings never appear on their own; they only occur on spotted petals. (If they did occur alone, I guess they would be white patches, not rings. It’s a moot point, because it doesn’t happen.)
|
|
|


Propose and test (with chi-square goodness-of-fit analysis) simple genetic hypotheses for (i) the inheritance of petal spots and (ii) the inheritance of white rings. It’s OK if you’re hypotheses seem wrong, in the end, but they should be reasonable and tested correctly. Show your work.
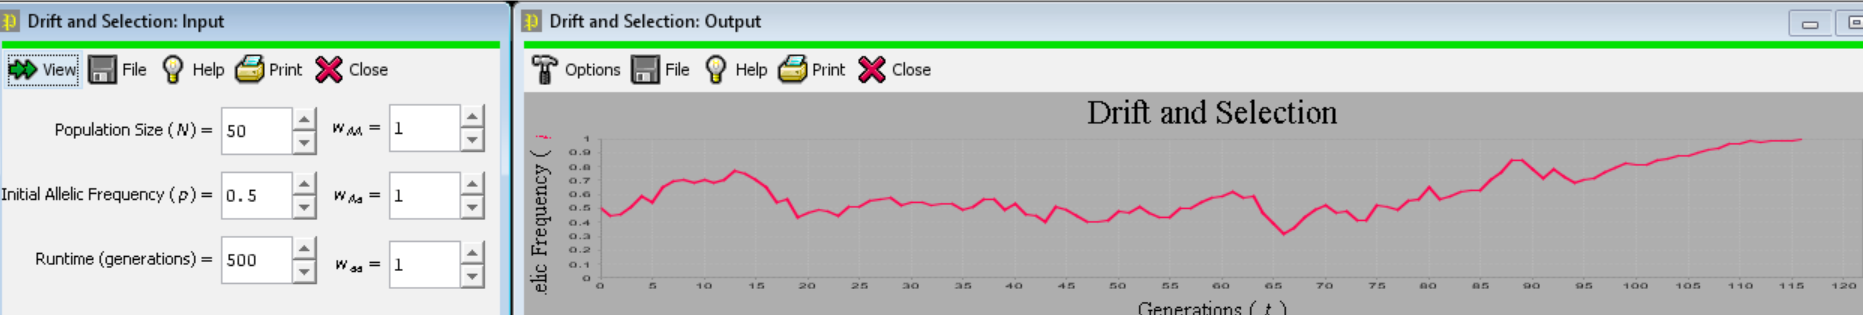
(b) Perform a simulation experiment with the “Drift and Selection” model in Populus. Set genotypic fitnesses and select an initial allele frequency to create a population in which selection favors an initially rare (frequency < 0.05), recessive allele. Pick a runtime of 500 generations. In an infinite population, selection would, as you know, eventually drive that favorable recessive allele to fixation, 100% of the time. What happens in smaller populations?
Address this question by selecting three initial population sizes as treatments. Replicate each population size “treatment” 50 times, by repeatedly pressing the “view” button and recording the outcome (loss of the favorable allele OR persistence of the allele for the full 500 generations). Use a chi-square analysis of goodness-of-fit to test the hypothesis that frequency of persistence of the favorable allele varies with population size.
<Notice (below) that setting all three genotypes’ fitnesses to 1.0 simulates drift alone, without selection. Fun!>
4. (10 points). Obtain the “Clarkia bees” data file from Blackboard. These data represent a sample of >1400 individual bees collected while collecting pollen or nectar on Clarkia xantiana ssp. xantiana flowers. A bee expert identified each individual to species (either a known species or at least a distinguishable species—possibly new to science!). Using Minitab, make a rank abundance diagram of this bee community, adding a caption.


