Strategic Management - Please use 1½ line spacing with 12-point fonts. 1 - Case - Trader Joe’s: One page summary on Trader Joe’s unique positioning and business model in the market. 2 - Case - Waymo:
![]()

W16885
CERVUS EQUIPMENT CORPORATION: DIVERSIFIED GROWTH IN TRUCKING

Daniel J. Doiron and Davis Schryer wrote this case solely to provide material for class discussion. The authors do not intend to illustrate either effective or ineffective handling of a managerial situation. The authors may have disguised certain names and other identifying information to protect confidentiality.
This publication may not be transmitted, photocopied, digitized, or otherwise reproduced in any form or by any means without the permission of the copyright holder. Reproduction of this material is not covered under authorization by any reproduction rights organization. To order copies or request permission to reproduce materials, contact Ivey Publishing, Ivey Business School, Western University, London, Ontario, Canada, N6G 0N1; (t) 519.661.3208; (e) [email protected]; www.iveycases.com.
Copyright © 2016, Richard Ivey School of Business Foundation Version: 2016-12-23

“That was an interesting board discussion,” thought John Higgins as he quickly made his way to the airport to catch his overnight flight to Toronto. As vice president of transport for Cervus Equipment Corporation (Cervus), the major Canadian dealer group for Deere & Company (John Deere) and Peterbilt Motors Company (Peterbilt) equipment, he was pondering the board’s subdued reaction to what he believed was solid progress in the burgeoning transport division. Perhaps their optimism was somewhat tempered by the ongoing and significant challenges Cervus faced in the agriculture and construction segments of the business. The board understood the agriculture sector all too well, and this sector was in the midst of what many thought would be a prolonged downturn. In fact, John Deere’s prediction that agriculture equipment sales in North America would see a 25–30 per cent year-over-year drop in sales in 2015 was proving to be unsettlingly accurate.1 On the construction side, the board also knew that low crude oil prices of below CA$502 per barrel were laying waste to the Alberta construction industry, and a return to higher commodity pricing was not on the horizon. Additionally, the precipitous drop in Cervus’s share price through 2015 (from a high of $20.64 to $14.58), driven in part by declining shareholder confidence, was never far from their consciousness.3 Perhaps Higgins had been overly optimistic about the future growth prospects of the transport division. It was relatively young and faced uncertainty from the recent acquisition of Peterbilt Ontario, which had been the largest and perhaps most complex acquisition in the company’s short history.
Regardless of any of these observations, Higgins knew one thing with certainty: both the short- and long- term prosperity of Cervus would depend on his ability to profitably grow the company’s transport business.
CERVUS EQUIPMENT CORPORATION
Cervus began as a partnership between Peter Lacey, Graham Drake, and other owners of John Deere dealerships in the 1990s. The creation and foundation of the company was based upon a simple notion: owners of John Deere farm equipment dealerships were nearing retirement and looking for viable succession opportunities. Second-generation owners had difficulty accessing the large amount of capital required to purchase and grow dealerships and/or were not able to provide the level of leadership and management necessary to run the growing operations. Given this, some dealerships were not performing at
optimal levels. It became apparent that these owners were interested in divesting their dealerships, but not to just anyone. They cared about not only achieving a fair value for their businesses but also selling to a reputable operator who would continue to dutifully service and respect the rural communities where they lived with their customers and employees. These factors presented a real opportunity for Cervus to execute its business plan by establishing a reputation built on integrity and goodwill—the first of three primary factors in the company’s approach.
When Lacey and Drake first formed their partnership, they had no intention of managing the dealerships from a central organization. Rather, they believed that entrepreneurs with material ownership in the stores were in the best position to operate and grow these businesses. Until 1999, the model had no integration challenges, as no integration was required. That year, the business partners pooled their remaining dealership assets into the company, took it public, and embarked on an aggressive consolidation-based growth strategy.4
The second important element of Cervus’s approach was the relationship with the original equipment manufacturer (OEM), John Deere. They knew the dealers usually treated OEMs as suppliers rather than as partners and that this could sometimes result in a contentious business relationship. Cervus recognized that a more positive partnership approach with OEMs would provide, among other things, opportunities to purchase dealerships with growth potential. After all, John Deere was knowledgeable about the relative market performance of all its dealers, was aware of opportunities for potential acquisitions, and had final approval of all ownership transactions within its dealer network.
Finally, Lacey and Drake knew that they wanted to represent premium brands in the markets they served. John Deere was by far the premium, leading brand in the North American farm equipment industry, with industry-leading technology and over 35 per cent of the market share.5
Together, these three factors provided a great foundation for Cervus’s business and growth strategy. Over the next 15 years, the company amassed 75 equipment dealerships (either wholly or partially owned via partnerships) across 73 locations. Forty-two stores represented John Deere in the agricultural industry, and the remaining 33 represented other equipment brands: construction equipment brands Bobcat and JCB; material handling equipment OEMs Sellick, Clark, Nissan Forklift, and Doosan, which supplied forklifts, mulching equipment, and so on; and truck manufacturer PACCAR, which produced premium on-highway and vocational trucks, including Peterbilt trucks.6 Interestingly, Cervus was the only publicly traded company representing multiple stores in the John Deere dealer network.
Careful attention to its principal business proposition allowed Cervus to grow its sales to $979.6 million by 2014.7 However, this pace of growth was starting to weigh down the organization; gross margins were relatively strong, but profitability lagged as the company was unable to realize the anticipated economies of scale associated with its new size and breadth. Some of this was by design, as the organization continued to strongly support a decentralized management model that kept key customer-related decisions as close to the clients as possible. But many cost saving opportunities were lost due to the enormity of consolidating so many acquisitions in such a short time while simultaneously establishing a large centralized corporate support structure. Cervus’s information technology systems were many, varied, and, in many respects, antiquated. Its human resource management department was new and experiencing growth pains. Compensation and reward systems varied across the organization. Many dealerships were lacking the core management and leadership skill sets needed to reach the desired growth, service, and profitability targets. Overall, the organization lacked the core business processes and maturity one would expect to find in a $1 billion company. Corporate culture also varied among regions and industry segments and was often not aligned with the Cervus set of principles. Cervus was focused on solving these challenges and confident in its ability to do so, but the investment community was less optimistic.
In terms of future growth opportunities, further consolidating John Deere dealerships was proving to be difficult for a number of reasons. Firstly, manufacturers were historically uncomfortable having one organization amass a large amount of influence over the dealer network, as this afforded dealership owners too much bargaining power. For OEMs, the market risk of having too many of their dealerships in one basket was a legitimate concern because OEMs expected proper coverage of assigned trade areas, and bigger territory equated to higher risk. Secondly, Cervus had acquired the majority of the low-hanging fruit—the smaller, independently run dealerships. Remaining dealerships had already been consolidated into groups of five to nine stores; these savvier dealership groups would likely cost more to purchase. Finally, John Deere was not entertaining Cervus’s expansion in the U.S. market at this time. As a result, diversification became a key strategic plank in Cervus’s growth strategy.
These factors precipitated the organization’s move into the transport industry with the purchase of four Peterbilt truck dealerships in Saskatchewan in March of 2012.8 The Peterbilt brand was owned by the large international firm PACCAR Inc., headquartered in Bellevue, Washington; it was a premium brand in the North American transport market. Interestingly, PACCAR also owned the Kenworth truck brand which, in many respects, was a competitor to Peterbilt.
Cervus quickly learned that the transport industry was not like the agricultural industry and presented a significantly different business model with a unique set of challenges and opportunities. For example, Peterbilt maintained less than 14 per cent of the Canadian heavy-duty transport truck market in 2014.9 Until recently, it had been more focused on the niche market of independent or vocational truckers, who preferred higher quality trucks that could be customized to meet their individual tastes and desires. For this market, Peterbilt was, in effect, the Harley Davidson of the trucking industry. This proved to be a great product strategy in an industry that was highly fragmented and primarily represented by small trucking firms or independent truckers. Margins on customized Peterbilt trucks were well above the industry average, and it felt good to be the leader in this profitable market niche—until the industry began to consolidate.
GROWTH IN TRANSPORT
Buoyed by a strong relationship with Peterbilt Canada and facing limited North American growth opportunities with John Deere, Cervus elected to grow its transport business with the 2014 acquisition of Peterbilt Ontario. This brought into the fold 12 new Peterbilt dealerships with recent annual revenue ranging from $150 to $200 million.10 It also presented Cervus with an enormous set of new challenges. Peterbilt Ontario was not the leading player in the Ontario transport market; in fact, it was underperforming against Peterbilt’s North American market share of 15 per cent, with a 2013 regional market share of only 7.7 per cent.11 These dealerships were unprofitable at the time of the acquisition. Cervus also quickly learned that Ontario was not Saskatchewan. The Ontario transport industry was much more consolidated, with 60 per cent of the trucking purchases made by firms with more than 10 vehicles in their fleets.12 These firms were looking for fuel-efficient trucks and extraordinary service at multiple locations across their trucking corridors. Fleet customers represented the majority of the market and were growing quickly, with the top 100 operators in Canada owning 10,466 trucks in 2015, up a full 38 per cent from 2010.13 Cervus would need to work on and grow its value proposition for this group of customers.
Peterbilt Ontario historically had not served the fleet market effectively, and this showed in fleet sales that lagged behind those of its competitors. According to Dan Kaye, director of operations at Peterbilt Canada, “Peterbilt maintained much less than 15 per cent of the Ontario fleet market share, while fleet operators represented 90 per cent of the market.” He went on to point out that it maintained a 22 per cent share of the smaller independent truckers’ market, which was higher than Peterbilt’s national average, but unfortunately,
these customers represented only 10 per cent of the market.14 Selling to fleet operators was a very different proposition than selling to independent truckers, and Cervus was only beginning to understand the challenges associated with this market dynamic.
The upside of entering the Ontario market was the projection that its transport industry was expected to grow materially through 2020. Buoyed by low crude oil and related diesel fuel prices, along with a weak Canadian dollar, Ontario’s manufacturing sector was leading the country in economic growth.15 All of these products needed to get to market, and the transport industry was in the midst of a significant growth cycle. It couldn’t have come at a better time for Cervus. Whether by good planning or good luck, it had an opportunity to grow its Ontario trucking business as small trucking firms and large fleet operators were looking to grow their fleets in order to meet customers’ growing transport demands. According to GE Capital, heavy-duty truck orders grew 14.6 per cent year over year in the second quarter of 2015 alone.16
THE TRANSPORT INDUSTRY
The North American transport industry was expected to grow marginally from 2015 to 2020, representing 200,000 new units.17 This was driven by a number of factors—primarily operators’ strong desires to improve fuel efficiency in their fleets, as diesel fuel represented 38 per cent of their costs in 2013.18 Replacing long-haul trucks before the end of their useful lives (usually 10 years or one million kilometres) was becoming commonplace due to the attractiveness of newer fuel-efficient vehicles and a lower total cost of ownership with newer vehicles.19 Regulation also played a key role in this projected trend. For example,
U.S. regulators required all transport truck manufacturers to ensure that the average fuel consumption of all trucks sold—and related greenhouse gas (GHG) emissions—remained below a certain level. This was not necessarily good news for Peterbilt, which maintained a strong share of the highly customized truck market, where trucks were primarily positioned to meet user needs beyond fuel efficiency. In fact, these trucks were traditionally designed more for their looks and exceptional ride than for strong aerodynamics. According to Kaye, it wasn’t unusual for an independent trucker who preferred a Peterbilt truck to spend up to $30,000 on accessories.
Larger consolidated fleets now represented the majority of the growth in truck sales. Over the last 10 years, trucks and tractors operated by the top private fleets in the United States had increased by over 50 per cent to 1.193 million units.20 These customers were mainly concerned with a full package consisting of national pricing, lower acquisition costs, strong service along trucking corridors, and a lower total cost of ownership. This drove manufacturers to build simpler trucks with improved aerodynamics and fuel efficiency.
Manufacturers were also experimenting with new technology associated with autonomous or self-driving trucks, which included predictive cruise control systems and “platooning technology.” These enhancements allowed multiple trucks to wirelessly integrate their cruise control systems, which permitted them to draft closely yet safely together on the highway and realize better fuel efficiency. If this technology were to evolve to include actual self-driving or autonomous trucks, many believed the industry would change forever, as it would require fewer drivers. This would address one of the industry’s biggest challenges: a lack of qualified truck drivers;21 the U.S. trucking industry expected to require 21 per cent more truck drivers by 2020.22 While the impact of this technology would not materialize overnight, it was clearly happening quicker than most anticipated. Nevada had already passed legislation allowing autonomous trucks on its interstate highway systems, and more states were expected to quickly follow its lead.
Manufacturers also continued to experiment with alternative fuel sources like liquefied natural gas (LNG), given the attractiveness of low LNG prices in North America. LNG-powered trucks represented up to a
$70,000 upgrade cost for the buyer, who would see a payback in approximately three and a half years, based on estimated fuel savings of $20,000 per year.23 According to the United States Environmental Protection Agency, medium- and heavy-duty transport trucks represented 23 per cent of transportation sector GHG emissions in the United States, and a full 6.21 per cent of total U.S. GHG emissions. This raised the spectre of increased emissions regulations, including the potential for carbon-related taxes for operators. Opponents to LNG as a transport fuel suggested that LNG transport truck engines lacked the necessary torque performance of a diesel engine, thus affecting their performance and overall resale value. Other technologies designed to be attractive to fleet operators related to remote diagnostics. SmartLINQ telematics systems allowed firms to monitor and eventually control everything about a truck and its operation remotely, which supported more proactive maintenance services and minimized costly downtime for operators and fleet managers.24
A large part of trucking dealers’ profit was realized on service and parts: service represented 65 to 70 per cent of gross margins, while the sale of parts represented 28 to 30 per cent. New trucks were sold at a much smaller average gross margin of 3 per cent.25 Dealers were thus encouraged to grow to achieve larger fleets under their care and subsequently grow their parts and service businesses. Dealerships were themselves consolidating, driven by the natural economies of scale in their business model and the OEMs’ desires to deal with fewer, larger, and more professional dealer organizations.
Heavy-duty or Class 8 trucks represented 67.5 per cent of U.S. truck sales in 2014, with the remaining 32.5 per cent made up by the smaller, medium-duty categories.26 Medium-duty trucks were used in more regional applications and included garbage trucks, dump trucks, specialized security trucks for the banking industry, and line-painting trucks. This category represented the fastest-growing market segment in North America, increasing from a low of 66,000 units in the United States in 2009 to 132,000 units in 2014.27 Growth of this segment followed a similar pattern in Canada (see Exhibit 1). Traditionally, these types of vehicles were owned by the public sector, but there was a recent trend to outsource these services to private companies. These trucks tended to have a replacement lifecycle of four years or 800,000 kilometres of non- highway driving.28
PACCAR AND PETERBILT CANADA
PACCAR, a $19 billion global truck-manufacturing company, represented multiple brands in the market, including Kenworth and Peterbilt in North America and DAF in Europe.29 PACCAR was seeing tremendous growth in Asia, Brazil, and Australia, while North America represented a more mature market. PACCAR was positioned as a premium provider in the North American market and hoped to achieve a 30 per cent market share from its combined sales of Peterbilt and Kenworth trucks—15 per cent each.30 The company believed that reaching for a higher share of the market would ultimately lead to lower-quality production, placing it more directly in competition with multinationals like Volvo and International and negatively affecting PACCAR’s margins and profitability. PACCAR’s dealer network consisted of nearly 2,000 locations worldwide, most of which were independently owned and operated.31 These dealers provided sales and service to both independent truckers and fleet customers. In the United States, one large public company, Rush Enterprises, represented over 40 per cent of PACCAR’s sales via 100 locations across 21 states.32 Most OEMs preferred to optimize the concentration of control of any one dealer group. The size and scope of regional control of this company was likely a growing concern for PACCAR in terms of the bargaining power Rush Enterprises was able to exert over its product, sales, and marketing initiatives. This, in turn, was putting pressure on PACCAR’s margins in the United States, and the net result for its Canadian operations was simple: PACCAR would likely not replicate this situation in Canada.
In Canada, PACCAR had 10 Peterbilt dealer groups representing 55 dealerships across the country.33 To put this in perspective, International had twice as many dealers across the country, placing it at a distinct advantage in the fleet market from a parts and service perspective.34 International’s dealerships gave it better coverage and made it better able to service its customers along the fleet trucking corridors. This service coverage requirement led some OEMs to authorize new independent service providers (ISPs)— small operations that provided parts and service only—in smaller centres across the country. Only three Peterbilt ISPs existed in Canada, as dealer groups were not fond of them due to their lower overall sales and profitability. However, to handle anticipated fleet requirements over the next five years, Peterbilt intended to build an additional five to six newer, smaller dealerships with a stronger focus on parts and service in locations that would fill existing gaps in the primary trucking corridors. Peterbilt’s goal for Canada would also see the current 10 dealer groups consolidated to four, while the number of dealerships and service centres across the country would grow.35
When Cervus acquired Peterbilt Ontario, it owned and operated all 12 of the Peterbilt dealerships in Ontario. Unfortunately, they were not performing to their potential. In fact, Peterbilt’s market share in Ontario for Class 8 trucks36 was just 6.5 per cent in 2014 (down from 7.5 per cent in 2013), significantly lower than market shares of 15.8 per cent in British Columbia, 21.7 per cent in Alberta, 22.9 per cent in Saskatchewan, and 13.2 per cent nationally.37 To a certain degree, the numbers reflected differences among these geographic markets; many more fleet customers were represented in Ontario. The good news for Cervus was that it was having an early positive impact: market share projections for 2015 looked stronger, and sales were expected to grow from $170 million in 2014, with a negative return on sales (ROS), to a forecasted $220 million in 2015, with a 1 per cent ROS.38 Peterbilt’s five-year target was to grow Ontario sales to more than $300 million with an 8 per cent ROS—a tall order indeed. PACCAR was being patient with Cervus by giving the company until early 2016 to “get their house in order” prior to looking for a number of significant new growth initiatives, including the building out of new dealerships and service locations.39 Building a new full-service dealership cost Cervus upwards of $20 million, while building a smaller ISP was much less costly (in the range of $3 to $5 million). The Ontario business was clearly not generating enough cash to fund this level of investment.
INTERNAL CHALLENGES
Cervus and its newly acquired transport division in Ontario faced many and varied internal challenges, which was typical for a divisional company tied to an acquisition-related growth strategy. For example, compensation plans for sales professionals did not include a compelling sales commission structure. Therefore, sales professionals were not highly motivated to sell. At the time of the acquisition, the majority of Peterbilt Ontario employees drove company cars; Cervus sequestered most of these, as its corporate policy did not provide for company-funded vehicles. There was no consistency in the information systems used across the dealerships, so fundamental reporting was haphazard. Perhaps most critically, dealership managers had not previously been given the authority to run their operations or manage profitability targets. These dealerships were traditionally “command and control” operations, with the owners making the majority of decisions on a day-to-day basis. This presented a significant skill gap for Cervus, which preferred dealership managers who were capable of the autonomy required to run their dealerships, focused on serving their customers, and able to meet growth and profitability targets. The culture within the Peterbilt Ontario organization was also very different, and Cervus viewed the cultural transition as the most critical factor in the acquisition integration process. It tasked a team of experienced employees with the responsibility for integration and cultural change—a process that would take 18 months to complete (see Exhibit 2).
Cervus lacked strong centralized services around key functional areas such as information systems (IS), operational processes, human resource management, financial management and reporting, and marketing. This was not surprising, given that the company had been primarily focused on growing its business through acquisitions over the previous 15 years. However, now that it had reached close to $1 billion in sales and had over 1,700 employees, challenges in these areas were starting to rear their heads.40 One example was the frustration Ontario management experienced in paying suppliers on time. Power at some dealerships had been shut off due to non-payment after the accounts payable function was moved to corporate headquarters. Cervus’s IS group was fairly new as well, and its position in the business was illustrated by the absence of any consideration to IS integration in the acquisition playbook and the lack of a corporate operating budget for the group. The IS director suggested that a major system change initiative underway in 2015 would see one of Cervus’s core dealer management systems being moved from “30-year-old technology to 23-year-old technology.” The company clearly lacked broad competencies in this area, partly as a result of the dealer management systems mandated by its OEM partners, who lacked broad competencies in this area themselves. An absence of a common database infrastructure across multiple dealerships made it difficult to run the business. For example, it could take four to six weeks to build a customer list for a direct marketing campaign which, by that time, was not particularly responsive in a competitive environment.41 To be fair, Cervus was committed to fixing these many and varied internal challenges. However, shareholders and the investment community were growing impatient, as these investments were having a negative impact on earnings growth. This was particularly worrying to investors who were oriented to short-term gains. Income had slipped from a high of $23.3 million in 2013 to $18.5 million in 2014, and year-to-date, second-quarter 2015 operating income dipped to $6.5 million, down from
$10.1 million in 2014.42 How could the company invest in building a solid foundation for future growth when shareholders were short sighted? This question was not unique to Cervus, as a publically traded company, but it was certainly hampering the company’s potential for growth and enhanced operational performance.
OPERATIONAL PERFORMANCE
The first half of 2015 was a trying period for Cervus. As of June 30, same-store sales were down 10 per cent, and earnings before interest, taxes, depreciation, and amortization (EBITDA) were down 25 per cent.43 This was partially the result of over-exuberant purchasing from customers from 2012 to 2014 and a global oversupply of core commodity agriculture products. The company’s construction division was even worse off because it relied on Alberta and its oil industry. Low crude oil prices had reduced or ended capital expenditures in the oil sands, resulting in a decreased need for machinery; machinery sales in the mining and oil and gas sector declined by 36 per cent over the first 10 months of 2015.44 Transport, while promising and growing, was really in its infancy within Cervus, and it was still far from achieving the desired levels of profitability; as of June 30, 2015, it showed only $116,000 in income on $151 million in sales for the year to date.45 All of this, combined with financial results and performance data for 2013–14 (see Exhibits 3 and 4), added up to a gloomy outlook for 2015. Cervus faced a number of difficult decisions as it attempted to shore up investor confidence, invest in fixing its many internal challenges, and grow its business and profitability.
COMPETITIVE POSITIONING
Peterbilt was recognized as a premium brand in the transportation market; it was compared to Harley Davidson and was a brand that truckers loved to drive. While this served Cervus well in markets dominated by independent truckers, like Saskatchewan, it contributed to less-than-optimal competitive positions in growth markets like Ontario, Quebec, and British Columbia, which were increasingly dominated by fleet
customers. Over the last few years, this situation drove a number of corporate initiatives that were designed to reposition the brand in the market. First, Cervus intended to grow its dealer and service network, which required six new dealers in Ontario alone to meet the sales and service requirements of the prospective fleet customers.46 Second, it wanted to consolidate its Canadian dealerships under four ownership groups. Larger ownership groups would be better positioned to manage the cyclical nature of the industry and at the same time build out the necessary sales and service capabilities required by fleet customers. Ultimately, the company did not wish to make the same mistake as its U.S. counterparts by allowing any one dealership group to represent a large percentage of sales. Third, Peterbilt was not going to abandon its premium position in the market in order to grab market share.47 It believed the exceptional quality of a Peterbilt truck meant that its customers enjoyed a lower total cost of ownership than those of competitors, and it had always leveraged the key fact that drivers preferred driving Peterbilt trucks. Even as the company recognized its strengths and opportunities, it had a long way to go in Ontario, where its current year-to-date market share of Class 8 trucks at August 31, 2015, presented at just 6.6 per cent—a far cry from its 15 per cent target.48
THE NEXT PHASE OF GROWTH
Higgins knew one thing for certain: the next phase of growth for Cervus’s transport division would make the last few years look easy. He was confident that the company’s relationship with Peterbilt Canada was strong and that this would be critical to their joint success. He also knew that the market and growth pressures would test this relationship beyond anything they had experienced to date. His senior leadership team in Ontario was exceptional. This was important because it was clearly going to be challenged in new and meaningful ways—both with ongoing integration efforts associated with the Peterbilt Ontario acquisition and with growth and profitability requirements in the Ontario market. Despite all efforts, outcomes could be affected by the reality that agricultural and construction sales, which had traditionally represented over 80 per cent of Cervus’s business, were under immense downward pressure due to what looked like longer-than-expected cyclical downturns in these industries.49
The bottom line: Cervus required its transport division to drive profitable growth in 2016 and beyond.
EXHIBIT 1: TRANSPORTATION IN CANADA

Source: Cervus Equipment Corporation, Investor Presentation—August 2015, 11, August 2015, accessed October 22, 2015, www.cervuscorp.com/documents/presentations/Cervus_Presentation_August_2015.pdf.
EXHIBIT 2: ACQUISITION INTEGRATION MODEL AT CERVUS EQUIPMENT CORPORATION: ACQUISITION, INTEGRATION, STRATEGY, AND CULTURE BEST PRACTICE
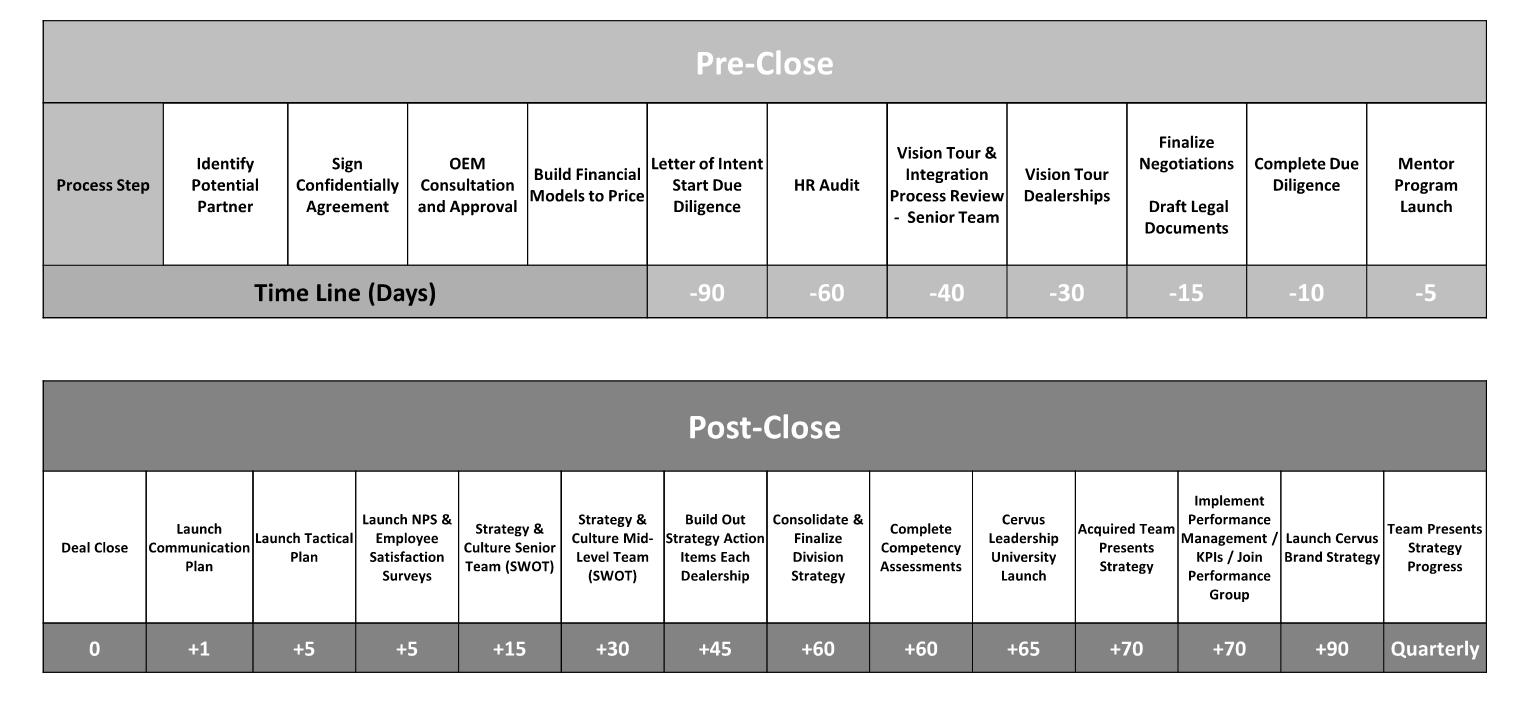
Note: SWOT = strengths, weaknesses, opportunities, and threats; KPI = key performance indicators Source: Company files.
EXHIBIT 3: CERVUS EQUIPMENT CORPORATION FINANCIAL SUMMARY (IN CA$ THOUSAND, AS OF DECEMBER 31)
| Consolidated Statement of Financial Position | ||
| 2013 | 2014 | |
| Assets | ||
| Current Assets | ||
| Cash & Equivalents | 14,678 | 18,787 |
| Accounts Receivable | 45,584 | 58,462 |
| Inventory | 178,511 | 324,625 |
| Other | 3,681 | 8,340 |
| Total Current Assets | 242,454 | 410,214 |
| Non-Current Assets | ||
| Property & Equipment | 101,896 | 148,948 |
| Deferred Tax Asset | 37,009 | 24,518 |
| Intangible Assets | 26,139 | 54,009 |
| Goodwill | 6,866 | 19,732 |
| Other | 11,866 | 11,882 |
| Total Non-Current Assets | 183,776 | 259,089 |
| Total Assets | 426,230 | 669,303 |
| Liabilities | ||
| Current Liabilities | ||
| Trade & Other Accrued | ||
| Liabilities | 48,821 | 81,237 |
| Floor Plan Payments | 67,198 | 175,035 |
| Other | 13,251 | 34,566 |
| Total Current Liabilities | 129,270 | 290,838 |
| Non-Current Liabilities | ||
| Term Debt | 46,002 | 96,843 |
| Debenture & Notes Payable | 31,265 | 32,598 |
| Finance Lease Obligation | 18,334 | |
| Deferred Income Tax Liability | 1,273 | 1,199 |
| Total Non-Current Liabilities | 78,540 | 148,974 |
| Total Liabilities | 207,810 | 439,812 |
| Equity | ||
| Shareholder Capital | 78,126 | 83,814 |
| Other | 11,741 | 14,184 |
| Retained Earnings | 124,982 | 130,036 |
| Total Equity Attributable to | ||
| Equity Holders | 214,849 | 228,034 |
| Non-Controlling Interest | 3,571 | 1,457 |
| Total Equity | 218,420 | 229,491 |
| Total Liabilities & Equity | 426,230 | 669,303 |
EXHIBIT 3 (CONTINUED)
| Consolidated Statement of Comprehensive Income | ||
| 2013 | 2014 | |
| Revenue | ||
| Equipment Sales | 673,123 | 741,072 |
| Parts | 117,261 | 150,682 |
| Service | 55,911 | 69,535 |
| Rentals | 14,843 | 18,320 |
| Total Revenue | 861,138 | 979,609 |
| Cost of Sales | (697,829) | (792,936) |
| Gross Profit | 163,309 | 186,673 |
| Other Income | 3,885 | 3,715 |
| SG&A Expense | (132,796) | (157,678) |
| Results from Operating Activities | 34,398 | 32,710 |
| Net Financing Costs | (6,203) | (7,272) |
| Share of Profit of Equity Accounted | ||
| Investees | 3,527 | 712 |
| Income Tax Expense | (8,396) | (7,654) |
| Profit for the Year | 23,326 | 18,496 |
| Foreign Currency Translation | (82) | 53 |
| Total Comprehensive Income | 23,244 | 18,549 |
| Consolidated Statement of Cash Flows | ||
| 2013 | 2014 | |
| Cash Flows from Operating Activities | ||
| Profit for the Year | 23,326 | 18,496 |
| Depreciation | 8,483 | 10,610 |
| Amortization of Intangibles | 4,825 | 5,833 |
| Equity-Settled Share-Based Payment | ||
| Transactions | 1,428 | 1,526 |
| Net Finance Costs | 6,556 | 7,968 |
| Income Tax Expense | 8,396 | 7,654 |
| Change in Non-Cash Working Capital | (13,477) | 23,202 |
| Other | (2,815) | 1,438 |
| 36,722 | 76,727 | |
| Interest & Cash Taxes Paid | (6,242) | (7,633) |
| Net Cash from Operating Activities | 30,480 | 69,094 |
| Cash Flows from Investing Activities | ||
| Business Acquisitions | (1,352) | (84,379) |
| Proceeds from Asset Held for Sale | 4,931 | 3,775 |
| Purchase of Property & Equipment | (27,919) | (24,777) |
| Other | 5,932 | 4,190 |
| Net Cash Used in Investing Activities | (18,408) | (101,191) |
| Cash Flows from Financing Activities | ||
| Proceeds from (repayment of) Term Debt | 6,904 | 50,910 |
| Proceeds from Issue of Share Capital | – | 1,530 |
| Dividends Paid | (10,561) | (11,358) |
| Other | (2,447) | (5,022) |
| Net Cash Used in Financing Activities | (6,104) | 36,060 |
| Net Decrease in Cash & Cash Equivalents | 5,968 | 3,963 |
| Effect of Foreign Currency Translation on | ||
| Cash | 554 | 146 |
| Cash & Cash Equivalents Beginning of Year | 8,156 | 14,678 |
| Cash & Cash Equivalents End of Year | 14,678 | 18,787 |
Note: SG&A = sales, general, and administrative
Source: Cervus Equipment Corporation, The Cervus Dealership Difference: 2014 Annual Report, March 2015, accessed April 22, 2015, www.cervuscorp.com/uploads/Cervus2014AR.pdf.
EXHIBIT 4: SUMMARY FINANCIAL PERFORMANCE INFORMATION (2005–2014)

Source: Cervus Equipment Corporation, Cervus Equipment Corporation Investor Presentation—April 2015, accessed April 22, 2015, www.cervuscorp.com/investor/investor-presentations.htm.
ENDNOTES
1 “Dealers Expect an 11% Drop in 2015 Equipment Sales,” Farm Equipment, March 9, 2015, accessed November 3, 2015,
www.farm-equipment.com/articles/11408-dealers-expect-an-11-drop-in-2015-equipment-sales.
2 All figures are in Canadian dollars; US$1 = CA$1.32 on August 31, 2015.
3 “Cervus Equipment Corporation, Company Summary,” Google Finance, accessed October 22, 2015,
www.google.ca/finance?cid=695337.
4 As of 1999, Cervus Equipment traded on the Toronto Stock Exchange under the ticker symbol CVL.
5 IBIS World, Tractors & Agricultural Machinery Manufacturing in the U.S.: Market Research Report, NAICS 33311, October 2014, 28, accessed October 4, 2016, www.ibisworld.com/industry/home.aspx.
6 Cervus Equipment Corporation, Acquire, Integrate, Operate [Cervus Overview August 2015], 2, August 2015, accessed October 22, 2015, www.cervuscorp.com/documents/presentations/Cervus_Overview_August_2015.pdf.
7 Cervus Equipment Corporation, Investor Presentation—August 2015, 14, August 2015, accessed October 22, 2015, www.cervuscorp.com/documents/presentations/Cervus_Presentation_August_2015.pdf.
8 Cervus Equipment Corporation, Cervus Equipment Corp. Completes Acquisition of Frontier Peterbilt Sales Ltd., Frontier Collision Center Ltd. and Frontier Developments Ltd., March 19, 2012, accessed October 22, 2015, www.cervuscorp.com/uploads/FrontieracquisitionclosingMarch2012.pdf.
9 “Truck Sales Class 7 YTD, 2014,” Today’s Trucking, accessed November 3, 2015, www.todaystrucking.com/stats/2014/ytd?class=7; “Truck Sales Class 8 YTD, 2014,” Today’s Trucking, accessed November 3, 2015, www.todaystrucking.com/stats/2014/ytd?class=8.
10 Cervus Equipment Corporation, Cervus Equipment Corporation Announces Definitive Agreement to Acquire Peterbilt of Ontario Inc., press release, July 2, 2014, accessed October 22, 2015, www.cervuscorp.com/uploads/CVLPOIAcquisitionJuly2014FINAL.pdf.
11 “Truck Sales Class 7 YTD, 2013,” Today’s Trucking, accessed November 3, 2015,
www.todaystrucking.com/stats/2013/ytd?class=7; “Truck Sales Class 8 YTD, 2013,” accessed November 3, 2015,
www.todaystrucking.com/stats/2013/ytd?class=8.
12 Cervus Equipment Corporation, Investor Presentation—August 2015, op. cit., 11.
13 Ibid.
14 Dan Kaye, Director of Canadian Operations, Peterbilt of Canada, interview with case author, June 4, 2015.
15 Diesel retail prices in the United States were down more than a dollar year over year as of July 20, 2015; William B. Cassidy, “US Shippers, Truck Companies Reap Low Fuel Price Benefits,” The Journal of Commerce, accessed October 22, 2015, www.joc.com/trucking-logistics/truckload-freight/jb-hunt-transport-services/fuel-prices-propel-first-half-trucking- trends_20150728.html.
16 GE Capital, Industry Research Monitor: Canada Truck Transport, 3, accessed November 3, 2015, www.gecapital.ca/GECA_Document/Trucking_Industry_Monitor_3Q15.pdf.
17 PACCAR Inc., 110 Years PACCAR Inc., July 2015, 26, accessed October 22, 2015, http://www.paccar.com/media/2552/q3-2016-investor-presentation.pdf.
18 W. Ford Torrey, IV, and Dan Murray, An Analysis of the Operational Costs of Trucking: 2014 Update, (Arlington, VA: American Transportation Research Institute, 2014), 13, accessed October 22, 2015, www.atri-online.org/wp- content/uploads/2014/09/ATRI-Operational-Costs-of-Trucking-2014-FINAL.pdf.
19 Dan Kaye, op. cit.
20 Jim Mele, “The 2014 Fleet Owner 500,” FleetOwner, February 12, 2014, accessed November 3, 2015, http://fleetowner.com/truck-stats/2014-fleet-owner-500.
21 “Lack of Qualified Drivers Squeezing Capacity,” Ontario Trucking Association, January 7, 2015, accessed November 3, 2015, http://ontruck.org/lack-of-qualified-drivers-squeezing-capacity/.
22 Scot Santens, “Self-Driving Trucks Are Going to Hit Us Like a Human-Driven Truck,” Medium, May 14, 2015, accessed November 3, 2015, https://medium.com/basic-income/self-driving-trucks-are-going-to-hit-us-like-a-human-driven-truck- b8507d9c5961.
23 Brian Gambill and Blair Veenema, “Natural Gas Fuel for Class 8 Trucks,” Oil + Gas Monitor, October 22, 2012, accessed November 2, 2015, www.oilgasmonitor.com/natural-gas-fuel-class-8-trucks/3137/.
24 Peterbilt, SMARTLINQ, accessed June 7, 2016, www.peterbilt.com/technology/smartlinq/.
25 Dan Kaye, op. cit.
26 Statista, “Class 3-8 Truck Sales in the United States from 2001 to 2014,” accessed November 3, 2015,
www.statista.com/statistics/261416/class-3-8-truck-sales-in-the-united-states/.
27 Ibid.
28 Gara Hay, General Manager, Transportation, Cervus Equipment Corporation, interview with case author, June 4, 2015. 29 PACCAR Inc., PACCAR 2014 Annual Report, 1, accessed October 22, 2015, www.PACCAR.com/media/2332/PACCAR- ar_2014.pdf.
30 PACCAR Inc., 110 Years PACCAR Inc., op. cit. 19.
31 PACCAR Inc., Get to Know PACCAR, accessed October 22, 2105, www.PACCAR.com/about-us/get-to-know-PACCAR/. 32 Rush Enterprises, Investor Presentation, April 26, 2016, 6, accessed June 7, 2016, http://files.shareholder.com/downloads/RUSH/2202789330x0x110728/1E0B9616-65A7-4391-9F69- A9F49999C728/InvestorPresentation.pdf.
33 Dan Kaye, op. cit.
34 Navistar Inc., “Whatever the Job, There's an International Truck that's Built for It,” International Trucks, accessed June 7,
2016, http://ca.internationaltrucks.com/trucks/?noredirect=1.
35 Dan Kaye, op. cit.
36 The Class 8 truck gross vehicle weight rating (GVWR) is anything above 33,000 pounds (14,969 kilograms). 37 “Truck Sales Class 8, August 2015,” Today’s Trucking, accessed October 22, 2015, www.todaystrucking.com/stats/2015/8?class=8.
38 Gara Hay, op. cit.
39 Ibid.
40 Cervus Equipment Corporation, Cervus Equipment Named to Alberta Venture Magazine’s ‘Fast Growth 50’ List, January 12, 2015, accessed June 7, 2016, www.cervusequipment.com/news-2015-01-12.php.
41 Gara Hay, op. cit.
42 Cervus Equipment Corporation, Consolidated Financial Statements of Cervus Equipment Corporation for the Years Ended December 31, 2014 and 2013, March 10, 2015, 4, accessed November 3, 2015, www.cervuscorp.com/uploads/Cervus2014AR-Financials.pdf.
43 Cervus Equipment Corporation, Cervus Equipment Corp. Announces Second Quarter 2015 Results, August 12, 2015, 3,
accessed November 3, 2015, www.cervuscorp.com/uploads/CervusEquipment-2015Q2PressRelease.pdf.
44 Alberta Government, How Are Low Prices Affecting Alberta’s Manufacturing Industry? January 18, 2016, 3, accessed June 7, 2016, www.albertacanada.com/files/albertacanada/SP-Commentary_01-18-16.pdf.
45 Cervus Equipment Corporation, Unaudited Condensed Interim Consolidated Financial Statements of Cervus Equipment Corporation for the Three and Six Month Periods Ended June 30, 2015 and 2014, 17, accessed November 3, 2015, http://www.cervuscorp.com/uploads/CervusQ22015FS_Final.pdf.
46 Dan Kaye, op. cit.
47 Fifteen per cent was their stated target share.
48 “Truck Sales Class 8 YTD, 2015,” Today’s Trucking, accessed November 3, 2015,
www.todaystrucking.com/stats/2015/ytd?class=8.
49 Cervus Equipment Corporation, The Cervus Dealership Difference. 2014 Annual Report, 39, accessed November 3, 2015, www.cervuscorp.com/uploads/Cervus2014AR.pdf.
Cervus Equipment Corporation has grown its business substantially over the past 10 years through regional acquisitions and strong organic growth. The company was founded to manage and consolidate farm equipment dealerships in western Canada but, in partnership with original equipment manufacturers, has branched into the construction equipment and long haul trucking manufacturing industries and has moved into New Zealand and Australia. The board of directors is now looking for the new chief executive officer (CEO) to chart an innovative growth strategy that will see the company triple in size over the next five years. The market fundamentals to support this growth are quite strong and realistic; however, the growth opportunities in the company's traditional Canadian markets are not sufficient and its customers' requirements are being driven to new levels of complexity due to a technology revolution happening within the industry. At the same time, its experience overseas has ultimately provided an opportunity to develop a greater understanding of the differences in international markets and new cultures. The CEO needs to come up with a growth plan that puts Cervus Equipment into non-traditional markets or new industries while addressing the changes happening in the industry.


