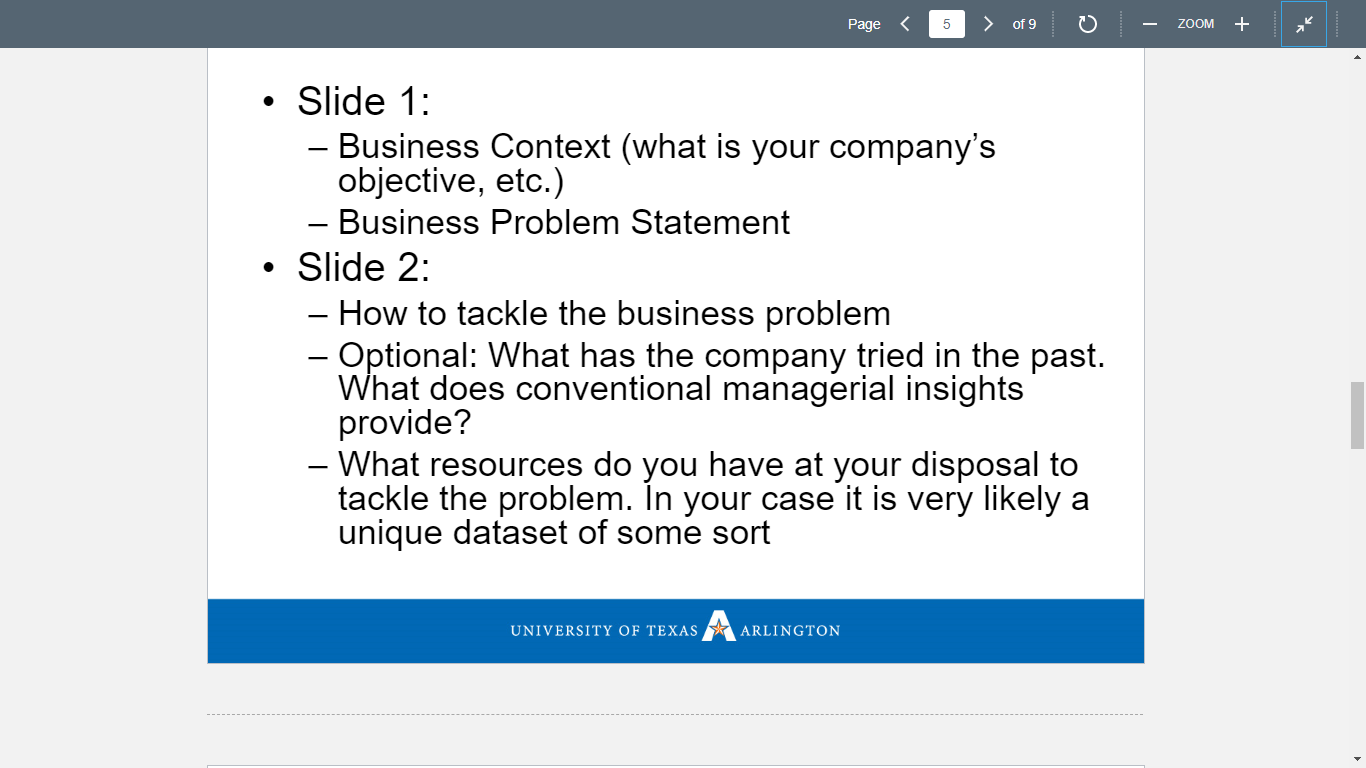
I have to make two slides according to the questions I've provided in the instruction using the first and second project proposals. I’m pretending as a consulting company to help other companies find
This my assignment
Instruction
I have to make two slides according to above questions using provided the first and second project proposals below. I’m pretending as a consulting company to help other companies find the investment opportunities that fall within their specific risk appetite. It is a business proposal.
It’s due by 4/20 by 11pm.
First Project Proposal
Team One has selected the dataset “US Bankruptcy Prediction Dataset” from Kaggle.com. This dataset contains data from fiscal years 1979 to 2017 for anonymous companies. There are 11 standard financial variables obtained from end of year financial reports. Variables include fiscal year, Tobin’s Q, earnings per share, liquidity ratio, profitability ratio, productivity ratio, leverage ratio, asset turnover, return on equity, market book ratio, and if the company had filed for bankruptcy.
When mining this data, the objective is should we invest in this business or not. This prediction could then be used to help decide if an investor, either an individual or another company, should invest in the company that is being analyzed. This dataset is useful because it contains variables that are found in year-end financial reports that are legally required to be completed by publicly traded companies.
What we are looking for is if a company has 90% chance they’re going to go bankrupt, then nobody will invest, but if there’s a 10 % chance going into bankruptcy then almost everyone would invest. We are trying to find the people in between the 40 to 60% area where some other people might not invest but when our model shows that it would be a good idea to invest in that company.
We used multiple data visualization in Tableau and also tried the Linear regression, Logistic regression, and stepwise regression in SAS.
We are going to use linear regression to attempt to create a formula that will predict whether a company will enter bankruptcy. We are also going to create a classification tree that would be able to take new data and filter it into the appropriate yes/no category for bankruptcy.
During pre-processing of the data, the first step is to remove entries with missing variables. This dataset had three variables, asset growth, sales growth, and employee growth, that had thousands of missing entries. We decided to remove these variables in order to maximize number of entries. By removing these variables, the dataset is reduced from 92,872 records to 92,577. Using Tableau to create a box plot for each of the variables that show the values for records when split by the bankruptcy field will allow us to find and remove outliers. We can also create graphs to show the average value for each variable and get an idea of what variables may be more important to our regression equation. We expect that market book ratio, earnings per share, and the profitability ratio to correlate strongly with a company filing for bankruptcy.
| How many observations in the dataset? | 92,872 |
| How many binary/categorical variables? | |
| How many continuous variables? | 10 |
| What is the outcome / target variable? | BK (bankruptcy) |
| If binary or categorical: What percentage of the variables belong to each class? | 0: 95.4% 1: 4.6% |
| If continuous: What is the mean value of the target variable? | N/A |
| Before doing any further processing, what would your prediction of the target variable be? | We predict that at least one of the variables will correlate with a company entering bankruptcy. |
Second Project Proposal
Group 1 will be using the dataset of company bankruptcies to determine which companies investors should be interested in. We will use our findings to determine a list of companies that are 40% - 60% likely to not go bankrupt. These companies would be considered too high risk for many large investors but could be within the risk appetite for mid-level investors.
The original dataset contained 92,577 records, but only 4.6% of those companies went bankrupt. We split the data set into 3 different groups, each containing all bankrupt companies and an equal number of randomly selected bankrupt companies. Enclosed is the original dataset as well as the 3 subgroups that were used to explore the data.
Attached below in the project proposal are multiple data visualization techniques created from our entire dataset and from our split datasets named A, B and C. These data visualization techniques contain the variables Profitability and Asset Turnover and shows how they can help determine whether a business is likely to go bankrupt or not. Asset Turnover and Profitability are grouped together much more closely for companies that did go bankrupt as compared to those that did not. Additionally, we explored the difference between the median values of Asset Turnover and Profitability. Results for the entire data set were similar to those of each separate data set.


