Astronomy lab assignment
Hubble's Law: 
determining the expansion rate of the Universe
Learning Objectives
Using analyses of images and spectra of selected galaxies, the students will
Measure angular sizes of galaxies and find their distances;
Measure the redshifts of spectral lines and find the recessional velocities;
Determine a value for Hubble's constant;
Estimate the age of the Universe from this constant and compare it to the age of the Sun and the Milky Way;
Discuss the effect that various uncertainties in measurements have on the Hubble constant ;
Summarize how our view of the Universe has changed as the value of the Hubble constant has improved.
Materials
Each part of the procedure will have separate due dates - check with your TA!
Full column data worksheet
Calculator
Background and Theory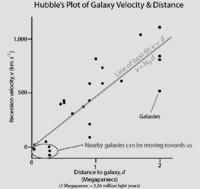
 In the 1920's, Edwin P. Hubble discovered a relationship that is now known as Hubble's Law. It states that the recessional velocity of a galaxy is proportional to its distance from us:
ν = Hod [Eqn. (1)]
where v is the galaxy's velocity (in km/sec), d is the distance to the galaxy (in megaparsecs; 1 Mpc = 1 million parsecs), and Ho is the proportionality constant, called "The Hubble Constant." Hubble's Law states that a galaxy moving away from us twice as fast as another galaxy is twice as far away as that galaxy (or, three times faster is three times farther away than another galaxy, etc.). The Hubble constant is a hotly contested quantity in astrophysics. In order to precisely determine the value of Ho, we must determine the distances to and velocities of many galaxies, preferably those extremely far away so that we get beyond the Milky Way's gravitational interaction with "nearby" galaxies.
Finding the distance knowing a galaxy's actual size and angular size
A trickier task is to determine a galaxy's distance, since we must rely on more indirect methods. One may assume, for instance, that all galaxies of the same type are the same physical size, no matter where in the Universe they are. This is known as "the standard ruler" assumption. To use this assumption, however, we have to know the actual size of the "ruler" and to do that, we need the distances to the galaxies that form our standard ruler. So, since we are working with spiral galaxies, we choose nearby galaxies such as Andromeda, Triangulum, Messier 81, and others to which we have found an accurate distance measure using variable stars or other reliable distance indicator. We find that, on average, the actual size of these standard ruler galaxies is 22 kiloparsecs (22 kpc or 22,000 parsecs or ~72,000 light years).
Theoretically, then, to determine the distance to a galaxy one would need to measure only its angular size and use the small angle formula: a = s / d, where a is the measured angular size (in radians!), s is the galaxy's true size (diameter, 22 kpc in our work here), and d is the distance to the galaxy.
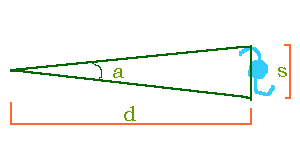

a = s/d or d = s/a [Eqn. (3)]
There is another caveat, however. Each telescope and detector scales the images of celestial objects differently. While the actual angular size of a galaxy does not change, that galaxy might take up 30,000 pixels squared on one detector while on another one (having larger sized pixels) it takes up 5400 pixels squared. Since we may not know anything about the detector ahead of time, we need to figure out how much of the celestial sphere, in radians, is represented by each pixel. We can do this if one of our galaxies has an independent measurement of its angular size. That is the case for NGC 2903, the galaxy that is the closest one in our sample.
Data for NGC 2903 (http://www.messier.obspm.fr/xtra/ngc/n2903.html accessed 9 Feb. 2009):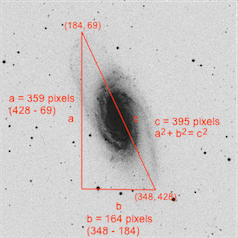
Right Ascension 9 : 32.2 (h:m); Declination +21 : 30 (deg:m)
Distance 20,500 (kly); Visual Brightness 8.9 (mag); Apparent Dimension 12.6 x 6.6 (arc min)
Taking the apparent dimension along the long axis of 12.6 arc min, and knowing there are approximately 0.00029 radians per arc min, we find that the scale for this telescope and detector is:
12.6 arc min x 0.00029 rads per arc min ÷ 395 pixels = 9.3 x 10⁻⁶ radians per pixel.
Given the distance of 20,500,000 ly or ~6.3 megaparsecs, and using the small angle formula, this gives an actual size for the galaxy of about 23 kpc, close enough to the 22 kpc we've assumed so far.
It is up to you to determine criteria for what defines the edge of the galaxy. Just be consistent from galaxy to galaxy! This may be a source of a systematic error in your lab.
Finding the recessional velocity of a galaxy
The velocity of a galaxy is measured using the Doppler effect. The radiation coming from a moving object is shifted in wavelength:
![]() [Eqn. (2)]
[Eqn. (2)]
where λtrue is the true wavelength of the radiation, λmeasured is the wavelength as measured at the telescope, making  the fractional value that the velocity of the galaxy is of the speed of light.
In this case, wavelengths are measured in Ångstroms (Å), an outdated unit equal to 1 ten-billionth of a meter (10-10 m). The speed of light has a constant value of ~300,000 km/sec. The quantity on the left side of equation (2) above is usually called the redshift, and is denoted by the letter z.
We can determine the velocity of a galaxy from its spectrum by measuring the wavelength shift of an absorption or emission line whose wavelength is known and solve for the velocity, v.
| Example: An absorption line is measured in the lab at 5000 Å. When analyzing the spectrum of a certain galaxy, the same line is found at 5050 Å. Knowing the speed of light, we calculate that this galaxy is receding at v = (50/5000) x c or approximately 3000 km/s. |
Procedure - PART I: Finding the value of the Hubble constant (two methods outlined)
Print out the Full-column data worksheet
You may choose to work alone or with a partner on the data gathering part of the exercise.
Select the galaxies you are going to work with further and find their angular sizes and thus their distances.
From images of the galaxies and the spectra, eliminate those galaxies that do not meet your criteria.
From the Galaxy List (http://www.astro.washington.edu/courses/labs/clearinghouse/labs/HubbleLaw/galaxies.html) choose a galaxy from your selected galaxies. You do not need to do any more work on those you threw out.
Find the angular size of the galaxy using its image.
Identify the long axis of the galaxy and then measure the angular size by clicking on each side of the galaxy image. After each click the web-page will report the x,y pixel coordinate that you clicked on. After you click the second point it will report the angular size of the galaxy in milliradians. If you make an error, make sure to click the try again link to reset the page.
The images used in this lab are negatives, so that bright objects, such as stars and galaxies, appear dark.
There may be more than one galaxy in the image; the galaxy of interest is always the one closest to the center.
To measure the size, click on opposite ends of the galaxy, at either end of the longest diameter. Try to find the farthest extents of the galaxy.
Record the stated angular size on your data sheet.
Repeat step c for all of your chosen galaxies.
To get the distance, we will assume that every galaxy is the same size in real life (this is a standard rod assumption and is pretty good for galaxies of the same type) - namely 22 kpc across. Since the angle subtended by distant galaxies is very small, we can use the small angle approximation. Find the distance for each galaxy in your sample. NOTE - if you keep the angle in units of milliradians and the size in units of kpc, then your distance will come out in units of Mpc (see "background and theory" section).
When you click on the galaxy's spectrum link, you will see the full optical spectrum of the galaxy at the top of the spectrum page. Below it are enlarged portions of the same spectrum, in the vicinity of some common spectral features. The small vertical bars near the lower left corners of these spectra indicate the true (rest) wavelengths of the lines. Do not click on these vertical bars as they are not the redshifted wavelengths!
Measure the shift in wavelength for three different lines for each galaxy. At least two are needed to get a good value, and three would be better. You should use the calcium (Ca II) K and H lines as well as the H-alpha line. The spectra link will take you to a page containing zoomed in sections of the galaxy’s spectra. On the left hand side you can find the calcium K and H lines.
The absorption lines due to calcium will be some of the strongest (deepest) of the spectral lines. At the bottom of the image are two black lines that show the actual position of where the calcium lines show up in laboratory spectra (that is, here on Earth). The wavelengths of these black lines are listed at the top of the spectra image. You will need to click on each of the red-shifted absorption lines in order to measure the wavelength at which these lines are observed in the galaxy.
You will also do the same thing on the right hand size in measure the hydrogen α line. Generally there are one or two strong emission lines to the right of the H-α laboratory wavelength. The line you want to measure is the one with the shortest wavelength (the bluest) of them.
Find the recessional velocity of the galaxy using its spectrum
Measure the redshifted wavelengths by clicking at the middle of the corresponding spectral line -- bottom of an absorption line, top of an emission line -- in each galaxy's spectrum. Record these numbers on the worksheet.
Repeat step 4 for all of your selected galaxies
Calculate the recessional velocity
To get the velocity, use your shifted wavelengths and the Doppler formula for the redshift (see "background and theory" section).
Find the redshift for ALL of the lines you measured (this means doing this calculation three times for every galaxy you selected ). Then average the redshifts and multiply the average times the speed of light ( 3×10⁵ km/s) to get the recessional velocity of the galaxy.
Plot the recessional velocity of each galaxy as a function of its distance
The Hubble constant is equal to the slope of this line. Draw a best fit line through your data to estimate the Hubble constant. Your line should go through (0,0). The slope of this line is your estimated value of the Hubble Constant.
Now estimate the associated uncertainty for the Hubble Constant. For the uncertainty, draw in the steepest and shallowest lines that still fit your data. Measure the slopes of the steepest and shallowest lines and average the difference between H and those two slopes (see the last page of the data table worksheet for the formula).
Quote your answer as H ± uncertainty in H.
Procedure - PART II: Age of the Universe (all methods converge here)
If the universe has been expanding at a constant speed since its beginning, the Universe's age would simply be 1/Ho.
Find the inverse of your value of Ho.
Multiply the inverse by 3.09 x 10¹⁹ km/Mpc to cancel the distance units.
Since you now have the age of the Universe in seconds, divide this number by the number of seconds in a year: 3.16 x 10⁷ sec/yr
| EXAMPLE: Your Hubble constant is 75 km/sec/Mpc, then: 1/75 = 0.0133 = 1.33 x 10⁻² |
Questions (Please copy and paste these questions into a word processor and type in your answers for each one before turning in to your TA. )
1. Please show sample calculations for one of your selected galaxies that displays the full logic for determining the distance to the galaxy, the redshifts for each of the 3 spectral lines, the average redshift, and the recessional velocity. If using the Excel or Google spreadsheet, make sure the values agree!
2. What are your values for the Hubble constant and the age of the Universe? Quantitatively (use ratios) compare your maximum age for the Universe to the age of the Sun (5 billion years), and to the age of the oldest stars in the Milky Way (approximately 12.5 billion years). Comment on your findings.
3. What happens to the calculated age of the Universe if the Hubble constant were to be larger than what you found here? How about for a smaller Hubble constant? (That is, would the age of the Universe increase or decrease if your constant were 85 km/sec/Mpc instead of 75 km/sec/Mpc? How about if your constant were 65 km/sec/Mpc instead of 75 km/sec/Mpc?)
4. Why does the best-fit line to your data need to go through the origin of your graph? Where is this "origin" located in the Universe?
5. The long-standing view of the universe before Edwin Hubble was that everything was standing still. Discuss how your analysis either supports or refutes this claim.
6. Which assumption that we made in this analysis do you think carries the most uncertainty? Do you think any error resulting from this uncertainty is enough to change your answer to question #3? Explain.
Theoretically, your plot should be a straight line, but it probably isn't. Let's consider a few of the possible sources of error.
7. The formula you used to determine the distances to these galaxies was distance = actual size of the galaxy divided by measured angular size: d = s / a. Is the distance calculated proportional to or inversely proportional to the actual size we assumed for the galaxies? How would an over-estimate or an under-estimate of the assumed actual diameter of a galaxy affect your estimate of the distance to it?
8. Is the distance calculated proportional to or inversely proportional to the angular size we measured for the galaxies? How would an over-estimate or an under-estimate of the measured angular diameter of a galaxy affect your estimate of the distance to it?
9. Pertaining to the previous question, what would be the effect on your value for the Hubble constant of your consistently under-measuring or over-measuring the angular diameter of the galaxies?
| Possible processes for answering question 8: You could combine two equations here, either mathematically or logically, and answer. Mathematically: d = s / a and v = Ho x d. Substitute “s / a” for d in the Hubble law, solve for Ho, and explain the result. Mentally: If you consistently under-measured the angular diameter, will the galaxies having a given recessional velocity be calculated to be nearer or farther? If you consistently over-measured the angular diameter, will the galaxies having a given recessional velocity be calculated to be nearer or farther? Relate how both of these scenarios would individually affect the Hubble's constant. |
10. Summarize what is meant by “Hubble's Law” and how the relationship was discovered. Include in your discussion here an explanation of the impact that the observations made by Edwin Hubble and by astronomers using the Hubble Space Telescope had on our view of the Universe. What is the currently accepted value for the Hubble constant? How does your value compare? Include any closing comments if you'd like. This is a writing exercise, so please express yourself clearly and concisely. Include a bibliography.
Congratulations. You have now earned your first cosmology badge!


