BUSINESS POLICY AND STRATEGY During Unit IV, VI, and VIII, you will be working on an implementation plan for a business. The components within these three units combined will create this plan. Please
Ford Motor Company, 2015www.ford.com, F
Headquartered in Dearborn, Michigan, Ford Motor Company is the second-largest U.S. automaker behind General Motors, but only the fifth-largest in the world based on vehicle sales. The company produces many different cars and trucks ranging from entry level to luxury cars. Ford’s F-150 pickup truck is the most popular truck in the world for 32 years running. Ford owns stakes in several car manufacturers around the world, including Aston Martin, Jiangling, Troller, and FPV. In the past, Ford has owned portions of Jaguar, Land Rover, and Volvo. In 2011, Ford discontinued its Mercury brand that had existed since 1938. In 2015, Ford switched the body of its famous F-150 to aluminum from steel. The extra cost was $395 per truck, but fuel economy improved with the reduced weight.
MyManagementLab®For additional assurance of learning questions which prove you understand and are able to apply the strategic concepts in this case, go to the assignment section of your MyLab.
Fords have been running fast lately. For Q2 of 2015, Ford reported excellent financial results, including the following:
Global market share grew to 7.6 percent, up one-tenth percent from a year ago.
Twelve of 16 planned global new product launches are completed; the remainder is on track.
Introduced SYNC® 3, the all-new communications and entertainment system.
Continued strong profit at Ford Credit; pre-tax profit of $506 million.
Ford Smart Mobility plan moved from research to the start of implementation.
Ford Credit launched car-sharing pilot in 6 U.S. cities and London.
Pre-tax profit of $2.9 billion, up $269 million or 10 percent from a year ago.
Net income of $1.9 billion, up $574 million or 44 percent from a year ago.
After-tax earnings per share of 47 cents, up 7 cents from a year ago.
Best company quarterly profit since 2000.
Wholesale volume up 2 percent, driven by North America and Europe.
Automotive revenue is about equal, with higher net pricing and volume offset by unfavorable translation effects of the strong U.S. dollar.
Copyright by Fred David Books LLC. www.strategyclub.com (Written by Forest R. David)
History
Ford traces its roots back to 1896 when Henry Ford built and marketed his first Quadricycle, a 4-wheel vehicle with a 4-horsepower engine. It was not until 1901, however, that Ford started his own car company, named the Henry Ford Company. He started Ford Motor Company in 1902 with 12 investors and $28,000 in cash. Interestingly, two of Ford’s first investors in his new company were John and Horace Dodge, who later would start their own car company, called Dodge. Ford had spent nearly the entire initial investment when his first car was sold in July 1903. It did not take Ford Motor Company long, though, to start making large profits. By October 1903, Ford had turned a profit of $37,000, indicating just how popular this new equipment was going to become. The company was incorporated in 1903.
Henry Ford is world famous for his assembly line, but for the first 10 years of the company, two to three men worked on each car, and the parts were supplied by outside firms. Ford produced the famous Model T in 1908 and sold over 15 million, until production ceased in 1927. To help maintain employee morale, Ford paid workers $5 per day in 1914, double the national average. In addition, Ford reduced the workday from 9 to 8 hours. Many of Ford’s workers could even afford a car they produced with the salary they earned.
In 1922, Ford acquired Lincoln Company and even began experimenting with aircraft production. In 1925, 2 years before selling the Model A automobile in 1927, Ford closed all plants for 6 months to retool and train employees on construction. By 1931, despite the great depression, Ford sold over 5 million Model A’s. Ford continued to grow over the next two decades, until its IPO in 1956, which was at the time the largest IPO in history.
In 2005, Ford, along with GM, had their corporate bonds downgraded to junk status. High health-care costs, rising gas, falling market share to foreign products, a demanding United Auto Workers (UAW) union, and lack of strategic planning all contributed to the downfall. In 2007, Ford reached an agreement with the UAW on retirement benefits and other costs. The company was able to avoid a government takeover, unlike its counterpart, General Motors. Over the last several years, Ford has rebounded and continues to produce quality automobiles worldwide, as well as more and more electric and part-electric vehicles.
Organizational Structure
As revealed in Exhibit 1, Ford operates using a divisional-by-geographic region organizational structure. Alan Mulally retired as CEO of Ford Motor Company on July 1, 2014, and was replaced by the then COO Mark Fields. In December 2014, the company hired a Chief Analytics Officer.
Exhibit 1 Ford’s Organizational Structure

Source: Based on information in Ford’s 2014 Annual Report.
Figure 1 Full Alternative Text
Vision/Mission
Ford does not have a published vision statement, but does have a stated mission statement, which is based on four key components and paraphrased as follows:
One Ford: Align employee efforts toward a common definition of success and optimize their collective strengths worldwide.
One team: Work together as one team to achieve automotive leadership, which is measured by the satisfaction of our customers, employees, and essential business partners, such as our dealers, investors, suppliers, unions/councils, and communities.
One plan: Aggressively restructure to operate profitably at the current demand and changing model mix.
One goal: Create an exciting and viable company delivering profitable growth for all.
Strategy
Since 2005, Ford’s warranty repairs have declined 66 percent for vehicles in the first 3 months of service with average warranty costs falling 54 percent. Ford has reduced its energy use, emissions, and waste in its factories and its vehicles. The new F-150 comes with a 2.7 liter V6 EcoBoost engine, giving it the same power as a V8, with much better fuel economy. Higher engine outputs with smaller displacements are a key initiative moving forward for Ford and greatly improve fuel economy and emissions. To improve safety, many Ford products now include Blind Spot Information Systems, lane alerts, and rear parking assistance.
In 2014, Ford launched more vehicles than ever before in a single calendar year, including a new Mustang and F-150. Ford is especially proud of offering its Mustang for the first time ever in select markets in Europe and Asia, and the F-150 moving to an aluminum body will save over 700 pounds on weight with the same material strength. Currently, Ford is engaged in its largest manufacturing expansion in over 50 years by increasing capacity in six U.S. plants and by opening two new plants in Asia and one each in South America and Europe. The U.S. plants alone are expected to enjoy $6 billion of improvements. In 2013, Ford sold over 85,000 hybrid or all-electric, plug-in automobiles, up 150 percent from 2012 as the company attempts to produce, as one executive said, a Tesla for the average person. As the average age of cars increases in the United States and abroad, Ford is aggressively launching new or significantly redesigned products. In 2014, Ford introduced 23 new vehicles, up from 11 in 2013, and plans to introduce a 150 percent new product turnover by 2018.
MarketingFord is unveiling a slew of new high-performance models, more than 12 new go-fast models coming to market by 2020, including a super-hot new Focus model, the RS. A new high-performance “Raptor” version of its new F-150 pickup could debut, and a new Ford sports car is coming. Fast, sexy sports cars (and trucks) make for great headlines and they help develop loyal customers. Products such as the V8-powered GT version of Ford’s Mustang sell well, but higher-performance models are typically niche products. That niche is growing—Ford recently reported that sales of high-performance models have risen 70 percent in the United States since 2009, and 16 percent in Europe over the same period—but it’s still small. High-performance versions of mainstream models generally make up less than 10 percent of the model’s total sales. Ford reports that more than 65 percent of those who buy its “hot-hatch” Focus ST and Fiesta ST models are new to the brand, and importantly, often become loyal customers “for life.”
SegmentsFord derives approximately 60 percent of its revenues from the United States, Canada, and Mexico. Virtually all the company’s profits in 2014 came from these countries; the only other profitable region was Asia. Ford is in the midst of a $400 million restructuring program in Europe and anticipates Europe will become profitable sometime in 2015. South America pretax profits were slightly negative and are expected to remain so the next several years. Brazil and Argentina are the strongest markets, with Venezuela being the weakest major market.
Ford reports revenues by five regions and by process: (1) vehicle sales and (2) financial services. In 2014, Ford reported $136 billion from vehicle sales and $8.2 billion from financial services. Pretax results were just over $2.5 billion, with vehicle sales and financial services accounting for $1.8 billion. It is important to note that Ford’s Pretax results were less than half the previous year for total automotive operations. See Exhibit 2.
| Exhibit 2 Segment Data for Ford (in millions of USD) | ||||||
|
| 2014 |
| 2013 | |||
|
| Revenue | Pretax Results |
| Revenue | Pretax Results | |
| North America | $82,400 | $6,898 |
| $86,500 | $8,809 | |
| South America | 10,800 | -1,162 |
| 8,800 | -33 | |
| Europe | 29,500 | -1,062 |
| 27,300 | -1,442 | |
| Middle East & Africa | 4,400 | -20 |
| 4,500 | -69 | |
| Asia Pacific | 10,700 | 589 |
| 10,300 | 327 | |
| Other Automotive | NA | -755 |
| NA | -656 | |
| Total Automotive minus Special Items | 135,782 | 2,548 |
| 139,369 | 5,368 | |
| Financial Services | 8,295 | 1,854 |
| 7,548 | 1,756 | |
Ford’s recent income statement and balance sheet are provided in Exhibits 3 and 4, respectively. Note the decline in revenues and the dramatic decline in net income.
| Report Date | 31-Dec-14 | 31-Dec-13 |
| Revenues | $144,077 | $146,917 |
| Operating expenses | 140,637 | 141,439 |
| EBIT | 3,440 | 5,478 |
| Interest expense | 797 | 829 |
| Interest & other income | 1,699 | 2,391 |
| EBT | 4,342 | 7,040 |
| Tax | 1,156 | -135 |
| Noncontrolling interest | -1 | -7 |
| Net income | 3,187 | 7,182 |
| Report Date | 31-Dec-14 | 31-Dec-13 |
| Assets | $10,757 | $14,468 |
|
| ||
| Cash and equivalents | ||
| Marketable securities | 20,393 | 22,100 |
| Accounts receivable | 92,819 | 87,309 |
| Inventories | 7,866 | 7,708 |
| Total current assets | 131,835 | 131,585 |
| Property, plant & equipment | 53,343 | 47,600 |
| Long-term investments | 3,357 | 3,679 |
| Goodwill & intangibles | — | — |
| Other assets | 19,992 | 19,315 |
| Total assets | 208,527 | 202,179 |
|
|
|
|
| Liabilities |
|
|
| Accounts payable | 20,035 | 19,531 |
| Total current liabilities | 20,035 | 19,531 |
| Long-term debt | 119,171 | 114,688 |
| Other liabilities | 44,174 | 41,517 |
| Total liabilities | 183,380 | 175,736 |
|
|
|
|
| Redeemable noncontrolling interest | 342 | 331 |
| Common stock | 40 | 40 |
| Retained earnings | 24,556 | 23,386 |
| Treasury stock | -848 | -505 |
| Pension & retirement losses and other | -20,032 | -18,231 |
| Paid in capital and other | 21,089 | 21,422 |
| Total equity | 24,805 | 26,112 |
|
|
|
|
| Total liabilities & equity | 208,527 | 202,179 |
Competition in the automobile manufacturing business is intense among Ford, GM, Toyota, BMW, Honda, Volkswagen, Hyundai-Kia, Nissan, Mercedes, and several other firms. About 75 percent of all revenue goes to purchase raw materials, so the industry is affected substantially by prices of steel, rubber, aluminum, and other raw materials. Wages, the second-largest expense, historically have been about $70,000 per employee in the United States and account for 5 percent of total revenue expenses. Higher commodity prices and wage expenses forced GM and Chrysler into Chapter 11 bankruptcies toward the end of the economic recession. However, labor expenses were reduced after labor unions agreed to concessions.
Competition among competing models of vehicles and competing firms primarily boils down to price, fuel economy, reliability, and utility. Business customers tend to focus on utility, whether it is a construction company that needs heavy trucks or a pharmaceutical business that provides cars to its salespeople. Most consumers, however, are more focused with styling and price, but there are many exceptions and subsets of each population.
The industry is experiencing increased globalization. Firms like Ford are offering new products in existing markets and expanding into new markets. Many Japanese manufacturers are gaining market share in the United States. There are high barriers to entry, which discourages new companies from trying to enter the industry.
Exhibit 5 shows the largest automakers in the world. Other notable firms were Fiat Chrysler, BMW, Daimler, and Mazda. Although no Chinese automaker is ranked in the top 10, from 13th to 30th, there are 10 Chinese firms represented. Exhibit 6 provides a synopsis comparison between Ford, GM, and Toyota.
Exhibit 5 Top Five Automobile Manufactures based on 2014 Units Sold (10 months data, in thousands) 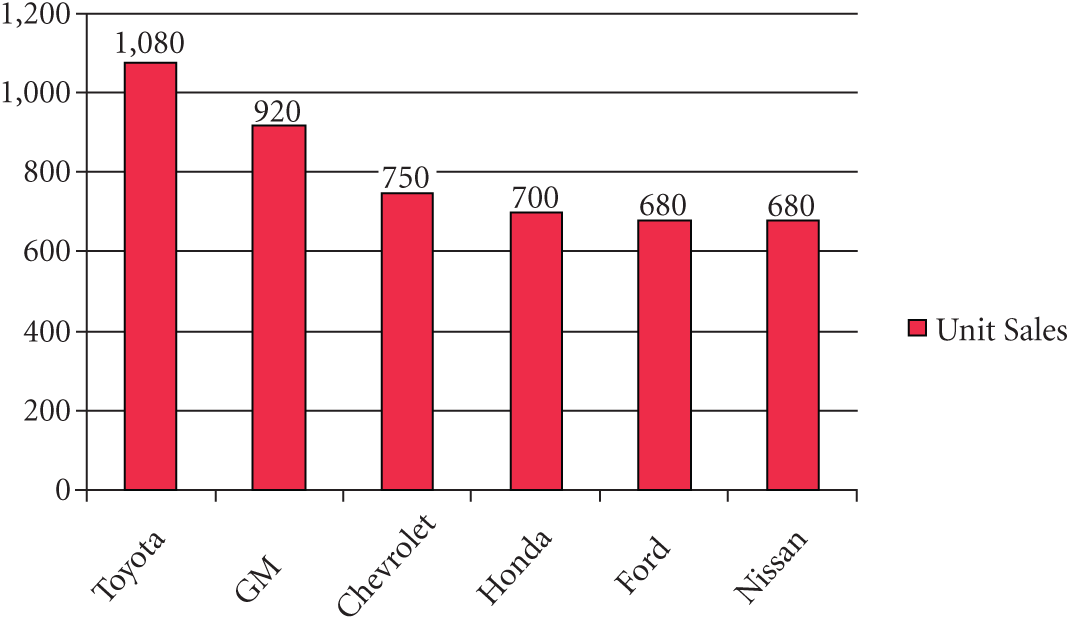
| Exhibit 6 Ford versus Rival Firms | |||
|
| Ford | GM | Toyota |
| # Employees | 187,000 | 216,000 | 339,000 |
| $ Net Income | 3,187 M | 3,949 M | 17,703 M |
| $ Revenue | 144,007 M | 155,929 M | 249,472 M |
| $ Revenue/Employee | 770,000 | 721,893 | 735,906 |
| $ EPS Ratio | 0.8 | 1.65 | 10.71 |
| Market Cap. | 63.4 B | 60.8 B | 213 B |
Headquartered in Detroit, Michigan, GM is the largest American car manufacturing company, ranking second behind Toyota in revenues and units of vehicles sold annually. GM brands include GMC, Chevrolet, Buick, Cadillac, Opel, Wuling, Jie Fang, and Alpheon, among many others. General Motors also holds stakes in and has joint ventures with firms in Korea and China. GM is investing heavily in its electric vehicle line, which totaled 7 vehicles in 2013, and has partnered with Honda to work on hydrogen cell technologies, with a 2020 timeframe for selling vehicles.
General Motors owns OnStar, which serves 6.5 million customers across North America with an assortment of services, including alerting First Responders to your location in an accident, as well as offering driving directions. With a new application for smartphones, OnStar can reveal your tire pressure, fuel levels, and even start your car remotely.
Exhibit 7 reveals GM unit sales across world markets. Europe remains a laggard in the world vehicle market, experiencing reduced sales for both Ford and GM. South America, while enjoying an increase in industrywide sales, reported fewer unit sales of GM vehicles in 2013.
| Exhibit 7 GM Segment Data (in units sold in thousands) | ||||||
|
| 2013 |
| 2012 | |||
|
| GMC Units | Industry Wide Units |
| GMC Units | Industry Wide Units | |
| North America | 3,324 | 19,092 |
| 3,019 | 17,847 | |
| Europe | 1,557 | 18,772 |
| 1,611 | 18,983 | |
| Asia/Pacific, Middle East, Africa | 3,886 | 40,795 |
| 3,616 | 38,229 | |
| South America | 1,037 | 5,936 |
| 1,051 | 5,849 | |
| World Wide | 9,715 | 84,595 |
| 80,908 | 9,297 | |
Headquartered in Aichi, Japan, with U.S. headquarters based in Torrance, California, Toyota is the largest automaker in the world in terms of revenues, and one of the largest in the U.S. market. Toyota sells vehicles in over 170 different nations and generated $214 billion in revenues over all operating segments in 2013. Popular vehicles sold in the United States include Lexus, Camry, Corolla, Avalon, Rav4, 4Runner, Land Cruiser, Tacoma, Tundra, Prius, and many others, including several mini-vans.
Exhibit 8 presents the segment data for Toyota based on geographic region. It is interesting to note that revenues were up 18 percent in 2013 but operating income was up 275 percent over the same time period. In particular, operating revenues in Japan increased substantially. Toyota reported increased sales in Europe over the same time frame when both Ford and GM had losses in Europe.
| Exhibit 8 Toyota Segment Data (in millions of USD) | ||||||
| Geographic Region | 2013 |
| 2012 | |||
| Revenue | Operating Income |
| Revenue | Operating Income | ||
| Japan | $106,414 | $4,784 |
| $92,689 | ($1,718) | |
| North America | 52,161 | 1,842 |
| 39,441 | 1,547 | |
| Europe | 17,290 | 220 |
| 16,550 | 148 | |
| Asia | 36,399 | 3,121 |
| 27,674 | 2,131 | |
| Other | 17,382 | 1,110 |
| 14,609 | 903 | |
| Intersegment elimination | -46,514 | -113 |
| -36,719 | -59 | |
| Totals | 183,133 | 10,963 |
| 154,244 | 2,952 | |
Headquartered in Seoul, South Korea, Hyundai-Kia is the second-largest automaker in Asia and the fourth largest in the world. The firm operates the single-largest automobile manufacturing plant in the world, in Uslan, South Korea, producing over 1.5 million vehicles annually. Hyundai has become the fastest-growing automaker in the world. With extended warranties common, Hyundai has gained loyalty and significantly increased its U.S. market share. The company reported revenues in 2014 of $8.4 billion. Popular cars include the Sonata, Santa Fe, Accent, Tucson, and the Rio and Optima by Kia.
External Issues
Vehicle Variety in the USA
Exhibit 9 reveals the percent of revenue of various classes of vehicle. Cross-over utility vehicles have taken much of the demand away from SUVs, which account for only 10 percent of total U.S. market share. These vehicles look much like an SUV, but are built on car chasses and lack the towing power of an SUV. They also tend to get much better gas mileage, as automakers started applying hybrid technology to cross-overs before SUVs. Notable SUVs include the Ford Flex, Toyota Venza, and Dodge Journey. The Ford Explorer has recently been shifted to become more of a SUV style along with several other popular SUV models.
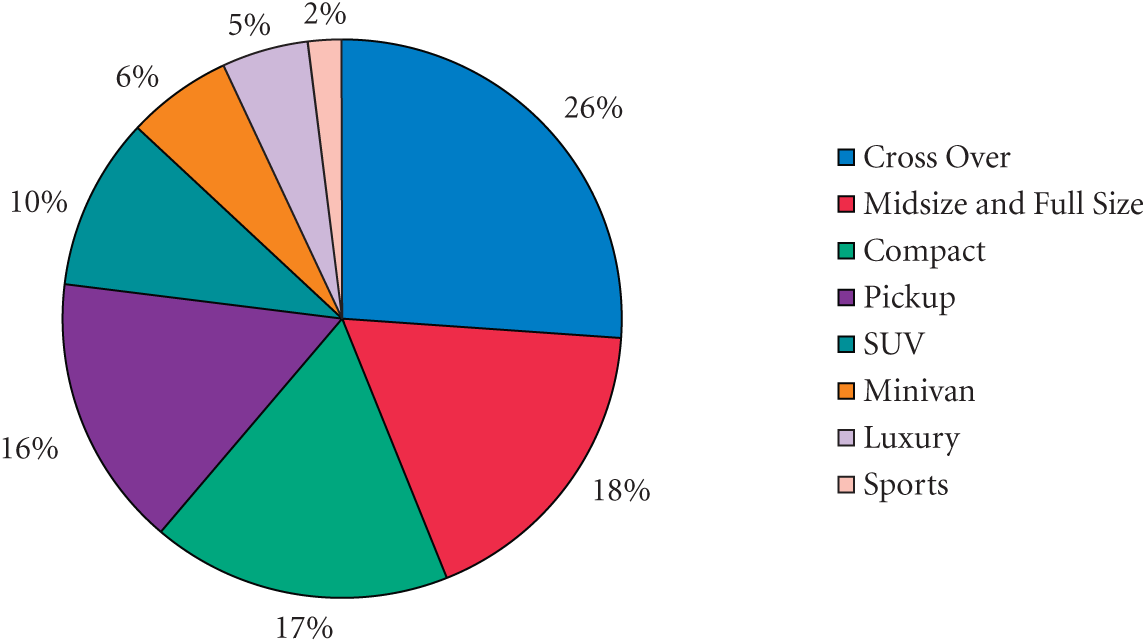
Exhibit 9 Breakdown on Market Share of Vehicles in the USA
Source: Adapted and consolidated from various IBIS reports.
Figure 9 Full Alternative Text
The next most popular style of vehicle in the United States is compact cars. Popular products in this line include the Ford Focus, Chevrolet Cruze, and the Toyota Corolla, and can start around $17,000. Smaller cars also popular include the Ford Fiesta and the Chevrolet Sonic which can start as low as $15,000. Many of these products are four-cylinders with some having the option of six cylinders. Midsize cars are also extremely popular, taking much of the market share away from larger vehicles. The Ford Fusion, Chevy Malibu, Dodge Charger, and Toyota Camry are examples of midsize vehicles. Full-size vehicles start around $30,000 with the Ford Taurus and Chevy Impala being two of the more popular options. Pickup trucks remain popular in the United States, with the F-150 the best seller in its class. Smaller size trucks such as the GMC Canyon or Chevy Colorado are not as popular as the full-size trucks. Ford’s 150 and 250, GMC’s Sierra, Chevy’s Silverado, Toyota’s Tundra, and Dodge’s Ram are all popular and dominate the U.S. truck market.
Mini-vans were once super-popular because they were considered much more sporty than a station wagon; however, mini-vans and full-size vans have experienced declining sales. This line of vehicles is most popular among taxi companies and families with kids. Luxury cars account for 5 percent of the total U.S. market share; popular brands include BMW, Lexus, Cadillac, Mercedes, and several others. Sports cars account for only 2 percent of total U.S. market share; they include cars such as the Mustang, Camaro, Dodge Charger, and Corvette.
International Vehicle Market
In 2013, China became the first country to have over 20 million vehicle deliveries in a single year, with 22 million units. As of late 2014, Chinese vehicle sales were up 8 percent over the record year in 2013. In total, China enjoyed a 28 percent share as compared to the U.S. 17.5 percent share in global vehicle sales in 2013; China expects to increase its global market share lead. China will continue to put pressure on U.S., European, and Japanese automakers as new Chinese-based auto companies are formed and grow to prominence. However, it is important to note that Ford did experience a 22 percent growth in China in 2013 (partly due to its relatively small 5 percent Chinese market share) and GM and Volkswagen each have 15 percent market share in China. Therefore, the large U.S. and European players are expected be a factor for many years to come, even in China. Demand in India has been slow, with a 3 percent decline in 2014.
Europe is starting to stabilize economically, although the euro continues to decline, losing 25 percent of its value to the dollar between 2008 and 2014, putting further pressure on U.S. car manufacturers. Ford has especially experienced difficulties in Europe recently with pretax losses in both 2013 and 2012. Ford’s European sales were estimated to be up 8 percent in 2014, showing improvement in the region even though Ford is expected to once again lose money in Europe in 2014. General Motors also has lost money in Europe in recent years. France remains the real laggard in western Europe with less than 2 percent vehicle sales growth. Eastern Europe exceeded a 9 percent decline and Russia nearly a 13 percent decline over 2013.
As a whole, South America experienced nearly 14 percent decline in automobile sales, with Brazil and Argentina each accounting for around a 13 percent decline in sales. Sales in other South American nations were potentially much worse, considering their economies are not nearly the size of either Brazil or Argentina.
Fuel Prices
A positive for American vehicle manufacturers is that gas prices as of November 2014 were averaging $2.92 in the United States and much less in some locales. The outlook in 2015 is for gas to remain below $3 per gallon. It remains to be seen how much further oil can fall, but the existing drop is substantial enough to help the auto industry in 2015. Oil prices fell nearly 50 percent from summer 2014 to year-end 2014. In 2014, sales of SUVs, mini-vans, and light-duty trucks increased nearly 10 percent, whereas growth for cars was below 2 percent.
High-Tech Vehicles
Many vehicles today come standard with power sockets, OnStar, XM radio, and built in Wi-Fi hotspots. These numerous extra features are all sources of profit for automakers. GM even has plans to introduce a self-driving Cadillac model in 2017, and Google claims to be in this business. Proponents of self-driving cars indicate they are safer and will save $1.3 trillion annually in the United States, along with fuel savings and fewer accidents. In addition, over $500 billion can be saved each year in productivity gains as people can work while commuting—if the driver can take his or her mind off the road completely.
Recalls and Fines
Vehicle recalls in the United States hit 22 million in 2013, a 9-year high. Hit especially hard by the recalls were Toyota, Chrysler, and Honda, accounting for 24, 21, and 13 percent of all recalls, respectively. Ford, BMW, Toyota, and several other vehicle manufacturers are recalling products containing airbags manufactured by Takata Corporation after five deaths were linked to them. As of October 2014, a class-action suit has been filed in U.S. court against Takata and several unstated automobile manufacturers. Recalls continued their upward trend in 2014 as well, resulting in billion-dollar penalties, including a $1.2 billion penalty on Toyota in 2014. Through only half of 2014, recalls were up 70 percent over the total recall amounts in all of 2013.
Access to Vehicle Loans
As of August 2014, the total balance on auto loans in the United States was $924 billion, an all-time high, and up 11 percent from the previous year. In addition, the number of delinquent auto loans has been falling, and are expected to continue to do so through 2015. Rates are slowly going up and currently are around 4.5 percent for new cars and 8.8 percent for used cars as of 2014. The lower rates and easy access to loans has been great for automakers. The average car price in 2008 was $25,000; in 2014, the average was over $33,000. Also, a strong used-car market has helped new car sells as well.
Production in North America
As wage differences around the world shrink, there is increasing attractiveness to locate manufacturing facilities back in the United States and Mexico. Factories are closer to the market, which reduces shipping costs and there is more control over operations. In 2013, GM committed to invest $16 billion in the United States over the next 3 years and Ford planned to invest $6 billion. Kia recently spent $1.5 billion in Mexico and another $10 billion is expected to be spent in Mexico from BMW, Toyota, and Daimler AG.
FutureIn early 2015, Ford started production of two new engines—the 2.0-liter and 2.3-liter EcoBoost engines—for its plant in Cleveland. The 2.0-liter engine will be available in the Ford Edge. The 2.3-liter engine will be available in the Ford Mustang, Ford Explorer, and Lincoln MKC. However, for the most recent month (February 2015) available at the time this case was written, Ford reported a 1.9 percent decline in sales in the United States to 180,383 units. Ford brand’s sales fell 1.7 percent to 174,219 units in the month, and Lincoln brands dropped 7.5 percent to 6,164 units. All total for the month, sales of Ford cars and utility vehicles fell 8.1 and 2.3 percent to 56,081 and 54,420 units, respectively. However, Ford’s truck sales increased 4 percent, led by a 24.6 and 18.7 surge in sales of the Transit Connect and heavy trucks, respectively. Retail sales of the F-series fell 1.2 percent in February. Even Ford’s two most popular two vehicles, the Focus and the Fusion, recorded a year-over-year decline in sales. The Ford Escape reported a 9.6 decline in sales for the month. A bright spot was the Ford Explorer had a 31.8 percent surge in sales in February 2015. Ford Mustang was the company’s only car that reported higher sales during the month, increasing 31.9 percent to 8,454 units in February, making it the Mustang’s best February sales since 2007. Since the launch of the new Mustang model, it has been the highest-selling sports car in America. But overall in February 2015, compared to the prior year period, Ford shareholders were not pleased with all the declines. Develop a 3-year strategic plan for Ford’s new CEO, Mr. Mark Fields.


