Southern States Cooperative ApplicationOverview Assume that you have been hired as a business intelligence consultant for Southern States Cooperative, where you will be analyzing the use of business i
Southern States Cooperative Application
Overview
Assume that you have been hired as a business intelligence consultant for Southern States Cooperative, where you will be analyzing the use of business intelligence and analytics for their farmer-owned cooperatives in the United States. Using the End of Chapter Application Case: Southern States Cooperative Optimizes Its Catalog Campaign, from this unit's readings, as a basis for your assignment, write a 7–8 page paper including graphics addressing how analytics can be used in their business.
Directions
Write a 7–8 page paper including graphics that summarizes your conclusions. Include the following in your paper:
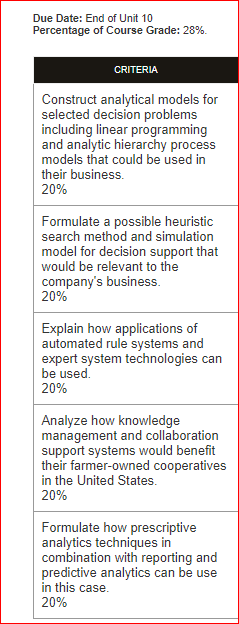
Formulate how prescriptive analytics techniques in combination with reporting and predictive analytics can be use in this case.
Construct analytical models for selected decision problems including linear programming and analytic hierarchy process models that could be used in their business.
Formulate a possible heuristic search method and simulation model for decision support that would be relevant to the company's business.
Explain how applications of automated rule systems and expert system technologies can be used.
Analyze how knowledge management and collaboration support systems would benefit their farmer-owned cooperatives in the United States.
You can use concepts from the "Southern States Cooperative Optimizes Its Catalog Campaign" case to make any assumptions about the needs of the business you are addressing.
Submission Requirements
As you complete your assignment, be sure your paper meets the following guidelines:
Written communication: Writing is free of errors that detract from the overall message.
Scholarship: Use at least five outside sources to support your main points and analysis, which includes at least two of the required scholarly article readings from this course.
APA formatting: All resources and citations should be formatted according to current APA style and formatting guidelines.
Length: 7–8 typed, double-spaced pages.
Font: Times New Roman, 12 point.
Southern States Cooperative Optimizes Its Catalog Campaign
Southern States Cooperative is one of the largest farmer-owned cooperatives in the United States, with over 300,000 farmer members being served at over 1,200 retail locations across 23 states. It manufactures and purchases farm supplies like feed, seed, and fertilizer and distributes the products to farmers and other rural American customers.
Southern States Cooperative wanted to maintain and extend their success by better targeting the right customers in its direct-marketing campaigns. It realized the need to continually optimize marketing activities by gaining insights into its customers. Southern States employed Alteryx modeling tools, which enabled the company to solve the main business challenges of determining the right set of customers to be targeted for mailing the catalogs, choosing the right combination of storage keeping units (SKUs) to be included in the catalog, cutting down mailing costs, and increasing customer response, resulting in increased revenue generation, ultimately enabling it to provide better services to its customers.
SSC first built a predictive model to determine which catalogs the customer was most likely to prefer. The data for the analysis included Southern States’ historical customer transaction data; the catalog data including the SKU information; farm-level data corresponding to the customers; and geocoded customer locations—as well as Southern States outlets. In performing the analysis, data from one year was analyzed on the basis of recency, frequency, and monetary value of customer transactions. In marketing, this type of analysis is commonly known as RFM analysis. The number of unique combinations of catalog SKUs and the customer purchase history of particular items in SKUs were used to predict the customers who were most likely to use the catalogs and the SKUs that ought to be included for the customers to respond to the catalogs. Preliminary exploratory analysis revealed that all the RFM measures and the measure of previous catalog SKU purchases had a diminishing marginal effect. As a result, these variables were natural-log transformed for logistic regression models. In addition to the logistic regression models, both a decision tree (based on a recursive partitioning algorithm) and a random forest model were also estimated using an estimation sample. The four different models (a “full” logistic regression model, a reduced version of the “full” logistic regression model based on the application of both forward and backward stepwise variable selection, the decision tree model, and the random forest model) were then compared using a validation sample via a gains (cumulative captured) response chart. A model using logistic regression was selected in which the most significant predictive factor was customers’ past purchase of items contained in the catalog.
Based on the predictive modeling results, an incremental revenue model was built to estimate the effect of a customer’s catalog use and the percentage revenues generated from the customer who used a particular catalog in a particular catalog period. Linear regression was the main technique applied in estimating the revenue per customer responding to the catalog. The model indicated that there was an additional 30 percent revenue per individual who used the catalog as compared to the non-catalog customers.
Furthermore, based on the results of the predictive model and the incremental revenue model, an optimization model was developed to maximize the total income from mailing the catalogs to customers. The optimization problem jointly maximizes the selection of catalog SKUs and customers to be sent the catalog, taking into account the expected response rate from mailing the catalog to specific customers and the expected profit margin in percentage from the purchases by that customer. It also considers the mailing cost. This formulation represents a constrained non-linear programming problem. This model was solved using genetic algorithms, aiming to maximize the combined selection of the catalog SKUs and the customers to whom the catalog should be sent to result in increased response, at the same time increasing the revenues and cutting down the mailing costs.
The Alteryx-based solution involved application of predictive analytics as well as prescriptive analytics techniques. The predictive model aimed to determine the customer’s catalog use in purchasing selected items and then prescriptive analytics was applied to the results generated by predictive models to help the marketing department prepare the customized catalogs containing the SKUs that suited the targeted customer needs, resulting in better revenue generation.
From the model-based counterfactual analysis of the 2010 catalogs, the models quantified that the people who responded to the catalogs spent more in purchasing goods than those who had not used a catalog. The models indicated that in the year 2010, targeting the right customers with catalogs containing customized SKUs, Southern States Cooperative would have been able to reduce the number of catalogs sent by 63 percent, while improving the response rate by 34 percent, for an estimated incremental gross margin, less mailing cost, of $193,604—a 24 percent increase. The models were also applied toward the analysis of 2011 catalogs, and they estimated that with right combination and targeting of the 2011 catalogs, the total incremental gross margin would have been $206,812. With the insights derived from results of the historical data analysis, Southern States Cooperative is now planning to make use of these models in their future direct-mail marketing campaigns to target the right customers.
What We Can Learn from This End-of-Chapter Application CasePredictive models built on historical data can be used to help quantify the effects of new techniques employed, as part of a retrospective assessment that otherwise cannot be quantified. The quantified values are estimates, not hard numbers, but obtaining hard numbers simply isn’t possible. Often in a real-world scenario, many business problems require application of more than one type of analytics solution. There is often a chain of actions associated in solving problems where each stage relies on the outputs of the previous stages. Valuable insights can be derived by application of each type of analytic technique, which can be further applied to reach the optimal solution. This application case illustrates a combination of predictive and prescriptive analytics where geospatial data also played a role in developing the initial model.


