VI. Assignment Questions: Use the PowerPoint template to answer the two questions, do not make nay change to the excel file I have attached. The answers are already provided based on the excel sheet.
Green Mills Aggregate Planning
Sales and Operations Planning (S&OP) Team
Utilize Aggregate Planning as a tool to compare and contrast various S&OP design strategies. In the competitive environment that exists today, firms need to constantly evaluate their supply chains and determine methods to be more responsive and efficient.
Evaluate and quantify (where possible) the plans you develop.
You are to develop a Professional PowerPoint slide presentation that engages your audience to accept your proposal.
II. Assignment Overview:
Green Mills is currently considering an aggregate plan for next year. This plan is given in “V. Example of Green Mills “Proposed Plan” and is shown below. It will be referred to as “The Proposed Plan.”
Based on the assignment questions you are to develop two alternative plans…
A “Level Plan"
A plan that must have a lower total cost than the “Proposed Plan.”
Linear programming (for example Excel Solver) cannot be used for any of the work associated with this assignment. You will utilize this approach in other courses.

Do not leave the instructor guessing on the meaning of a particular slide. You might think of the notes as containing material you would verbalize when presenting your slides. Please, do not write volumes in the notes section. Be concise but clear on the meaning of each slide. All your extra information about a particular slide must fit on that 8.5 by 11 portrait version of the “Notes” page for a particular slide. Also do not re-write the question on the notes slide. Please just write either Q1, Q2, Q3, etc. at the top of the notes section.
When you are asked to make a choice or take a position in answering a question, be certain to present the argument or justification for your choice. In support of your position, it is often useful to draw on the literature that you have read for the course.
Note: Arguments can be used to positively affirm a particular position as well as to indicate that alternatives are not worthy of support. In other words, sometimes you can support a position by effectively arguing against other alternatives.
Place citations on the slides as needed that illustrate the problems/questions/goals/objectives, etc. you are trying to obtain.
The actual document in PPT type file extension. These will include use of the ‘notes’ portion. No pdf file extensions.
An Excel Workbook showing your financial calculations one showing the level plan the other showing the mixed plan. No pdf file extensions.
IV. Helpful Hints:
A. General constraints and inputs:
B. Guidance on specific questions:
Level Strategy:
Initial staffing level is 20 employees (FTE)
Initial Inventory is 0 board feet
Aim to minimize the final inventory while remaining within the constraints and minimizing cost
Inventory from Chile needs to be shipped at $50/1000bf
We are not considering any backordering in this case
Strategy That Has A Total Lower Cost Than the “Proposed Plan”:
Initial staffing level is 20 employees (FTE)
Initial Inventory is 0 board feet
Shipping cost is not necessary to include for subcontracted production. It’s included in the subcontractor rate
We are not considering any backordering in this case

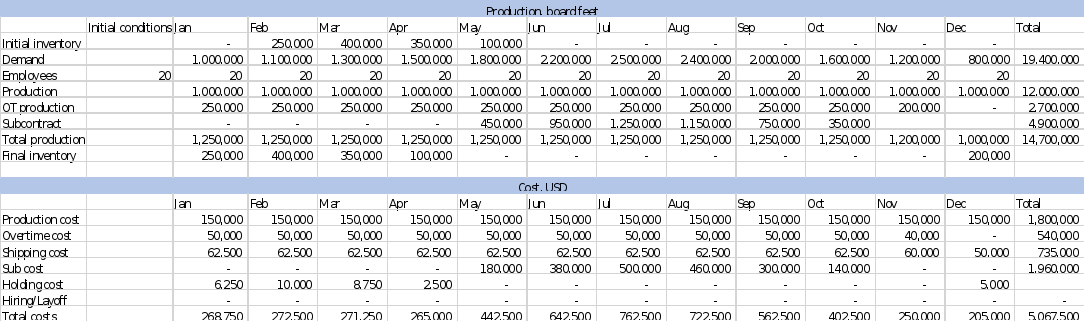
V. Example of Green Mills “Proposed Plan”:
This Excel Spreadsheet shows the “Proposed Plan” that Green Mills is considering using for this upcoming year.
VI. Assignment Questions:
Please answer the following questions in your slides:
Create a seven-slide professional business PowerPoint presentation, which communicates succinct and concise analysis and recommendations (Remember: some supervisors will not read beyond the headline of each slide). One slide should be dedicated to each question below and one slide should be dedicated to an overall synthesis and recommendation. The ‘notes’ section should be utilized to provide further detail and context to the slides. Note the slides above do not include the agenda, objective nor the summary slide.
Graph the demand over time (Demand and Total Production on y-axis, January through December; Time by month on x-axis). Place both the Level Plan and your team’s proposed plan on the same graph. What does this graph tell you…Explain! This question has two parts: (5 points)
The actual graph
The explanation of what it tells you.
This question has two parts: (5 points)
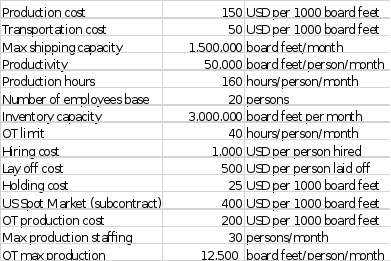
List all costs and their values that your team used in your calculations.
For example, Production costs, $150 per 1000 board feet
List all constraints the case has placed on the calculations
For example, Maximum shipping capacity, 1500000 board feet per month


