Hello, I need someone to take my Midterm online, I will give you further infomation about it. Thank you, regards
Module 2 Key Points
Chapter 5: The Stock Market
Private Equity versus Selling Securities to the Public
Private Equity
Private Equity refers to the rapidly growing area of equity financing for nonpublic companies.
The Structure of Private Equity Funds
There are many similarities to hedge funds (high water mark, fee structure, partnership, etc.). The main difference is that the fund invests in private companies, typically using convertible securities (like preferred stock) to minimize risk and keep upside potential.
One added feature of performance compensation is a clawback, which means any prior performance fees must be returned if subsequent losses occur.
Types of Private Equity
Venture Capital: financing for new, often high-risk ventures.
Middle Market: smaller, established companies (often family owned)
Leveraged Buyouts: taking firms public
Selling Securities to the Public
In the primary market, companies issue new securities to raise money. In the secondary market, investors constantly appraise the values of companies by buying and selling shares previously issued by these companies.
The Primary Market for Common Stock
The market in which new securities are originally sold to investors.
Initial public offering (IPO): An initial public offer occurs when a company offers stock for sale to the public for the first time.
Seasoned equity offering (SEO): The sale of additional shares of stock by a company whose shares are already publicly traded.
General cash offer: An issue of securities offered for sale to the general public on a cash basis.
Rights offer: A public issue of securities in which securities are first offered to shareholders.
Investment banking firm: A firm specializing in arranging financing for companies.
Underwrite: To assume the risk of buying newly issued securities from a company and reselling them to investors.
Underwriter spread: Compensation to the underwriter, determined by the difference between the underwriter’s buying price and offering price.
Syndicate: A group of underwriters formed to share the risk and to help sell an issue.
Firm commitment underwriting: A type of underwriting in which the underwriter buys the entire issue, assuming full financial responsibility for any unsold shares.
Best efforts underwriting: The underwriter sells as much of the issue as possible, but can return any unsold shares to the issuer without financial responsibility.
Dutch auction underwriting: The offer price is set based on competitive bidding by investors.
Securities and Exchange Commission (SEC): Federal agency charged with enforcing U.S. securities laws and regulations.
Prospectus: Document prepared as part of a security offering detailing a company's financial position, operations, and investment plans for the future.
Red herring: A preliminary prospectus not yet approved by the SEC.
Securities are first bought and sold in the primary market, both through IPOs and as seasoned security offerings. The investment banking firm establishes the financing package, advises on the pricing and number of shares, and arranges distribution of the shares. The underwriter spread, the "mark-up" on the stock price, is the basic part of the underwriter's compensation. The stock may be distributed as a fixed commitment, or on a best effort's basis. All issues must be approved by the SEC, with the prospectus being issued to investors prior to sale of the stock. To advertise the issue, a tombstone advertisement will usually appear in the Wall Street Journal or another financial publication.
The Secondary Market for Common Stock
In the secondary market investors buy and sell shares with other investors. Secondary market trading is directed through three channels:
Directly with other investors
Indirectly through a broker who arranges transactions for others
Directly with a dealer who buys and sells securities from inventory
Dealers and Brokers
Dealer: A trader who buys and sells securities from inventory.
Broker: An intermediary who arranges security transactions among investors.
Bid price: The price a dealer is willing to pay.
Ask price: The price at which a dealer is willing to sell. Also called the offer or offering price.
Spread: The difference between the bid and ask prices.
A dealer maintains an inventory and stands ready to buy and sell at any time. The dealer maintains an inventory to accommodate order imbalances. The dealer is willing to pay the bid price and will sell at the ask price. The difference is the bid-ask spread. The dealer profits through strategically setting the spread. The broker brings together buyers and sellers, but does not maintain an inventory. The broker facilitates trades by others.
The largest secondary market is the NYSE, with the Chicago Stock Exchange and the American Stock Exchange as 2nd and 3rd. The major competitor to these organized exchanges is the Nasdaq. The Nasdaq merged with the American Stock Exchange in 1998.
It is useful to point out that the bid-ask spread is not fixed, but changes frequently. Two important factors in determining the spread are the perceived risk and the volume. Dealers will typically increase the spread when the perceived risk is higher, and decrease the spread when the risk is lower.
The New York Stock Exchange
The NYSE was 200 years old in 1992. For more than 200 years, the NYSE operated as a not-for-profit corporation owned by its members, the securities firms and brokerage companies. On March 8, 2006, the NYSE went public (ticker NYX) and is now a publicly traded for-profit corporation. On April 4, 2007, NYSE Holdings merged with Euronext N.V. and launched NYSE Euronext. NYSE Euronext is currently the world’s largest exchange.
NYSE Membership History
NYSE exchange member: As of 2006, the owner of a trading license on the NYSE is an exchange member.
Historically, the NYSE had 1,366 members who “owned” seats on the exchange. Seat owners could buy and sell securities on the exchange floor with no commission. Since 1929, the lowest seat price paid was $55,000 (1977). In 2005, a seat sold for a record price of about $4 million. In 2006, all of this changed when the NYSE became a publicly owned corporation called NYSE Group, Inc. Its stock listed on the NYSE. Now, instead of purchasing seats, exchange members must purchase trading licenses, the number of which is limited to 1,500. In 2009, a license would set you back $44,000 per year. Before the NYSE went public, NYSE members collectively owned the exchange. Today, the shareholders own the exchange. At the end of 2009, the NYSE had about 260 million shares outstanding.
Designated Market Makers
Specialist: NYSE member acting as a dealer on the exchange floor. They are often called market makers. The role of a traditional specialist has been phased out and replaced by two types of designated market makers:
Designated Market Maker (DMM): assigned a set of securities and obligated to maintain a fair and orderly market. DMMs, however, face fewer trading restrictions than specialists did.
Supplemental Liquidity Provider (SLP): located away from the exchange and have fewer price posting requirements, but are similar in that they provide market liquidity.
Other NYSE Participants
Commission brokers: Agents who execute customer orders to buy and sell stock transmitted to the exchange floor. Typically they are employees of NYSE member firms.
Floor brokers: NYSE members who execute orders for commission brokers on a fee basis. They are sometimes called two-dollar brokers.
SuperDOT system: Electronic NYSE system allowing orders to be transmitted directly to specialists for immediate execution.
Floor traders: NYSE members who trade for their own accounts, trying to anticipate and profit from temporary price fluctuations.
Commission brokers execute customer orders to buy and sell stocks, and are typically employees of NYSE member brokerage firms. Their responsibility is to get the best possible price for their customers. There are more than 500 NYSE commission brokers.
DMMs act as an assigned dealer for a small set of securities. DMMs are also called market makers, and they are assigned the responsibility of maintaining a fair and orderly market in a security. They make a market by standing ready to buy at bid prices and sell at ask prices, acting as dealers for their own accounts. They also maintain an inventory in the security, and provide liquidity to the market.
Floor brokers are often used by commission brokers when they are too busy to handle the orders themselves. Floor brokers are also called "two-dollar" brokers because many years ago their fee was two dollars. The Super Display Book (SDBK) system, connected to the Arca, allows orders to be transmitted electronically and accounts for a substantial percentage of all trading. Floor traders independently trade for their own account and try to profit from short-term price fluctuations. The number of floor traders has declined in recent years.
The NYSE Hybrid Market
Hybrid trading combines the exchange’s automated technology with the advantages of an auction market. In the Hybrid market, DDMs and floor brokers interact with the market electronically as well as in person. This market allows investors to automatically execute up to 1 million shares.
NYSE-Listed Stocks
There is an initial listing fee, and an annual listing fee that must be paid by firms on the NYSE. Some example minimum requirements by the NYSE in 2010 included:
Total shareholders must be at least 2,200, with 100,000 shares traded a month on average for the most recent six months.
At least 1.1 million shares must be held by the public.
Publicly held shares must have at least $100 million market value ($40 million for IPOs).
Company must have annual earnings of $10 million before taxes in the previous three years, and $2 million in each of the preceding two years.
Operation of the New York Stock Exchange
The business of the NYSE is to attract and process order flow, the flow of customer orders to buy and sell stock. In 2010, trading volume regularly reached 2 billion shares per day. About one-third of the trading volume is attributable to individual investors, and almost half is derived from institutional investors.
NYSE Floor Activity
DDM post: Fixed place on the exchange floor where the DDM operates.
Market order: A customer order to buy or sell securities marked for immediate execution at the current market price.
Most of the activity on the floor of the exchange takes place around the DDM’s post. The clerks operate behind the counters, and the commission brokers receive customer orders and walk to the DDM's post to execute the orders. When a customer issues a market order, they want to buy or sell at the current market price, with the order marked for immediate execution. The broker will try to get the best price possible.
Special Order Types
Limit order: Customer order to buy or sell securities with a specified "limit" price. The order can be executed only at the limit price or a better price.
Stop order: Customer order to buy or sell securities when a preset "stop" price is reached.
Stop-limit order: Customer order to buy or sell securities when a preset “stop” price is reached, with an additional restriction that a specified “limit” price cannot be violated.
Many NYSE orders are limit orders, where a customer specifies a maximum price to pay (buy order) or minimum price to accept (sell order). The customer is not willing to accept any price above (buy) or below (sell) the specified price. A stop order specifies a "stop" price, which is a trigger price for the order to be converted into a market order. The stop order does not place a maximum or minimum limit on the trade price. Once converted to a market order, the trade is executed like any other market order.
Nasdaq
Nasdaq stands for National Association of Securities Dealers Automated Quotations system. In terms of dollar volume the NYSE is larger, but in terms of share volume the Nasdaq is larger.
Nasdaq Operations
Over-the-counter (OTC) market: Securities market in which trading is almost exclusively done through dealers who buy and sell for their own inventories.
The Nasdaq is a network of securities dealers who disseminate timely security price quotes to Nasdaq subscribers. The dealers post bid prices and ask prices as well as the number of shares they are willing to trade at the quoted prices. Nasdaq market makers trade on an inventory basis, but there are multiple market makers for actively traded stocks. The Nasdaq market is an OTC market, although they are trying to lose that name. The two key differences between the NYSE and Nasdaq are:
Nasdaq is a computer network with no physical location.
Nasdaq has a multiple market maker system, rather than a specialist system.
Nasdaq is managed by the NASD. Every broker or dealer in the U.S. that conducts a securities business must be a member of the NASD.
Nasdaq Participants
The NASDAQ has historically been a dealer market, characterized by competing market makers. In 2010, almost 4,000 companies were listed on the NASDAQ system, with an average of about a dozen market makers for each security.
In the late 1990s, the Nasdaq system was opened to the so-called electronic communications networks (ECNs). ECNs are basically websites that allow investors to trade directly with one another. As a result, individual investors can enter orders (not just market markers). Hence, ECNs act to increase liquidity and competition. In 2003, about 10 ECNs were integrated into the Nasdaq.
The Nasdaq network provides bid and ask prices as well as recent transaction information. The bid and ask prices for the Nasdaq represent inside quotes. That is, they are the highest bid and the lowest ask.
For a small fee, you can have access to “Level II” quotes. With Level II quotes, you can see all bids and asks. Frequently, the identity of the market maker is also displayed.
The Nasdaq National Market (NNM) was introduced in 1982 as the National Market System (NMS).
It is no longer every firm's goal to be eventually listed on the NYSE—the Nasdaq is now an attractive competitor to the NYSE.
NYSE and Nasdaq Competitors
Third market: This term refers to trading in exchange-listed securities that occurs off the exchange on which the security is listed.
Fourth market: This term refers to direct trading of exchange-listed securities among investors. (A good example is the ECN, Direct Edge.)
The NYSE and Nasdaq face competition from the third market, the fourth market, and regional exchanges. One example is Instinet, an electronic trading network that facilitates trading among its subscribers. Nasdaq has SelectNet, which has not been as popular as Instinet. Thousands of stock issues are dually listed on the NYSE or Nasdaq, and on a regional exchange.
Stock Market Information
The Dow Jones Industrial Average
The Dow Jones Industrial Average (DJIA) or "Dow" is the most widely followed barometer of daily stock market activity. The DJIA is an index of 30 large "blue-chip" companies representative of American industry. Two other Dow averages include the utilities and transportation averages.
Stock Market Indexes
Price-weighted index: Stock market index in which stocks are held in proportion to their share price.
Value-weighted index: Stock market index in which stocks are held in proportion to the aggregate market value.
Stock indices can be calculated as price-weighted indices or value-weighted indices. To compute a price weighted index, take the price of each stock in the index, add them up, and divide by the number of stocks. It is basically a simple average. To compute a value-weighted index, multiply the number of shares of each stock in the index by the corresponding share price, and sum the products to give the total market value. Then divide this total market value by the latest index divisor to give the index value. The initial index divisor is the initial (base period) total market value divided by the desired initial index value. The divisor changes as stocks are added to or deleted from the index.
More on Price-Weighted Indexes
The price-weighted index has some problems. Since it is a simple average of the share prices of the stocks in the index, the value can be unduly influenced by the price changes of one high-priced stock. Also, the index must be adjusted for stock splits and stock dividends. This tends to cause the divisor to change, in fact decrease, over time.
The Dow Jones Divisors
As of November 20, 2009, the DJIA divisor was a nice, round 0.132319125. A divisor that is less than one will further magnify any price change effects. This is one reason we see such large swings in the DJIA.
More on Index Formation: Base-Year Values
Index staleness: Condition that occurs when an index does not reflect all current price information because some of the stocks in the index have not traded recently.
If there are problems with price-weighted indices, why do we continue to follow the DJIA? The answer is tradition. The most popular alternative to the DJIA is the value-weighted S&P 500 index, which provides frequent accurate updates of market prices. This index accounts for a major portion of overall stock market value with its representative 500 stocks.
Chapter 6: Common Stock Valuation
Security Analysis: Be Careful Out There
Fundamental analysis: Examination of a firm's accounting statements and other financial and economic information to assess the economic value of a company's stock.
The basic premise of investment is to identify undervalued stocks to purchase and overvalued stocks to sell. On the surface many stocks that appear cheap may be correctly priced, due to reasons not immediately apparent. An analyst must be willing to investigate deeper. This chapter discusses fundamental analysis; using the firm's financial and economic information to assess the value of a company's stock.
The Dividend Discount Model
Dividend discount model (DDM): Method of estimating the value of a share of stock as the present value of all expected future dividend payments.
A basic principle of finance holds that the economic value of an investment is measured by the sum of the present value of all expected future cash flows. These cash flows must also be adjusted for risk. The dividend discount model does this by taking the sum of the present value of all expected future dividends. This model is general in that it allows the annual dividend to differ from year-to-year. The DDM model is written as the sum of the following discounted cash flows:

One way of explaining this model is to assume that dividends go on forever (which they do), so an analyst must take the sum of the present value of all expected future dividends, which continue on to perpetuity. The problem is that dividends are assumed to change over time. An acceptable assumption is that an investor will sell the stock after "T" years. This simplifies the model such that one can calculate the sum of the present value of expected future dividends for "T" years, and then add the present value of the expected stock price in year "T." This estimated future stock price in year "T" contains the value of all expected future dividends and allows an easily calculated solution.
Constant Perpetual Growth
Constant perpetual growth model: a version of the dividend discount model in which dividends grow forever at a constant growth rate. Here, the growth rate is strictly less than the discount rate.
 The constant growth rate model simplifies dramatically when we assume perpetual dividends. Note that an important assumption of this model is that g<k. The model is as follows:

It is important to point out what happens when g is greater than k. When it is noted that a high growth rate may be an indication of a risky firm, this then reflects on the estimate of the required return. How can a firm have both a high growth rate and a low required return? We can then assume that our estimate of growth or required return may not be correct.
The simplicity of the constant perpetual growth model makes it very attractive. However, one must remember that given its assumptions, it should only be applied to firms with stable earnings and whose dividend growth is expected to continue into the future. The analyst should also be aware that changing the assumed value of g or k can dramatically change the estimated stock price.
Historical Growth Rates
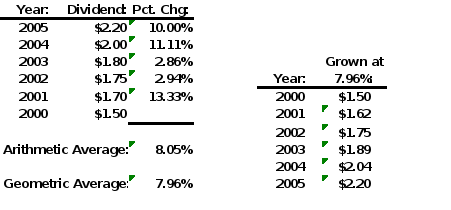
Geometric Average Dividend Growth Rate: A dividend growth rate based on a geometric average of historical returns.
Arithmetic Average Dividend Growth Rate: A dividend growth rate based on an arithmetic average of historical returns.
Below is an imbedded Excel spreadsheet that shows how geometric and arithmetic average dividend growth rates are calculated. The dividend data starts with $1.50 in 2000, and ends with $2.20 in 2005. In between, dividends were $1.70 in 2001, $1.75 in 2002, $1.80 in 2003, and $2.00 in 2004. (NB: This can easily be modified for the data contained in the erratic dividend growth example).
The Sustainable Growth Rate
Sustainable growth rate: A dividend growth rate that can be sustained by a company's earnings.
Retained earnings: Earnings retained within the firm to finance growth.
Payout ratio: Proportion of earnings paid out as dividends.
Retention ratio: Proportion of earnings retained for reinvestment.
Another way to estimate the firm's growth rate is to use the sustainable growth rate, which involves using the company's earnings to estimate g. Since earnings not paid out to investors as dividends are available for reinvestment, these funds can be used to finance future growth. The dividend payout is called the payout ratio and (1 - payout ratio) is the retention ratio, the proportion of funds retained for reinvestment. The sustainable growth rate is calculated as follows:
Sustainable growth rate = ROE x Retention ratio
= ROE x (1 - Payout ratio)
Analyzing ROE
Return on equity (ROE) = Net income / Equity
Keep in mind that because earnings fluctuate from year-to-year, security analysts must adjust sustainable growth rates to smooth out these earnings fluctuations.
ROE can be decomposed using the DuPont formula:
ROE = net margin x TA turnover x equity multiplier
This illustrates that understanding the business’ strategy will help the analyst determine the impact on growth and valuation.
The Two-Stage Dividend Growth Model
Two-stage dividend growth model: Dividend model that assumes a firm will temporarily grow at a rate different from its long-term growth rate.
Since there are many instances of companies that do not have a constant growth rate over the long term, the two -stage dividend growth model was developed to allow two growth rates to be incorporated in the stock price estimate. This model assumes an initial growth rate of g1 for T years, followed by a new growth rate, g2, which continues forever. The model is as follows:

This model requires that g2 < K, but g1 can be greater than K. This allows for the case where the growth rate in early years is large, and then settles down to a lower long-term growth rate.
The two-stage growth model is simply the combination of the constant growth model calculated twice (first and last parts of the equation), with the additional factors [(1 + g) / (1 + k)] just used to start and stop the two growth rates. It is also important to point out that g1 is the only growth rate used in the "time factors," [(1 + g) / (1 + k)]. It is a common error for students to use g1 in the first factor, and g2 in the second factor.
Nonconstant Growth in the First Stage
The main advantage of the constant perpetual growth model is its simplicity; however, there are several disadvantages:
To be used, the firm must pay dividends.
The growth rate must be less than the discount rate.
It is sensitive to the choice of the growth and discount rates.
It may be difficult to estimate the growth and discount rates.
Constant perpetual growth may not be a realistic assumption.
The two-stage growth model is more difficult to compute, but it has improvements:
It is more realistic because it allows for two growth rates.
It allows the first-stage growth rate to be greater than the discount rate.
This model is also sensitive to the choice of the growth and discount rates, and itrequires that the firm pay dividends to be used.
The H-Model
In most two-stage models, the assumption is two distinct growth rates. In reality, though, there may be a beginning and ending growth rates, with growth between these times changing to approach the more constant ending growth rate. If we assume a linear change over time, this is the H-Model.
Discount Rates for Dividend Discount Models
Beta: measure of a stock's risk relative to the stock market average.
Beta and the Capital Asset Pricing Model (CAPM) are introduced in this section. It is a brief introduction, with the full development left for chapter 18. This model is introduced to allow the calculation of the required return or discount rate for the dividend discount models, as follows:
Discount rate = U.S. T-bill rate + (Stock beta x Stock market risk premium)
Remember that the risk-free rate (T-bill rate) is the "wait" component (or time-value-of-money), and the beta times the market risk premium is the "worry" component (or risk premium).
To show the sensitivity of these models to the choice of growth and discount rates it is useful to see an example. The constant perpetual growth model is simple enough that one can vary the growth and discount rates several times, and do the calculations in a few minutes. For example, start with D1=$1.00, k=10%, and g=5%, which gives a stock value of $20. Now increase g to 6% and decrease k to 9% and the stock value is $33.33. Now decrease g to 4% and increase k to 11% and the stock value is $14.29. This gives a range of stock values from $14 to $33, which is not much help in determining if this stock is overvalued or undervalued. This dramatically shows how sensitive the stock price is to the estimate of the growth and discount rates.
Observations on Dividend Discount Models
Financial analysts readily acknowledge the limitations of dividend discount models. Consequently, they also turn to other valuation methods to expand their analyses.
The Residual Income Model
How do we value the many companies that don’t pay dividends? As it turns out, the residual income model (RIM) is an elegant and simple model that can be used just for this purpose. It turns out that that the RIM is closely related to the constant perpetual growth dividend model .
Residual Income
Let Bt–1stand for the book equity per share at the beginning of a period that ends at time t. Over the period, the stockholders have a required return on that investment of k. Thus, the required return in dollars, or required earnings per share (EPS), during the period that ends at time t, or REPSt, is just
REPSt = Bt−1 × k.
The difference between actual earnings, EPSt, and required earnings, REPSt, in the period is called the residual income, RI, and is given by
RIt = EPSt − REPSt = EPSt − Bt−1 × k.
Residual income is sometimes called Economic Value Added, or EVA for short. It is also called “abnormal” earnings.
Next, we can write the value of a share of stock as the sum of two parts. The first part is the current book value of the firm (i.e., what is currently invested). The second part is the present value of all future residual earnings. That is,
![]()
When we developed the constant perpetual growth model for dividend-paying stocks, we made the simplifying assumption that dividends grow at a constant rate of g. Here we make the similar assumption that earnings grow at a constant rate of g. With this assumption, we can simplify the equation above to

The equation above is known as the residual income model, or RIM. If we write both terms in the RIM equation with a common denominator, we get the alternate form of the RIM:

The RIM versus the Constant Growth DDM
The RIM is closely related to the constant perpetual growth dividend model. To see the connection, assume that the change in book value per share on a stock is equal to earnings per share minus dividends. This is known as the clean surplus relationship (CSR), written as
EPS1 − D1 = B1 − B0 or D1 = EPS1 + B0 − B1
Note that in practice the CSR does not exactly hold because various “dirty” surplus changes to book equity are allowed. But it is usually a good approximation, particularly over the long run.
Assuming that earnings and dividends per share grow at rate g, the CSR shows that book value per share must also grow at rate g, so we can write
D1 = EPS1 + B0 − B1 = EPS1 + B0 − B0(1 + g) = EPS1 − B0 × g
Plugging the expression for D1 into the alternate form of the RIM, we see right away that the residual income model is mathematically the same as the constant perpetual growth model:
![]()
So these two approaches are really the same, but the RIM is more flexible because we can apply it to any stock, not just dividend payers.
The Free Cash Flow Model
How do we value a firm that has negative earnings and no dividends? Well, the FCF model gives us an alternative. Because earnings are impacted by noncash expenses (depreciation in particular), cash flow can be positive even if earnings are negative.
Free Cash Flow
FCF is given as:
FCF = Net Income + Depreciation – Capital Expenditures
The FCF Model Versus the Constant Growth DDM
Free cash flow could be used to pay down debt, reinvest in the firm, or pay dividends. Thus, it is cash flow at the total firm level. So, when we use FCF to value, we are valuing the firm, not simply equity. This has implications.
First, we need to use an asset beta, not an equity beta. This will adjust for the amount of leverage used by the firm.

Once we have the firm value (using similar formulas to the DDM), we need to subtract out the debt value to get to the value of the firm’s equity.
Price Ratio Analysis
Price ratios are frequently used by financial analysts, and the ratios are used more often than dividend discount models.
Price-Earnings Ratios
Price-earnings ratio (P/E): Current stock price divided by annual earnings per share (EPS).
Earnings yield: Inverse of the P/E ratio: earnings divided by price (E/P).
Growth stocks: A term often used to describe high P/E stocks.
Value stocks: A term often used to describe low P/E stocks.
The P/E ratio is one of the most popular ratios used to assess stock value. It is calculated as the current stock price divided by the most recent annual earnings per share. EPS can be computed using either the sum of the last four quarters' earnings, or the most recent quarter's earnings times four. Stocks that have high P/Es are considered growth stocks, while those with low P/Es are considered value stocks. The growth stocks have higher expected earnings growth, while the value stocks are considered "cheap" relative to current earnings. We only know historically if growth and value stocks are truly good investments.
Price-Cash Flow Ratios
Price-cash flow ratio (P/CF): Current stock price divided by current cash flow per share.
The price-cash flow ratio is calculated as the current stock price divided by annual cash flow per share. Like earnings, cash flow can be computed as the sum of the most recent four quarters cash flow, or four times the most recent quarter's cash flow. There are many definitions of cash, but the most common and easiest to use is net income plus depreciation. It is easy to show that a firm with higher depreciation will have a lower net income, but higher cash flow, since depreciation is a non-cash charge. A firm is considered to have good-quality earnings when its earnings per share is not significantly larger than its cash flow per share.
Price-Sales Ratios
Price-sales ratio (P/S): Current stock price divided by annual sales per share.
Price-sales ratio is calculated as the current stock price divided by annual sales revenue per share. This rate addresses the firm's ability to generate sales growth. A high P/S ratio suggests high sales growth, while a low P/S ratio indicates slow sales growth.
Price-Book Ratios
Price-book ratio (P/B): Market value of a company's common stock divided by its book (or accounting) value of equity.
The price-book ratio is also called the market-book ratio and is calculated as the market value of the firm's outstanding stock divided by its book value of equity. Book values represent historical cost. Thus, P/B indicates what the firm's equity is worth relative to its cost. Due to changing accounting standards this ratio may be more difficult to interpret.
Applications of Price Ratio Analysis
Three expected stock prices for Intel and Disney are estimated using the price/earnings ratio, the price/cash flow ratio, and the price/sales ratio.
Expected Price = Historical P/E ratio x Current EPS x (1 + Projected EPS Growth Rate)
Expected Price = Historical P/CF ratio x Current CFPS x (1 + Projected CFPS Growth Rate)
Expected Price = Historical P/S ratio x Current SPS x (1 + Projected Sales Growth Rate)
An Analysis of the McGraw-Hill Company
A complete example of ratio analysis for McGraw-Hill Company is provided in the text. This example is extremely helpful in showing how these formulas can be implemented.
Source: Jordan, B., Miller, Jr., T., & Dolvin, S. (2012). Fundamentals of investment: Valuation and managment. (6th ed.). New York, NY: McGraw-Hill.
4-0


