Discussion: Bias, Statistics, News and Lies. Previous Next Statistics and Lies "There are three kinds of lies: lies, damned lies, and statistics." - Mark Twain. A mid-twentieth century book: Lesson
0
BUS520 SLP 3
Your Name
Trident University International
BUS520 Business Analytics and Decision Making
Due Date
BUS520 SLP 3
Remember to always indent the first line of a paragraph (use the tab key) or paragraph formatting (see below). The introduction should be short (2-3 sentences). The margins, font size, spacing, and font type (bold or plain) are set in APA format. While you may change the names of the headings, do not change the formatting or style of font except as specified below. This template uses Times New Roman 12-point. You may also use: Calibri (11), Arial (11), Georgia (11) or Lucida Sans Unicode (10). No quotations are permitted in this paper. Since you are engaging in research, be sure to cite and reference the sources in APA format. NOTE: failure to use research with accompanying citations to support content will result in reduced scoring “Level 2-Developing” across the grading rubric. This is a professional paper; not a personal one based on feelings. It must be written in the third person; this means words like “I”, “we”, and “you” are not appropriate.
Correlation: Organizational Commitment x Overall Job Satisfaction
Run a correlation in Excel between Organizational Commitment and Overall Job Satisfaction. Create a Scatterplot with trendline for the variables. Interpret the output. How is the data correlated? Is it a strong relationship? (Include Correlation and Scatterplot in Word document) How to Label Figures in APA Format
Correlation: Organizational Commitment x Intrinsic Job Satisfaction
Run a correlation in Excel between Organizational Commitment and Intrinsic Job Satisfaction. Create a Scatterplot with trendline for the variables. Interpret the output. How is the data correlated? Is it a strong relationship? (Include Correlation and Scatterplot in Word document) How to Label Figures in APA Format
Correlation: Organizational Commitment x Extrinsic Job Satisfaction
Run a correlation in Excel between Organizational Commitment and Extrinsic Job Satisfaction. Create a Scatterplot with trendline for the variables. Interpret the output. How is the data correlated? Is it a strong relationship? (Include Correlation and Scatterplot in Word document) How to Label Figures in APA Format
Managerial Implications
Discuss implications for management. Research correlations between organizational commitment and job satisfaction connections between the variables you tested. Include workplace applications that may be implemented based on the findings. (Research Required) 1 page.
Conclusion
Add some concluding remarks: 2 to 3-sentence conclusion.
References
Below are some basic rules to follow when creating a reference list:
Begin your reference list on a new page.
The word References should be centered and bold at the top of the page.
Double-space your reference list.
For each author, list the last name first followed by the initials for their first and middle names.
Arrange your reference list alphabetically by the last name of the author.
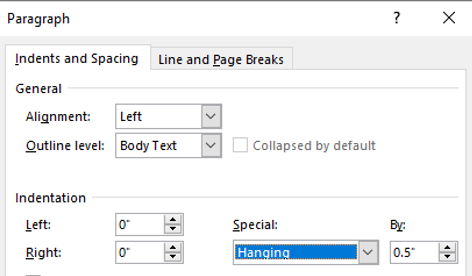
Use a hanging indent after the first line of your citation (Word does this for you). Type your entry and then click “Paragraph” on the HOME tab to create the “hanging indent.”
APA has a handout for the most common types of references.


