I don't need an explanation. I would like to have the answer to compare to the ones I have already
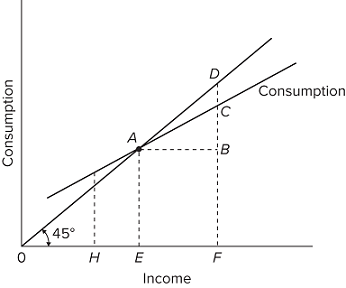
Refer to the given diagram. The marginal propensity to save is
Top of Form
Multiple Choice
 CD/EF.
- CB/CF.
- CB/AF.
- EF/CB.
Bottom of Form
Ca = 25 + 0.75 (Y − T)
Ig = 50
Xn = 10
G = 70
T = 30
(Advanced analysis) The accompanying equations are for a mixed open economy. The letters Y, Ca, Ig, Xn, G, and T stand for GDP, consumption, gross investment, net exports, government purchases, and net taxes, respectively. Figures are in billions of dollars. The multiplier for this economy is
Top of Form
Multiple Choice
- 4.
- 3.
- 2.
- 2.33.
Bottom of Form
Which one of the following would increase per-unit production cost and therefore shift the aggregate supply curve to the left?
Top of Form
Multiple Choice
- a reduction in business taxes
- production bottlenecks occurring when producers near full plant capacity
- an increase in the price of imported resources
- deregulation of industry
Bottom of Form
When a consumption schedule is plotted as a straight line, the slope of the consumption line is
Top of Form
Multiple Choice
- vertical.
- horizontal.
- greater than the slope of the 45° line.
- less than the slope of the 45° line.
Bottom of Form
If GDP exceeds aggregate expenditures in a private closed economy,
Top of Form
Multiple Choice
- saving will exceed planned investment.
- planned investment will exceed saving.
- planned investment will exceed actual investment.
- injections will exceed leakages.
Bottom of Form
Which of the diagrams for the U.S. economy best portrays the effects of a substantial reduction in government spending?
Top of Form
Multiple Choice
- A
- B
- C
- D
Bottom of Form
If households consume less at each level of disposable income, they are
Top of Form
Multiple Choice
- saving more.
- saving less.
- spending more.
- working less.
Bottom of Form
The consumption and saving schedules reveal that the
Top of Form
Multiple Choice
- MPC is greater than zero but less than one.
- MPC and APC are equal at the point where the consumption schedule intersects the 45-degree line.
- APS is positive at all income levels.
- MPC is equal to or greater than one at all income levels.
Bottom of Form
|
| Change in Income | Change in Consumption | Change in Saving |
| Assumed Increase in Investment | $ 5.00 | $ 1.25 | |
| Second Round | $ 2.81 | ||
| All Other Rounds | $ 8.44 | ||
| Totals | $ 5.00 |
The table illustrates the multiplier process resulting from an autonomous increase in investment by $5. The total change in income resulting from the initial change in investment will be
Top of Form
Multiple Choice
- $5.
- $10.
- $15.
- $20.
Bottom of Form
| Price Level | C | Ig | G | X | M | Real GDP |
| 128 | $ 18 | $ 2 | $ 3 | $ 1 | $ 5 |
|
| 125 | 20 |
| ||||
| 122 | 22 |
| ||||
| 119 | 24 |
| ||||
| 116 | 26 | 10 |
|
In the accompanying table for a particular country, C is consumption expenditures, Ig is gross investment expenditures, G is government expenditures, X is exports, and M is imports. All figures are in billions of dollars. If this nation's equilibrium price level is 125, its net exports will be
Top of Form
Multiple Choice
- minus $4 billion.
- minus $2 billion.
- zero.
- $2 billion.
Bottom of Form
| Real Domestic Output Demanded (in Billions) | Price Level (Index Value) | Real Domestic Output Supplied (in Billions) |
| $ 3,000 | 350 | $ 9,000 |
| 4,000 | 300 | 8,000 |
| 5,000 | 250 | 7,000 |
| 6,000 | 200 | 6,000 |
| 7,000 | 150 | 5,000 |
| 8,000 | 100 | 4,000 |
The accompanying table shows the aggregate demand and aggregate supply schedules for a hypothetical economy. The equilibrium price and output levels will be
Top of Form
Multiple Choice
- 200 and $5,000.
- 200 and $6,000.
- 250 and $7,000.
- 300 and $8,000.
Bottom of Form
The size of the multiplier is equal to the
Top of Form
Multiple Choice
- slope of the consumption schedule.
- reciprocal of the slope of the consumption schedule.
- slope of the saving schedule.
- reciprocal of the slope of the saving schedule.
Bottom of Form
The level of aggregate expenditures in a mixed open economy consists of
Top of Form
Multiple Choice
- Ca + Ig + Xn.
- Ca + Ig + G + T + Xn.
- Ca + Ig + Xn + G.
- Ca + G.
Bottom of Form
(Advanced analysis) Assume the consumption schedule for a private closed economy is C = 40 + 0.75Y, where C is consumption and Y is gross domestic product. The multiplier for this economy is
Top of Form
Multiple Choice
- 3.
- 4.
- 5.
- 10.
Bottom of Form
Dissaving occurs where
Top of Form
Multiple Choice
- income exceeds consumption.
- saving exceeds consumption.
- consumption exceeds income.
- saving exceeds income.
Bottom of Form
The $787 billion stimulus package enacted by the Federal government in 2009 to try to deal with the Great Recession was intended to
Top of Form
Multiple Choice
- shift the aggregate expenditures schedule down.
- close an inflationary expenditures gap.
- bring inflation down.
- push the aggregate expenditures schedule upward.
Bottom of Form
| (1) | (2) | (3) | |||||
| DI | C | DI | C | DI | C | ||
| $ 0 | $ 4 | $ 0 | $ 65 | $ 0 | $ 2 | ||
| 10 | 11 | 80 | 125 | 20 | 20 | ||
| 20 | 18 | 160 | 185 | 40 | 38 | ||
| 30 | 25 | 240 | 245 | 60 | 56 | ||
| 40 | 32 | 320 | 305 | 80 | 74 | ||
| 50 | 39 | 400 | 365 | 100 | 92 | ||
Refer to the given consumption schedules. DI signifies disposable income and C represents consumption expenditures. All figures are in billions of dollars. A $2 billion increase in consumption at each level of DI could be caused by
Top of Form
Multiple Choice
- a decrease in consumer wealth.
- new expectations of higher future income.
- an increase in taxation.
- an increase in saving.
Bottom of Form
In a private closed economy, when aggregate expenditures exceed GDP,
Top of Form
Multiple Choice
- GDP will decline.
- business inventories will rise.
- saving will decline.
- business inventories will fall.
Bottom of Form
| Amount of Real Output Demanded | Price Level (Index Value) | Amount of Real Output Supplied |
| $ 200 | 300 | $ 500 |
| 300 | 250 | 450 |
| 400 | 200 | 400 |
| 500 | 150 | 300 |
| 600 | 100 | 200 |
The table gives aggregate demand and supply schedules for a hypothetical economy. If the price level is 250 and producers supply $450 of real output,
Top of Form
Multiple Choice
- a shortage of real output of $150 will occur.
- a shortage of real output of $100 will occur.
- a surplus of real output of $150 will occur.
- neither a shortage nor a surplus of real output will occur.
Bottom of Form
The simple multiplier 1/MPS
Top of Form
Multiple Choice
- understates the actual multiplier because it includes leakages in domestic spending from the purchase of imports or the paying of taxes.
- understates the actual multiplier because it excludes leakages in domestic spending from the purchase of imports or the paying of taxes.
- overstates the actual multiplier because it includes leakages in domestic spending from the purchase of imports or the paying of taxes.
- overstates the actual multiplier because it excludes leakages in domestic spending from the purchase of imports or the paying of taxes.
Bottom of Form
Suppose that technological advancements stimulate $24 billion in additional investment spending. If the MPC = 0.8, how much will the change in investment increase aggregate demand?
Top of Form
Multiple Choice
- $120 billion
- $24 billion
- $192 billion
- $22.2 billion
Bottom of Form
If investment increases by $30 billion and the economy's MPC is 0.8, the aggregate demand curve will shift
Top of Form
Multiple Choice
- rightward by $150 billion at each price level.
- rightward by $30 billion at each price level.
- leftward by $150 billion at each price level.
- leftward by $60 billion at each price level.
Bottom of Form
If the MPC is 0.5 and the equilibrium GDP is $60 billion below the full-employment GDP, then the size of the recessionary expenditure gap is
Top of Form
Multiple Choice
- $30 billion.
- $50 billion.
- $60 billion.
- $120 billion.
Bottom of Form
(Advanced analysis) Assume the following consumption schedule: C = 20 + 0.9Y, where C is consumption and Y is disposable income. At a(n) $1,000 level of disposable income, the level of saving is
Top of Form
Multiple Choice
- $80.
- $920.
- $180.
- $18.
Bottom of Form
Assume a machine that has a useful life of only one year costs $2,000. Assume, also, that net of such operating costs as power, taxes, and so forth, the additional revenue from the output of this machine is expected to be $2,200. The expected rate of return on this machine is
Top of Form
Multiple Choice
- 10 percent.
- 20 percent.
- 30 percent.
- 2 percent.
Bottom of Form
If disposable income is $900 billion when the average propensity to consume is 0.6, it can be concluded that saving is
Top of Form
Multiple Choice
- $360 billion.
- $540 billion.
- $900 billion.
- $400 billion.
Bottom of Form
If the multiplier in an economy is 10, a $20 billion increase in net exports will
Top of Form
Multiple Choice
- increase GDP by $200 billion.
- reduce GDP by $2 billion.
- decrease GDP by $200 billion.
- increase GDP by $20 billion.
Bottom of Form
Suppose that a new machine tool having a useful life of only one year costs $80,000. Suppose, also, that the net additional revenue resulting from buying this tool is expected to be $112,000. The expected rate of return on this tool is
Top of Form
Multiple Choice
- 40 percent.
- 60 percent.
- 30 percent.
- 12 percent.
Bottom of Form
If the marginal propensity to save is 0.2 in an economy, a $40 billion rise in investment spending will increase consumption by
Top of Form
Multiple Choice
- 160.
- 200.
- 40.
- 8.
Bottom of Form
An economy is employing 3 units of capital, 3 units of raw materials, and 2 units of labor to produce its total output of 120 units. Each unit of capital costs $10; each unit of raw materials, $4; and each unit of labor, $3. The per-unit cost of production in this economy is
Top of Form
Multiple Choice
- $0.40.
- $8.00.
- $0.30.
- $0.50.
Bottom of Form
Suppose that the level of GDP increased by $100 billion in a private closed economy where the marginal propensity to consume is 0.8. Aggregate expenditures must have increased by
Top of Form
Multiple Choice
- $20 billion.
- $100 billion.
- $80 billion.
- $10 billion.
Bottom of Form
If a $200 billion increase in investment spending creates $200 billion of new income in the first round of the multiplier process and $160 billion in the second round, the MPC in the economy is
Top of Form
Multiple Choice
- 0.8.
- 0.6.
- 0.2.
- 0.9.
Bottom of Form
| Input Quantity | Real Domestic Output |
| 100 | 200 |
| 150 | 300 |
| 200 | 400 |
The table gives information about the relationship between input quantities and real domestic output in a hypothetical economy. If the price of each input is $4, the per-unit cost of production in the economy is
Top of Form
Multiple Choice
- $2.00.
- $0.50.
- $0.20.
- $1.50.
Bottom of Form
If the marginal propensity to consume is 0.8 then the marginal propensity to save must be
Top of Form
Multiple Choice
- 0.2.
- 1.
- 1.2.
- 0.8.
Bottom of Form
Suppose that an economy produces 500 units of output. It takes 10 units of labor at $15 a unit and 3 units of capital at $50 a unit to produce this amount of output. The per unit cost of production is
Top of Form
Multiple Choice
- $0.60.
- $1.60.
- $1.20.
- $0.30.
Bottom of Form
Suppose the economy's multiplier is 5. Other things equal, a $5 billion decrease in government expenditures on national defense will cause equilibrium GDP to
Top of Form
Multiple Choice
- decrease by $25 billion.
- decrease by $50 billion.
- increase by $25 billion.
- decrease by $5 billion.
- remain unchanged.
Bottom of Form
Suppose that real domestic output in an economy is 20 units, the quantity of inputs is 10, and the price of each input is $4. The level of productivity is
Top of Form
Multiple Choice
- 2.
- 20.
- 10.
- 5.
Bottom of Form
Suppose that real domestic output in an economy is 120 units, the quantity of inputs is 50, and the price of each input is $6. The per-unit cost of production in the economy described is
Top of Form
Multiple Choice
- $2.50.
- $25.
- $4.
- $20.
Bottom of Form
Assume the MPC is 0.8. If government were to impose $30 billion of new taxes on household income, consumption spending would initially decrease by
Top of Form
Multiple Choice
- $24 billion.
- $30 billion.
- $60 billion.
- $6 billion.
Bottom of Form
If a lump-sum income tax of $25 billion is levied and the MPS is 0.4, the consumption schedule will shift
Top of Form
Multiple Choice
- downward by $15 billion.
- upward by $15 billion.
- downward by $25 billion.
- downward by $10 billion.
Bottom of Form


