Module 1 - Case EQUILIBRIUM, SUPPLY AND DEMAND Assignment Overview Supply and Demand in the Real World A commodity is the focus of this case which uses real data for price fluctuations over 6 months.
0
BUS530 Case 1
Your Name
Trident University International
BUS530 Managerial Economics
Due Date
BUS530 Case 1
Remember to always indent the first line of a paragraph (use the tab key) or paragraph formatting (see below). The introduction should be short (2-3 sentences). The margins, font size, spacing, and font type (bold or plain) are set in APA format. While you may change the names of the headings, do not change the formatting or style of font except as specified below. This template uses Times New Roman 12-point. You may also use: Calibri (11), Arial (11), Georgia (11) or Lucida Sans Unicode (10). No quotations are permitted in this paper. Since you are engaging in research, be sure to cite and reference the sources in APA format. NOTE: failure to use research with accompanying citations to support content will result in reduced scoring “Level 2-Developing” across the grading rubric. This is a professional paper; not a personal one based on feelings. It must be written in the third person; this means words like “I”, “we”, and “you” are not appropriate.
**********NEW DATA AND SCENARIOS ARE USED EACH SESSION**********
If you procure old assignments from students or websites and use the data for your assignment, you will receive a zero because it is considered a violation of the University's academic integrity policy. The case will be referred and become part of your collegiate record. In certain circumstances, you may be awarded an F for the course.
If you are taking this class for a second time, submission of past work involving the data sets will result in a zero for the assignment. Your answers will be wrong since you are working with a different set of numbers and a different industry.
**********NEW DATA AND SCENARIOS ARE USED EACH SESSION**********
6-Month Commodity Analysis
The course spreadsheet contains a Commodity and a link to a commodity analysis website which includes price data in increments from 6 months to 30 years. The site also has a tool that allows for comparison to another product.
Using 6-month data, copy and paste the table to Excel (the export function does not work). Create two line charts: Price fluctuation over time, % Change in Prices. Provide a brief description of each visual. How to Label Figures in APA Format
Research the commodity from an economic standpoint (include supply and demand). Describe what is happening with the commodity during the 6 months. You may include information from the prior year. Find a balance between explanations, data and statistics provided. You must decide what information should be included in this section. This section must be ¾ of a page in length.
Commodity Comparison
Next, select a similar commodity in the same category; use the page’s comparison function and select “rate of change” comparison. Select a commodity that contains data (some on the page list do not contain the required data) Using 6-month data, copy and paste the table to Excel. Create a comparative bar chart: Compare Price fluctuation over time. (Hint: move columns so the ones being analyzed are next to each other.) Provide a brief description of the chart.
Research the second commodity from an economic standpoint. Describe what is happening with the commodity during the 6 months. You may include information from the prior year. This section must be ¾ of a page in length.
Commodity Index
Using the corresponding Commodity Index, copy and paste the table to Excel. Create a bar chart: Compare the rate of change between the two commodities and the index. Provide a brief description of the chart.
Research the overall commodity index from an economic standpoint. Describe what has occurred with the commodity category during the 6-month time period. This section must be 1/2 of a page in length.
Overall Analysis
As a conclusion, analyze how the changes in prices shifted demand for finished products of the commodity. Would consumers buy more of the good? Buy more of a different good? Include how substitute and complementary goods were part of the consumer’s decisions. Include a discussion of how sellers are affected by changes. (Research Required). This section will be 1 page in length.
Conclusion
Add some concluding remarks: 2 to 3-sentence conclusion.
References
Below are some basic rules to follow when creating a reference list:
Begin your reference list on a new page.
The word References should be centered and bold at the top of the page.
Double-space your reference list.
For each author, list the last name first followed by the initials for their first and middle names.
Arrange your reference list alphabetically by the last name of the author.
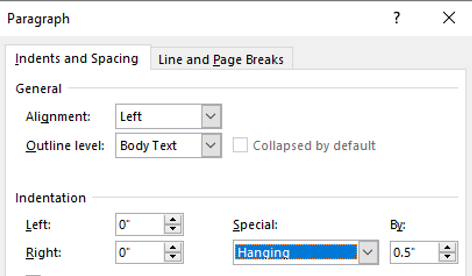
Use a hanging indent after the first line of your citation (Word does this for you). Type your entry and then click “Paragraph” on the HOME tab to create the “hanging indent.”
APA has a handout for the most common types of references.


